- Published by:
- Fire Services Implementation Monitor
- Date:
- 19 Oct 2026
The Country Fire Authority (CFA) and Fire Rescue Victoria (FRV) have provided their quarterly fire service performance updates for the quarter 4, 2025–26 reporting period (1 April 2025 to 30 June 2025) to the Fire Services Implementation Monitor (FSIM).
In this quarter, CFA reported on 26 indicators and FRV reported on 50 measures.
The FSIM has reported on select results based on the following criteria:
Demonstrates a notable achievement:
- CFA: Maintain high levels of community trust in the CFA (annual indicator 1.1.1).
- CFA: Decrease in median time spent suppressing structure fires (time spent on scene of accident) (quarterly indicator 2.2.3).
- FRV: Percentage of FRV capital projects: On time (measure 7.5.i).
- FRV: Number of community members attending fire education program sessions delivered by FRV (quarterly measure 8.3i).
- FRV: Percentage of command personnel who undertake annual command skills maintenance scenario training (quarterly measure 11.5).
Continuing off-track trend over repeated quarters:
- CFA: A decrease in workplace injuries (volunteer operational activity) (quarterly indicator 3.1.2).
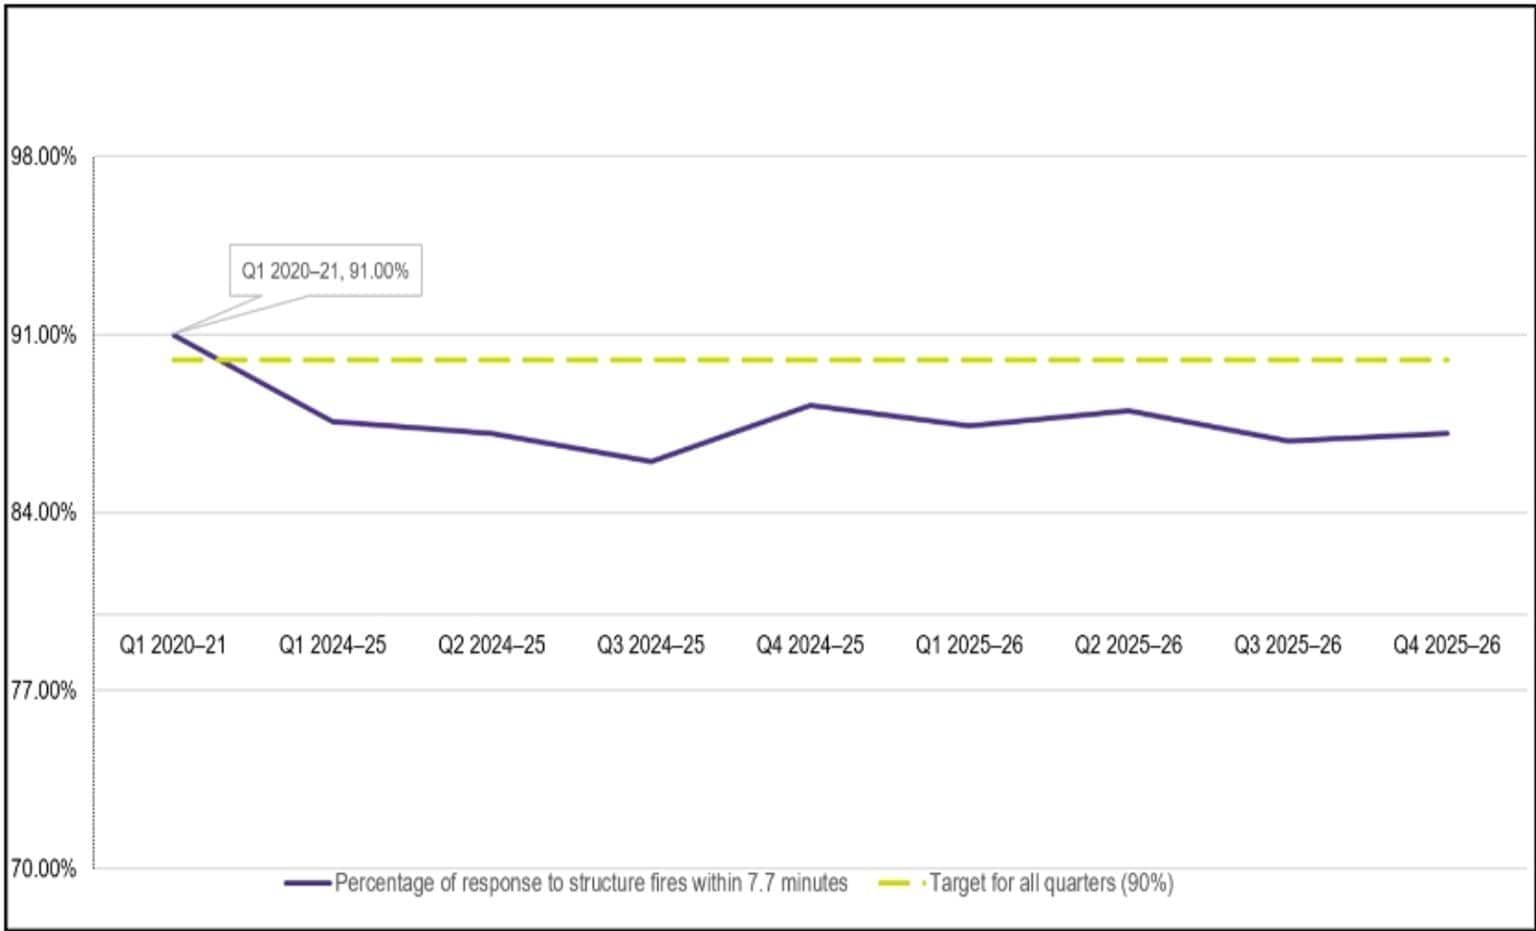
- FRV: Percentage of response times within the FRV district within FRV benchmark (YTD) to structure fire incidents within 7.7 minutes (target 90%) (quarterly measure 11.1.i).
Significant change from the baseline or previous comparable quarter (undesirable outcome):
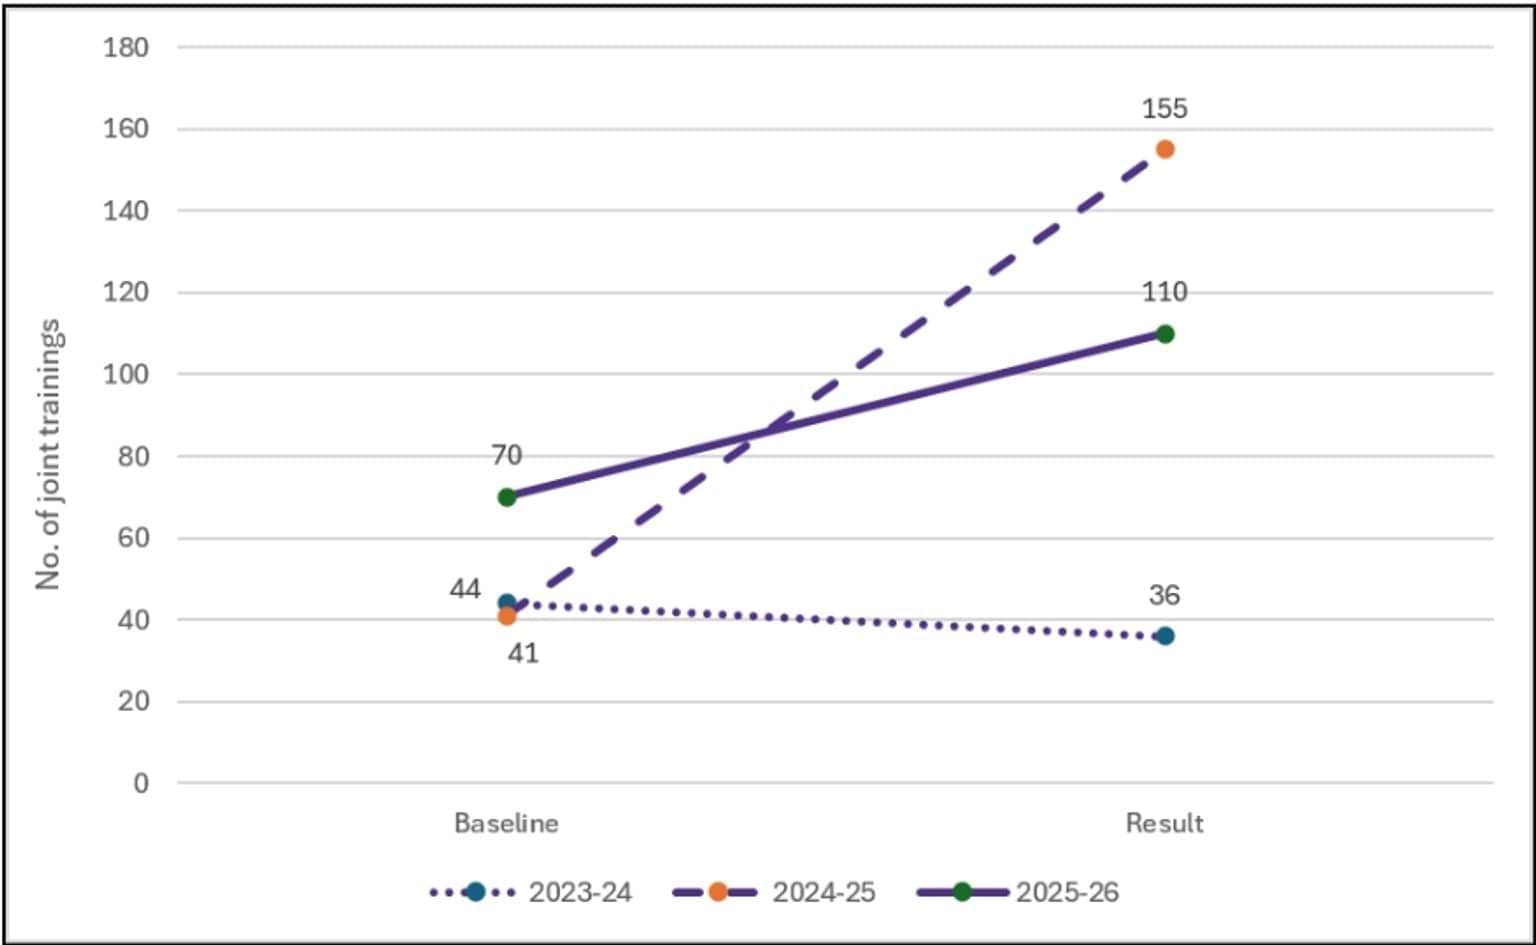
- CFA: Increase in the number of joint FRV/CFA training and exercises (annual indicator 4.3.2).
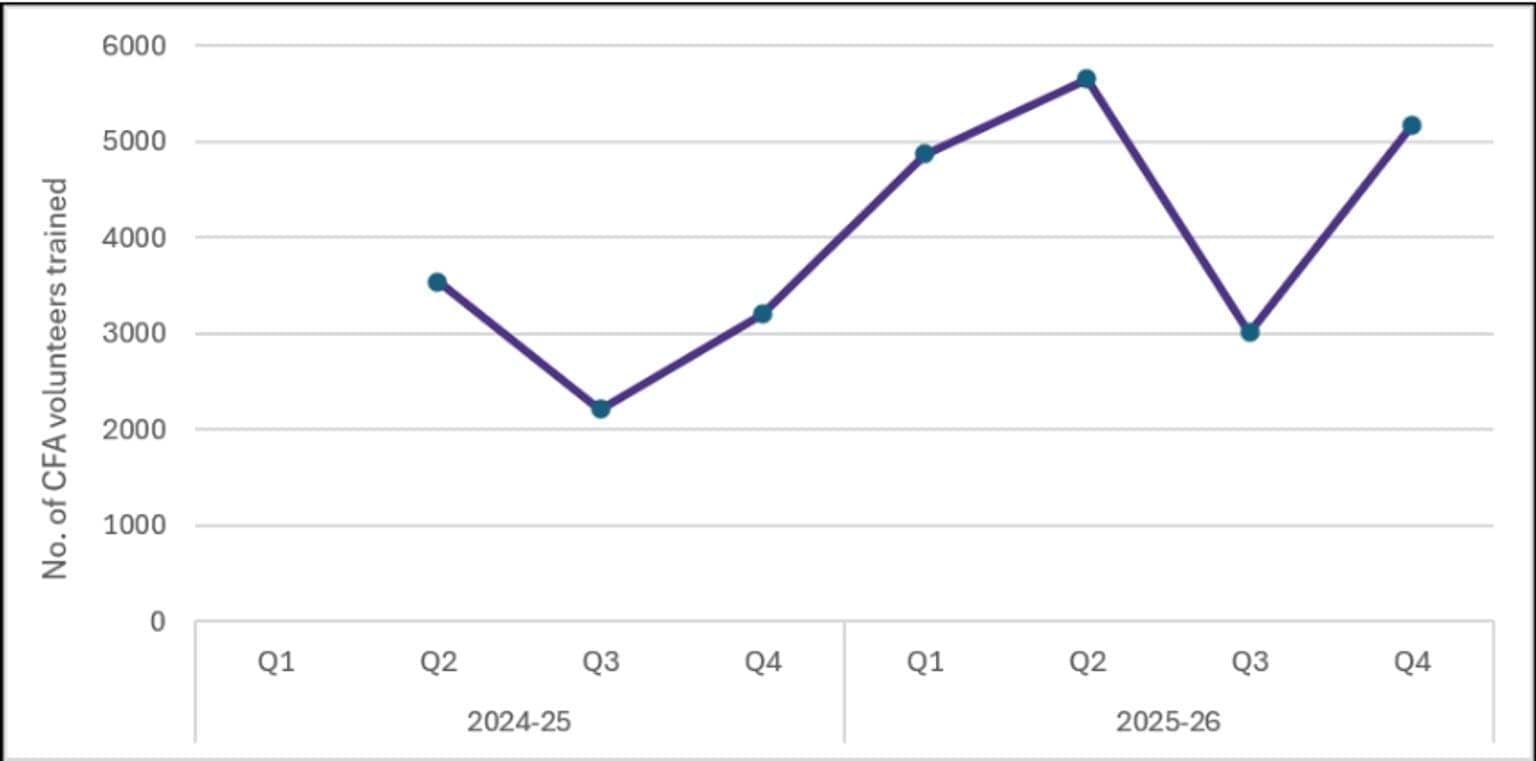
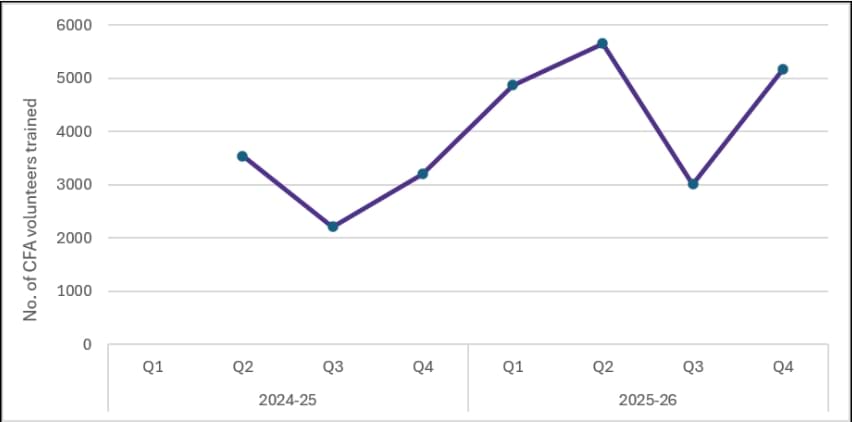
- CFA: Increase in delivery of operational training to CFA volunteers (quarterly indicator 3.4.7).
The FSIM acknowledges CFA and FRV for their ongoing cooperation and active contribution to the FSIM’s monitoring and reporting activities.
1. Summary
The Fire Services Outcomes Framework Progress Report is prepared and published in accordance with the Fire Services Implementation Monitor’s (FSIM) functions under section 141 of the Fire Rescue Victoria Act 1958 (Vic).
It includes results and commentary from the FSIM on select results from the Country Fire Authority’s (CFA) and Fire Rescue Victoria’s (FRV) respective outcomes frameworks for quarter 4 (Q4) of the 2025–26 financial year.
The FSIM publishes these quarterly reports on its website at Fire Services Implementation Monitor publications.
In Q4 2025–26:
- CFA’s Outcomes Framework Report reported on 28 out of 28 quarterly indicators (see Appendix A) and 19 out of 19 annual indicators (see Appendix B).
- FRV’s Outcomes Framework Progress Report reported on 50 quarterly measures and 8 annual measures (see Appendix C).
Revised FRV Outcomes Framework 2025 – annual measures
This FSIM received results for annual measures under FRV’s revised Outcomes Framework for the first time this reporting period. This report does not include any FRV annual measures, noting that comparisons with previous years’ results are not possible and several quarterly measures met FSIM criteria for inclusion.
CFA indicators and FRV measures short-listed for reporting
The FSIM has reported on select results based on the following criteria:
Demonstrates a notable achievement:
- CFA: Maintain high levels of community trust in the CFA (annual indicator 1.1.1).
- CFA: Decrease in median time spent suppressing structure fires (time spent on scene of accident) (quarterly indicator 2.2.3).
- FRV: Percentage of FRV capital projects on time (quarterly measure 7.5i).
- FRV: Number of community members attending fire education program sessions delivered by FRV (quarterly measure 8.3i).
- FRV: Percentage of command personnel who undertake annual command skills maintenance scenario training (quarterly measure 11.5).
Continuing off-track trend over repeated quarters:
- CFA: A decrease in workplace injuries (volunteer operational activity) (quarterly indicator 3.1.2).
- FRV: Percentage of response times within the FRV district within FRV benchmark (YTD) to structure fire incidents within 7.7 minutes (target 90%) (quarterly measure 11.1.i).
Significant change from baseline or previous comparable quarter (undesirable outcome):
- CFA: Increase in the number of joint FRV/CFA training and exercises (annual indicator 4.3.2).
- CFA: Increase in delivery of operational training to CFA volunteers (quarterly indicator 3.4.7).
2. Outcomes framework Q4 results
The Fire Services Implementation Monitor’s analysis of select results from Q4 2025–26 fire services outcome measures.
2.1 Demonstrates a notable achievement
Summary of notable achievements recorded by CFA and FRV this quarter.
2.2 Continuing off-track trend over repeated quarters
Summary of outcome measures that represent an off-track trend over repeated quarters.
2.3 Significant change from the baseline or previous comparable quarter (undesirable outcome)
Summary of outcome measures that recorded a significant change from the baseline or previous comparable quarter.
2.1 Demonstrates a notable achievement
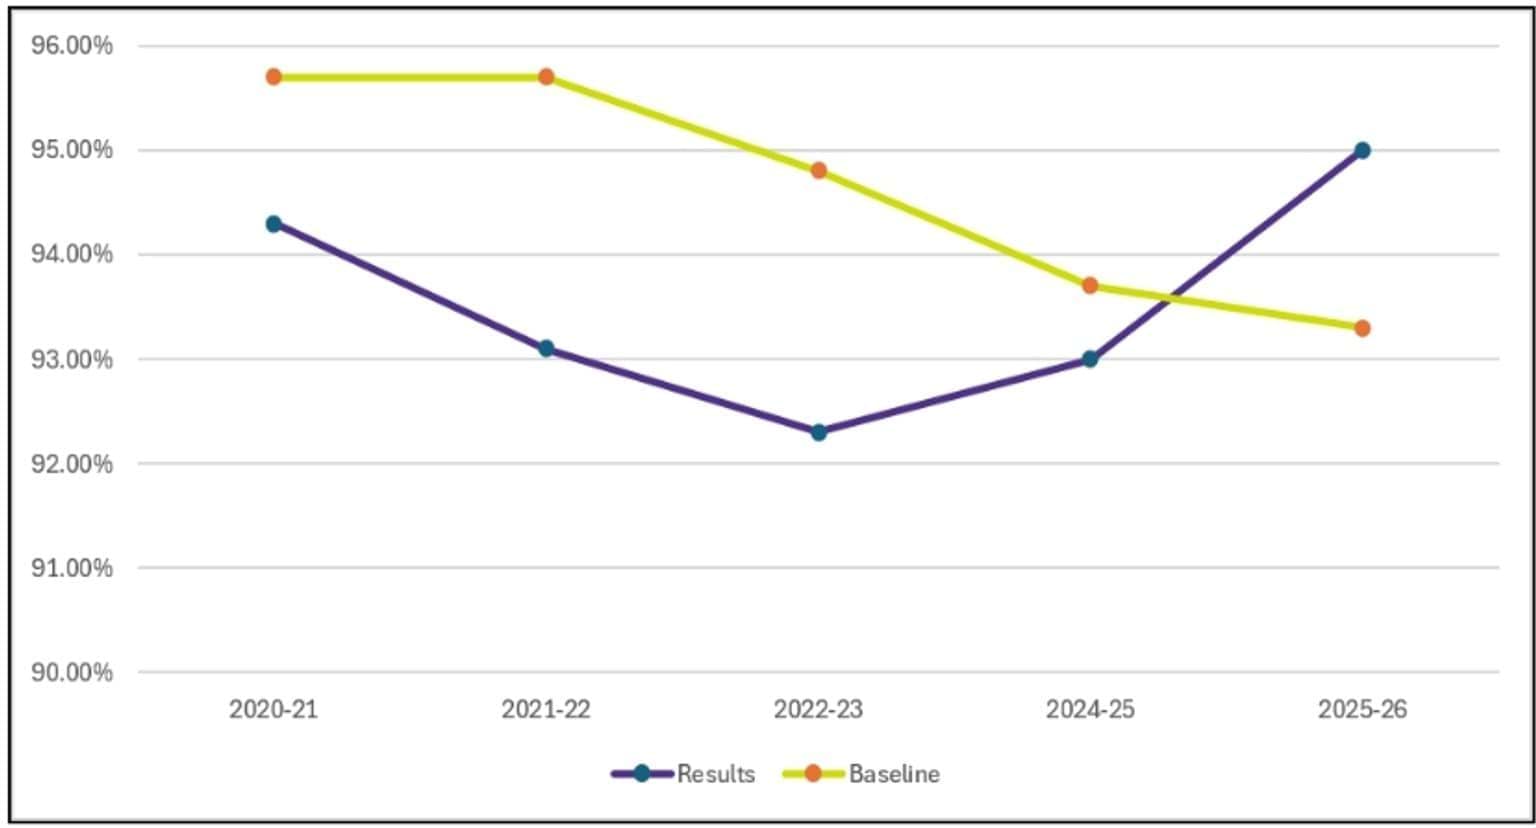
CFA: Maintain high levels of community trust in the CFA
The 2025-26 result for CFA’s indicator of maintaining high levels of community trust in the CFA is the highest result since the fire services reform commenced in 2020-21. Of the 1,088 respondents to the Annual Post Season survey, 95% indicated a high level of trust in the fire services provided by CFA.
The survey is conducted at the end of the bushfire season to understand the attitudes and preparedness of households living in bushfire risk locations in Victoria. CFA advised that potential respondents invited to participate in the survey are limited to people who live in houses that are either within 1 kilometre of the nearest bushland and/or live on a small acreage or on a large farm. The sample included residents from the West, North West, North East, South West and South East, in proportions similar to the population.
The severity of the 2025-26 bushfire seasons and results of this indicator highlights the important connection between CFA and people living in bushfire prone areas.
Figure 1: Maintain high levels of community trust in the CFA
CFA: Decrease in median time spent suppressing structure fires (time spent on scene of accident)
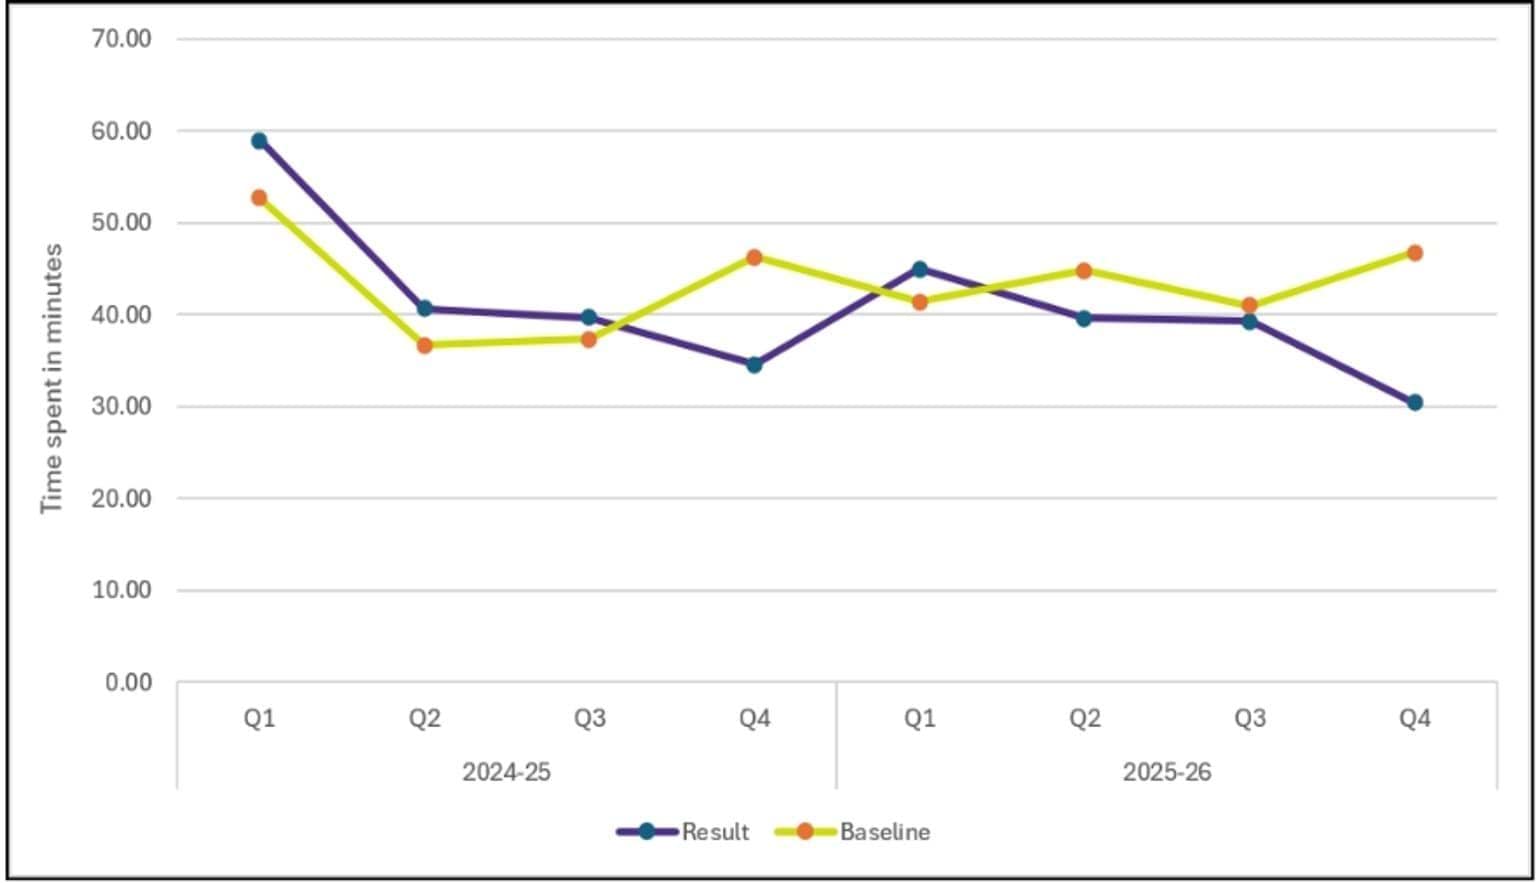
CFA reported a result of 30 minutes and 25 seconds for the indicator of median time spent suppressing structure fires (time spent on scene of accident). This result is the lowest median time for 2025-26 and is over 16 minutes below the Q4 baseline of 46 minutes and 45 seconds.
CFA advised that a possible explanation for this result was the greater proportion of structure fires that occurred in hazard classes 2 and 3, compared with the typical distribution. These hazard classes are medium to low urban areas and include residential structures, commercial centres, industrial and high-density community services. The location of these fires in proximity to CFA stations likely enabled CFA vehicles to arrive on scene quickly, which maximised the opportunity to contain fires before they developed.
Figure 2: Decrease in median time spent suppressing structure fires (time spent on scene of accident)
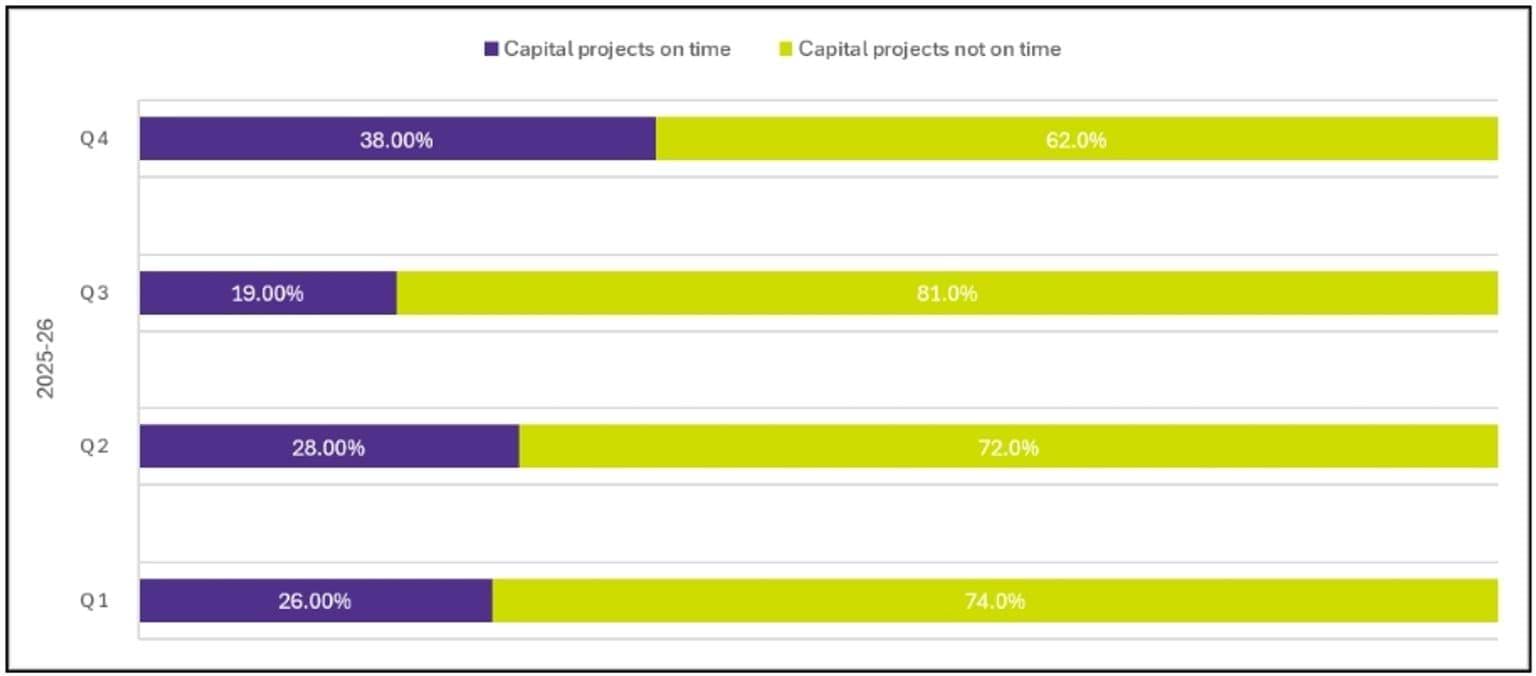
FRV: Percentage of FRV capital projects on time
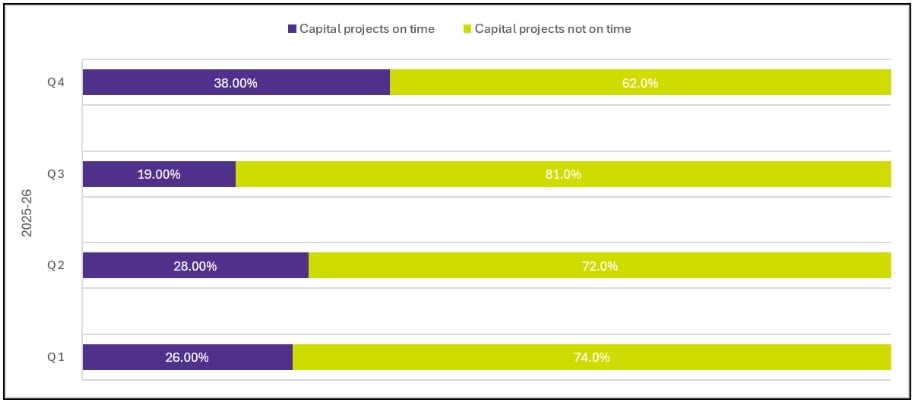
FRV’s result of 38% for capital projects on time is the highest for 2025-26 and a significant increase on the Q3 result of 19%. FRV notes the increase can be attributed to a more accurate assessment of project status following additional review and commentary from project stakeholders since the Capital Program Evaluation in Q3. Several projects that were previously reported as delayed were subsequently identified as either progressing as planned, on hold, closed, or affected by reporting limitations associated with industrial action.
While FRV’s objective is to deliver all capital projects on time, the outcome of 80% of projects delivered in accordance with their approved schedules is considered by FRV as realistic.
Figure 3: Percentage of FRV capital projects on time
FRV: Number of community members attending fire education program sessions delivered by FRV
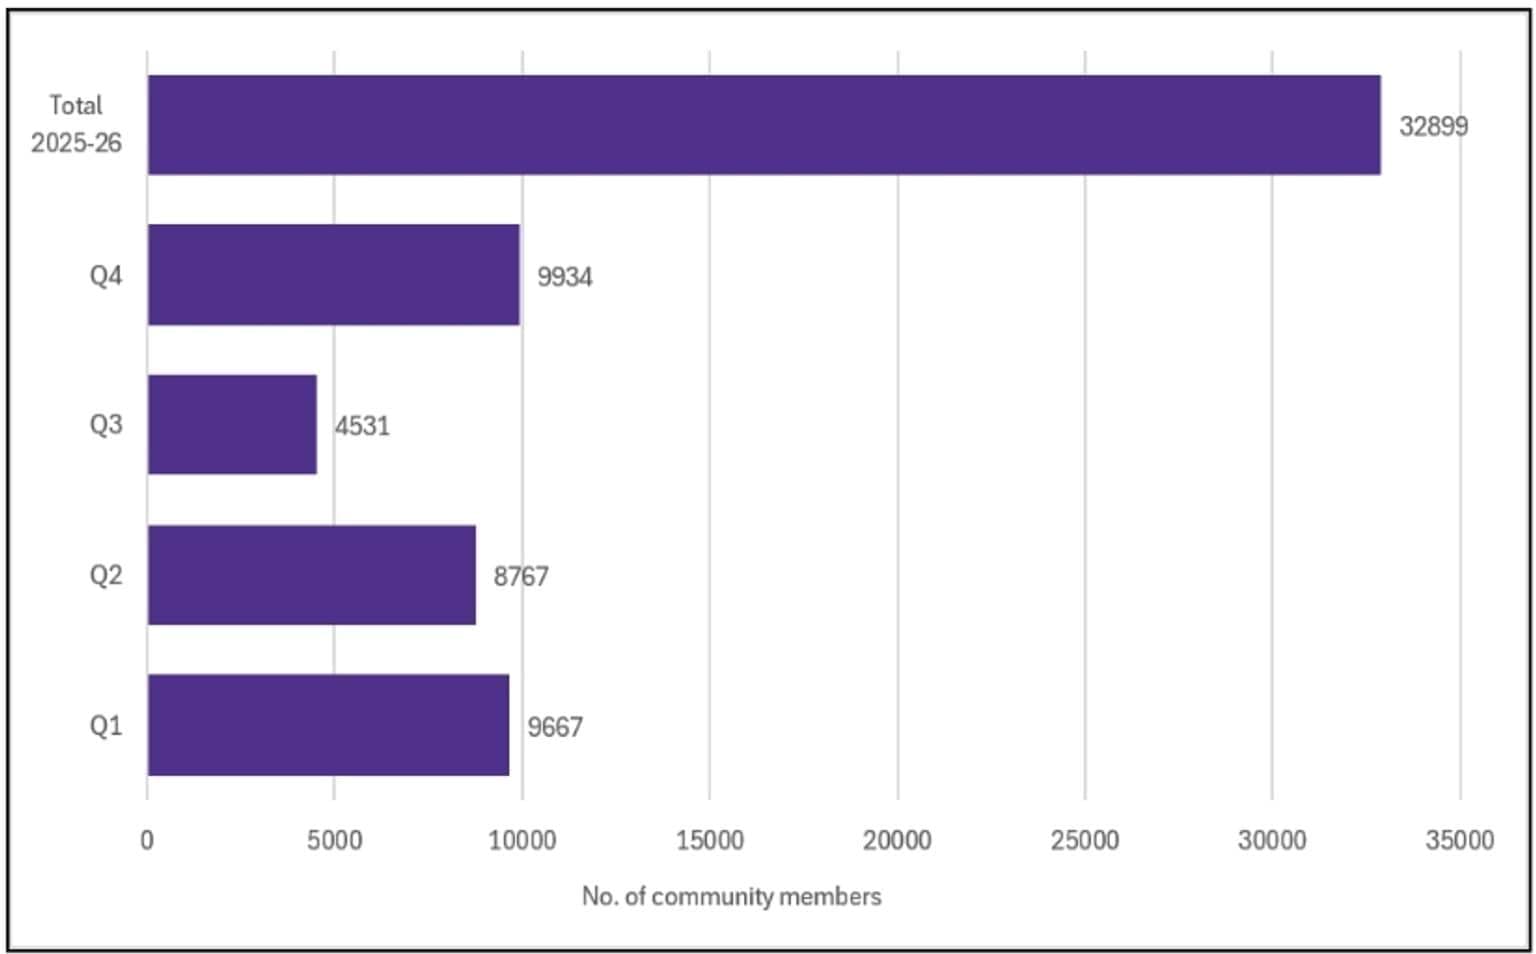
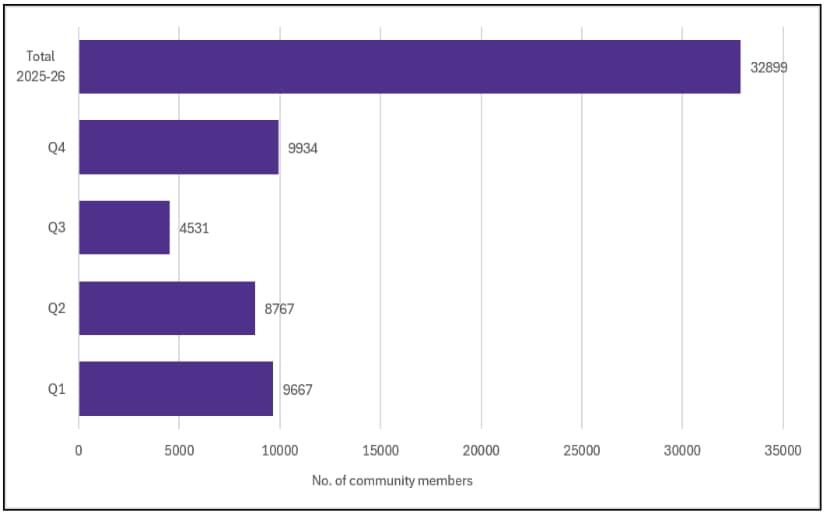
FRV reported that 9,934 community members attended fire education program sessions during Q4. The largest component of FRV’s fire education program is the Fire Ed school program, which is mostly delivered during terms 2 & 3. FRV advised this is why participant numbers in fire education programs are typically higher in Q4 and Q1. The FSIM commends FRV on achieving this result.
The programs that comprise this measure include:
- Fire Ed – age-appropriate fire safety messaging for primary and special development schools
- Senior Fire Safety – delivered to seniors’ groups by retired firefighters
- Fire lighting Consequence Awareness Program (FireCAP) – behaviour change program for young people involved in fire lighting.
- Fit 2 Drive – FRV deliver a case study session to year 11 students about smart choices as a driver and passenger.
Figure 4: Number of community members attending fire education program sessions delivered by FRV
FRV: Percentage of command personnel who undertake annual command skills maintenance scenario training
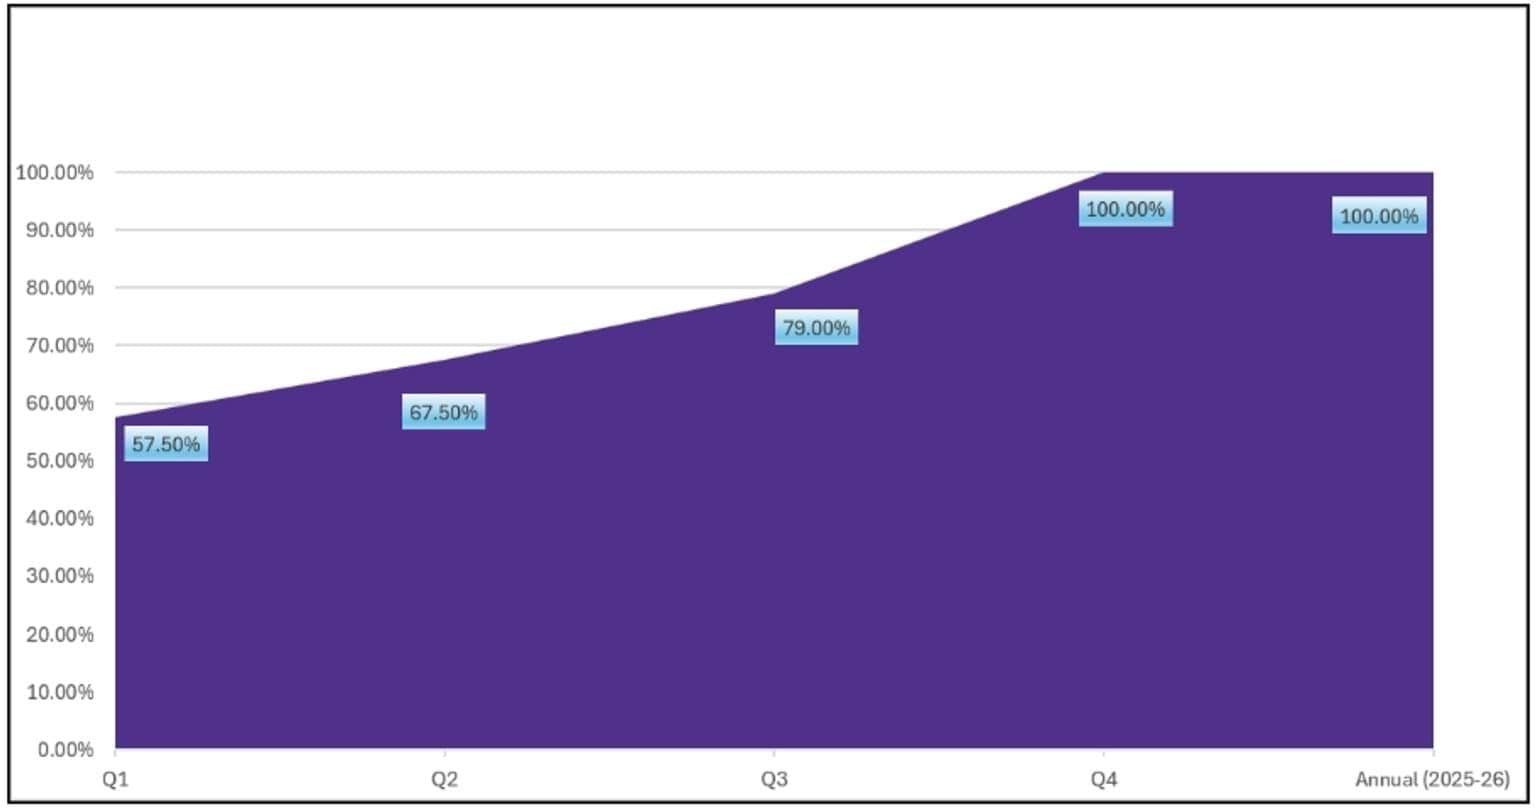
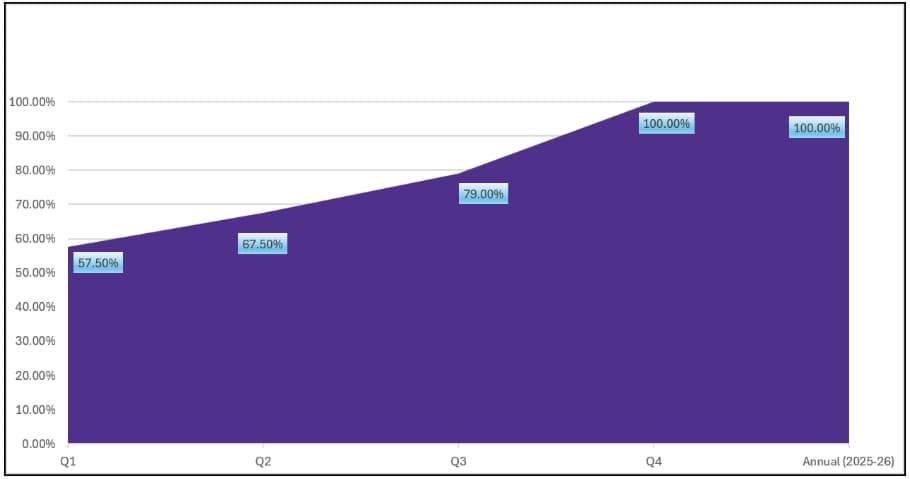
FRV reported that 33 Commanders and ACFOs undertook the annual command skills maintenance scenario training during this reporting period, resulting in 100% of ACFOs and Commanders completing this training for the 2025-26 financial year.
FRV advised that the Incident Command Simulation Program involves immersive, scenario-based training, where the pressures and complexities of real-world incidents are created. Participants focus on incident development, consequence management, resource allocation, decision-making, command and control and recovery operations.
Figure 5: Percentage of command personnel who undertake annual command skills maintenance scenario training
2.2 Continuing off-track trend over repeated quarters
CFA: A decrease in workplace injuries (volunteer operational activity)
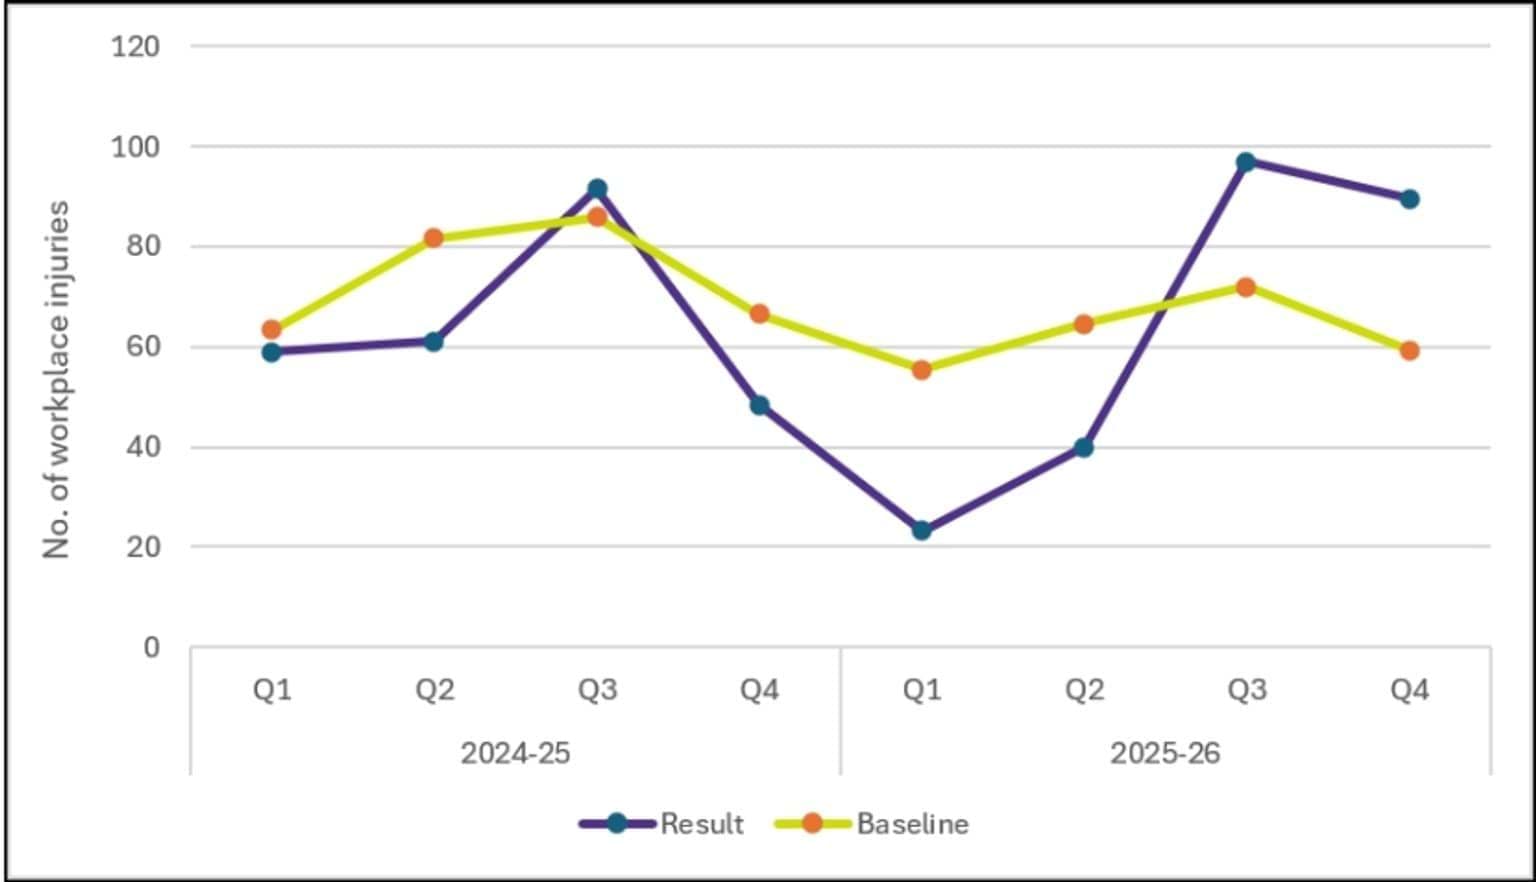
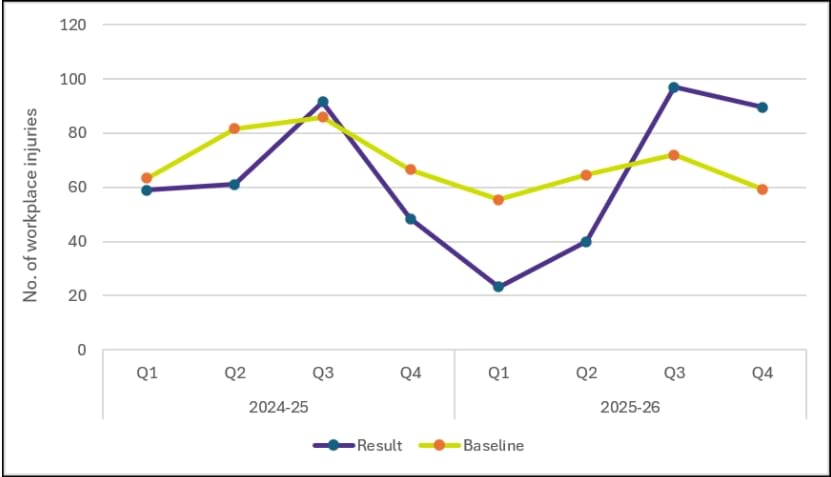
CFA reported a result of 89.6 in the rate at which workplace injuries (volunteer operational activity) became more frequent during Q4. While the result for this reporting period is lower than the Q3 result of 96.9, the off-track trend of this indicator for 2025-26 has involved a climb in the frequency rate since Q1. The FSIM also notes that the result for Q4 2025-26 is significantly higher than Q4 2024-25 of 48.3. CFA advised this difference may be due to increased operational activity during the significant fire season.
Figure 6: A decrease in workplace injuries (volunteer operational activity)
FRV: Percentage of response to structure fire incidents within 7.7 minutes (target 90%)
FRV’s result for this measure in Q4 2025–26 represents the 23rd consecutive quarter where the benchmark target of 90% has not been met. Q1 2020–21 was the last quarter this benchmark was achieved (indicated in data callout in Figure 7). The Q4 2025–26 result of 87.1% was a 0.3% increase on the Q3 2025–26 result of 86.8%.
FRV advised during the previous reporting period that it was investigating initiatives to enhance response times, noting response time performance is dependent on a range of factors. The FSIM understands FRV is continuing with this analysis and has thus far concluded capital investment is needed to implement some identified initiatives, including changes to station layouts, increased appliance availability across the existing network and/or expanding the network through new stations.
Figure 7: Percentage of response to structure fire incidents within 7.7 minutes
2.3 Significant change from the baseline or previous comparable quarter (undesirable outcome)
CFA: Increase in the number of joint FRV/CFA training and exercises
CFA reported 110 joint training and exercising activities were undertaken with FRV across 2025-26, which was 45 fewer activities than 2024-25. CFA advised that the decline for this annual indicator may be partly attributed to heavier operational demands and an extended fire season, which reduced time available for joint training and exercises.
Figure 8: Increase in the number of joint FRV/CFA training and exercises
CFA: Increase in delivery of operational training to CFA volunteers
CFA reported a result of 5,171 for the number of certificates issued for operational training to CFA volunteers. This represents a significant increase on Q3 results of 3012, and Q4 2024-25, which was 3,199. CFA advised this result was partly due to the completion of many training activities that were delayed during previous reporting periods because of the significant fire season Victoria recently experienced.
The growth in certificate issuance demonstrates the commendable role of volunteer instructors in delivery operational training and transfer of knowledge.
Figure 9: Increase in delivery of operational training to CFA volunteers
3. Reader guide
Definitions
| Acronym | Title |
|---|---|
| CFA | Country Fire Authority |
| FRV | Fire Rescue Victoria |
| FSIM | Fire Services Implementation Monitor |
4. Appendix A: CFA’s Q4 2025–26 outcomes progress report (quarterly indicators)
This is CFA’s outcomes progress report for Q4 2025–26. This progress report includes results against CFA’s quarterly outcome indicators.
5. Appendix B: CFA’s Q4 2025–26 outcomes progress report (annual indicators)
This is CFA’s outcomes progress report for Q4 2025–26. This progress report includes results against CFA’s annual outcome indicators.
6. Appendix C: FRV’s Q4 2025–26 outcomes progress report
FRV outcomes framework
This is FRV’s outcomes progress report for Q4 2025–26. This progress report includes results against FRV’s quarterly outcome measures.