Appendix D: Detailed data overview

The charts below provide the detail of all responses in the data collection tool to the data domains presented in Chapter 5. This includes the total number of blank responses.

Chart C1: Case management

Chart provides the detail of all responses in the data collection tool to the data domains presented in Chapter 5 Chart provides the detail of all responses in the data collection tool to the data domains presented in Chapter 5

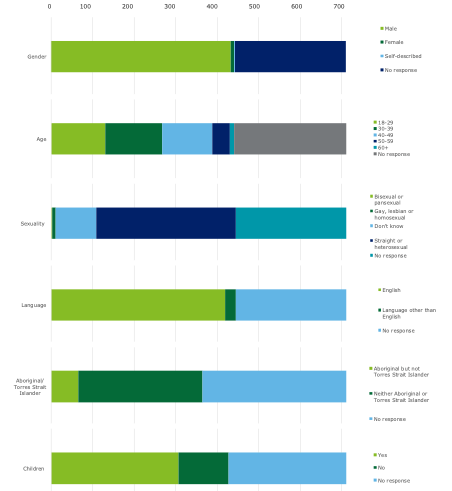
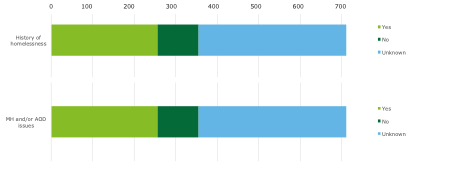
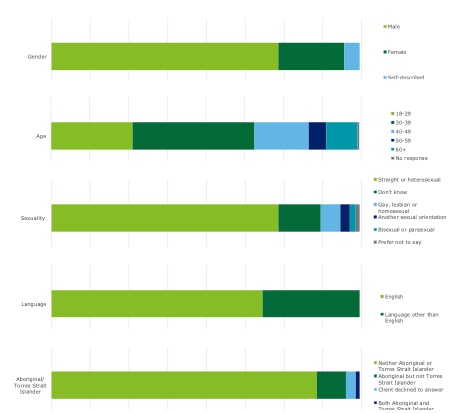
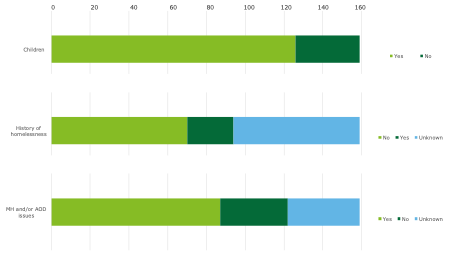
Chart C2: Cohort trials

Char provide the detail of all responses in the data collection tool to the data domains presented in Chapter 5 Chart provide the detail of all responses in the data collection tool to the data domains presented in Chapter 5

Updated