
- Published by:
- Department of Energy, Environment and Climate Action
- Date:
- 30 June 2026
Introduction
Bushfires are a natural part of the Victorian environment and managing bushfire risk is everyone’s responsibility. Victoria is one of the most bushfire-prone areas in the world.
Welcome to Victoria’s Bushfire Management Report Card 2024–25 (the Report Card). Delivered by the Office of Bushfire Risk Management (OBRM) in conjunction with bushfire management sector partner agencies, the Report Card replaces the previous Victoria’s Bushfire Risk Management Report.
Bushfires are a natural part of the Victorian environment and managing bushfire risk is everyone’s responsibility. Victoria is one of the most bushfire-prone areas in the world. The last 2 decades have seen a dramatic increase in the number, size, extent, and severity of bushfires. The Victorian Government recognises that bushfire risk cannot be eliminated. It also acknowledges the significant threat that climate change poses to communities, the economy and the environment through more frequent and severe bushfire emergencies.
Following the 2019-20 bushfires, the Victorian Government established OBRM within the Department of Energy, Environment and Climate Action (DEECA). OBRM oversees the development and implementation of an end-to-end framework for evidence-based bushfire risk management (including policy, practice, assurance, and reporting) across all public and private land, with a primary focus on fuel management. OBRM is supported by an advisory panel and works in partnership with Victorian Government agencies, local government, landholders and communities to reduce the likelihood and impact of bushfires.
To learn more about OBRM’s role, see the Office of the Bushfire Risk Management website.
About this report
Victoria's Bushfire Management Strategy (the Strategy) is a joint commitment on the direction of bushfire management in Victoria. It brings together the work we are already doing, with the work we plan to do over the next 10 years to manage bushfire on public and private land.
Supporting the Strategy is Victoria’s Bushfire Monitoring, Evaluation and Reporting Framework (the Framework), which helps us to keep track of our progress towards achieving the outcomes of the Strategy, and to identify further opportunities for continuous improvement.
The Framework sets out the two types of reporting that will occur through the life of the Strategy:
- annual progress reporting (intermediate outcome tracking)
- periodic evaluation reporting.
The Report Card is the primary annual progress reporting product. This provides a structured, sector‑wide assessment of progress against the Strategy’s intermediate outcomes. It is part two of a new two-part annual reporting approach to track progress against the Strategy. Victoria’s Bushfire Management Snapshot – December 2025, provides a high-level overview of key bushfire preparedness and mitigation information.
The Report Card provides detailed information on bushfire management delivery and outcomes across public and private land in Victoria for the 2024–25 financial year.
The Report Card is primarily based on previously available information, largely focused on fuel management, reflecting the current availability of data across the breadth of bushfire management activities. As the sector matures in delivering the Strategy over time, it will expand to more fully represent the full range of Strategy outcomes and actions.
Report structure
The Report Card is set out according to the 5 of the 7 domains of the Strategy:
- People and community safety
- Aboriginal self-determination in cultural fire and bushfire management
- Ecosystem resilience and nature conservation
- Working together, accountability and shared responsibility
- Enhanced capability and capacity
Further work is underway to broaden the Sector’s monitoring, evaluation and reporting capabilities in relation to:
- Informed decision-making, evidence-based approaches and tools
- Critical infrastructure and economic resilience
How to read this report
Results for the 2024–25 measures are shown in tables alongside results from the previous two financial years (2022–23 and 2023–24) and performance targets (where applicable). Tables also indicate whether 2024–25 measures have achieved performance targets using the following visual key:
Table A: Interpreting results
| Icon | What this indicates |
|---|---|
✓ | Performance target achieved or exceeded |
◯ | Performance target not achieved – within 5 per cent variance. |
⬛ | Performance target not achieved – exceeds 5 per cent variance |
Variance is the difference between target performance and actual performance, proportionate to the performance target.
Bushfire risk
In Victoria vegetation, climate and dispersed communities means there will always be a need to live with the risk of bushfires. It is necessary to understand what creates bushfire risk, where it exists in the landscape, and what the government, communities and individuals can do to reduce the likelihood and impact of bushfires.
Bushfire risk refers to the likelihood and consequence of bushfire impact. It includes the likelihood of a bushfire starting, growing and spreading across a landscape. It also includes the likelihood of something being in the fire path such as people, houses, farms, critical infrastructure, and wildlife habitat. Victoria is particularly susceptible to large and intense bushfires that can spread rapidly across vast distances, due to the state’s naturally flammable vegetation and frequent exposure to hot, dry and windy weather. Bushfire risk is affected by factors that may influence the speed and intensity of fire, including the:
- short-term weather conditions including rainfall, temperature and wind
- long-term weather trends, or climate
- topography of the landscape
- availability of fuel, driven by the amount, type and dryness of vegetation
- location of people and assets
- prevention and suppression capabilities.
Because of this, bushfire management is not limited to fuel management. Climate trends reveal a marked increase in dangerous fire-weather conditions, where there is a decreased influence of fuel on fire behaviour. For this reason, it is important to manage bushfire risk using a wide range of interventions.
How is bushfire risk managed?
Victoria takes a risk-based approach to bushfire management, meaning that resources are invested in bushfire management activities where they will have the greatest impact in protecting human life, property and the environment. This approach has been repeatedly reviewed by experts and inquiries, and consistently found to be leading practice both nationally and internationally. However, a level of risk will always remain.
Victoria’s approach to bushfire risk management is underpinned by shared responsibility. Bushfire risk management requires cooperation and coordination across government and with communities. Various government departments and agencies have roles and responsibilities in relation to bushfire risk management, including fire agencies (Forest Fire Management Victoria, the Country Fire Authority and Fire Rescue Victoria), Local Councils and the Department of Transport and Planning. Bushfire risk management also involves close collaboration with Victorian communities, including supporting private landowners to manage bushfire risk on their own properties.
Bushfire risk is managed through a variety of activities including:
- Engaging with the community to support placed-based programs that reduce bushfire risk
- Fuel management (including planned burning and non-burn fuel treatment)
- Construction and maintenance of fuel breaks and fire access roads
- Land use planning and building controls
- Fire restrictions and total fire ban days
- Neighbourhood Safer Places–Bushfire Place of Last Resort and community fire refuges
- Arson enforcement and community education
- Powerline safety
- Early detection and aggressive first attack to bring bushfires rapidly under control while they are still small.
The Victorian Government is also working with Traditional Owners to support self-determination in relation to land and fire management. This includes supporting Traditional Owners to implement the Traditional Owner Cultural Fire Strategy and lead the reintroduction of cultural fire on Country.
People and community safety
Communities are more resilient to the impacts of bushfires and bushfire management activities.
Protecting and preserving life is the sector’s highest priority. Community-centred approaches, where the sector builds local bushfire management capacity through community consultation, reduces the impact of fire on communities. These approaches are informed by behavioural and social science, and fuel management strategies that positively influence behaviour change and build social capital in communities and across the sector.
Empowering communities with an understanding of bushfire risk and the tools to take action to minimise those risks leads to reduced impacts and faster recovery.
Intermediate Outcome 1.1
People and communities are empowered to contribute to bushfire management, including mitigation, planning, preparedness, response and recovery in their local area and on their land.
How to read table symbols
| Icon | What this indicates |
|---|---|
✓ | Performance target achieved or exceeded |
◯ | Performance target not achieved – within 5 per cent variance. |
⬛ | Performance target not achieved – exceeds 5 per cent variance |
Community-based participation in bushfire management planning and activities
Table 1: Performance results of community engagement activities by FFMVic and CFA, Victoria, 2022-23 to 2024-25
Indicator: Increased community-based participation in bushfire management planning and activities (1.1.1) | Target | 2022-23 | 2023-24 | 2024-25 | 2024-25 result |
|---|---|---|---|---|---|
| Number of stakeholder and community forums on bushfire management and planned burning held (FFMVic) | 12 | 13 | 14 | 2 | ⬛ |
| Number of CFA Property Advice Visit Service assessments |
| 3,631 | 2,899 | 1,135 |
|
| Number of community events and informal engagement by CFA (including station Open Days) |
| 2,179 | 1,925 | 1,945 |
|
Table 2: Community understanding of bushfire risk, Victoria, 2022-23 to 2024-25
Indicator: Increased community understanding of bushfire risk and appropriate actions to reduce or avoid risk (1.1.2) | Target | 2022-23 | 2023-24 | 2024-25 | 2024-25 result | Explore data |
|---|---|---|---|---|---|---|
| Number of online CFA modules completed (including Bushfire Safety for Workers) |
| 3,630 | 8,255 | 5,026 |
| |
| Percentage (%) of CFA annual post-season survey respondents that consider the risk of bushfire to their home or property as extreme or majora |
| 44.4% | 21.0% | 27.0% |
|
|
Note(a): Survey applied to postcodes identified as being areas of extreme or very high fire risk. Indicator 1.2.3 from CFA Outcomes Framework.
Preventing human-induced ignitions
Preventing human-induced ignitions, especially on days of dangerous fire-weather conditions involves a range of prevention measures across agencies including:
- Providing clear information about campfire regulations and campfire safety
- Declaring and enforcing Total Fire Ban Days, Fire Danger Periods and the seasonal Prohibited Period
- Undertaking campfire compliance controls to prevent ignitions
- Closing forests and parks when conditions would make them dangerous to enter
- Undertaking an intelligence-led, partnership approach to preventing the incidence of bushfire arson
- Ensuring that electricity network distribution assets maintain bushfire safety standards.
Table 3: Human-induced ignitions and prevention, FFMVic, CFA and AER, Victoria, 2022-23 to 2024-25
Indicator: Human-induced ignitions reduced (1.1.3) | 2022-23 | 2023-24 | 2024-25 | Explore data |
|---|---|---|---|---|
| Number of fire starts from electricity distribution network assetsa (Victorian Government F-factor scheme) | 429 | 547 | 652 |
|
| Number of Total Fire Ban Days declared (CFA) | 4 | 11 | 14 | |
| Number of unattended campfires attended by FFMVic – statewide | 444 | 581 | 425 | |
Additional information: Victoria’s Conservation Regulator received reports of 587 fire-related offences in the public land component of the fire protected area during the 2024-25 reporting period. Fire related offences include unattended campfires, fires within the fire danger period, fires on total fire ban days and fires in fire protected areas. For more information about regulatory activities undertaken by the Conservation Regulator, see Year in Review 2024–2025, Conservation Regulator | ||||
Note(a): Data on fire starts from electricity distribution network assets have been derived from the Australian Energy Regulator’s Victorian electricity distributors' fire start reports.
Mitigating bushfire risk
Intermediate Outcome 1.3
The impact of fire on community values (including human life, social values, economy, infrastructure, agricultural values, cultural and heritage values) is reduced
Victoria’s bushfire management sector takes a year-round approach to reducing bushfire risk. Sector partners undertake a broad range of mitigation activities to reduce the incidence and severity of bushfires, minimise their effects and improve the resilience of communities and ecosystems.
- plan and deliver planned burns and non-burn fuel treatments
- conduct ecological burning, threatened species and biodiversity programs to increase the resilience of species and ecosystems to future disturbances
- construct and maintain fuel breaks, fire access roads and maintain roadside vegetation
- undertake other bushfire risk-reduction activities, such as using predictive weather and fire behaviour advice to strategically position air and ground resources on days when bushfire risk is increased
- conduct research to improve risk reduction approaches.
Fuel-driven bushfire risk
Fuel-driven bushfire risk is the component of bushfire risk that is attributable to the amount, type and dryness of vegetation (bushfire fuel). Fuel is a key element of fire behaviour and therefore is a major component of overall bushfire risk. However, it is not a full measure of bushfire risk. Fuel is not the only factor that affects fire behaviour, or the likelihood and consequence of bushfires impacting people and the things they care about.
The primary determinants of fire behaviour are topography, weather and fuel. The sector models the impact that planned burning and bushfires have on reducing fuel-driven bushfire risk to human life and property by modelling fire behaviour as a function of:
- topography as represented by a digital elevation model of Victoria,
- weather as represented by a catastrophic fire weather scenario, and
- fuel as represented by the varying fuel load across Victoria from year-to-year.
This impact is calculated and expressed as the percentage of modelled fuel-driven bushfire risk ‘left over’ after fuels have been reduced, either through planned burning or bushfires. A current constraint is that this calculation can only consider the contribution of planned burning and does not consider non-burn fuel treatments such as slashing and mowing.
DEECA's fuel management program is guided by a risk reduction target to keep modelled fuel-driven bushfire risk at or below 70% of its maximum modelled fuel-driven bushfire risk. DEECA responds to this target by delivering fuel management in State forests, national parks and protected public land.
The level of modelled fuel-driven bushfire risk is different across the landscape, due to variations in vegetation, topography and where houses are located. Each FFMVic region and district have long-term planning targets for reducing fuel-driven bushfire risk, which contribute to achievement of the statewide fuel-driven bushfire risk target. Regional and district modelled fuel-driven bushfire risk targets vary across the State. They are influenced by both the level of risk in an area (influenced by vegetation, topography and the location of houses) as well as the leverage that FFMVic has over reducing risk through fuel management on public land.
Figure 1 depicts the state and regional modelled fuel-driven bushfire risk in Victoria for 2024-25, including the targets. DEECA district modelled fuel-driven risk information is available in the Appendix.
Figure 1: 2024-25 state and regional modelled fuel-driven bushfire risk, Victoria
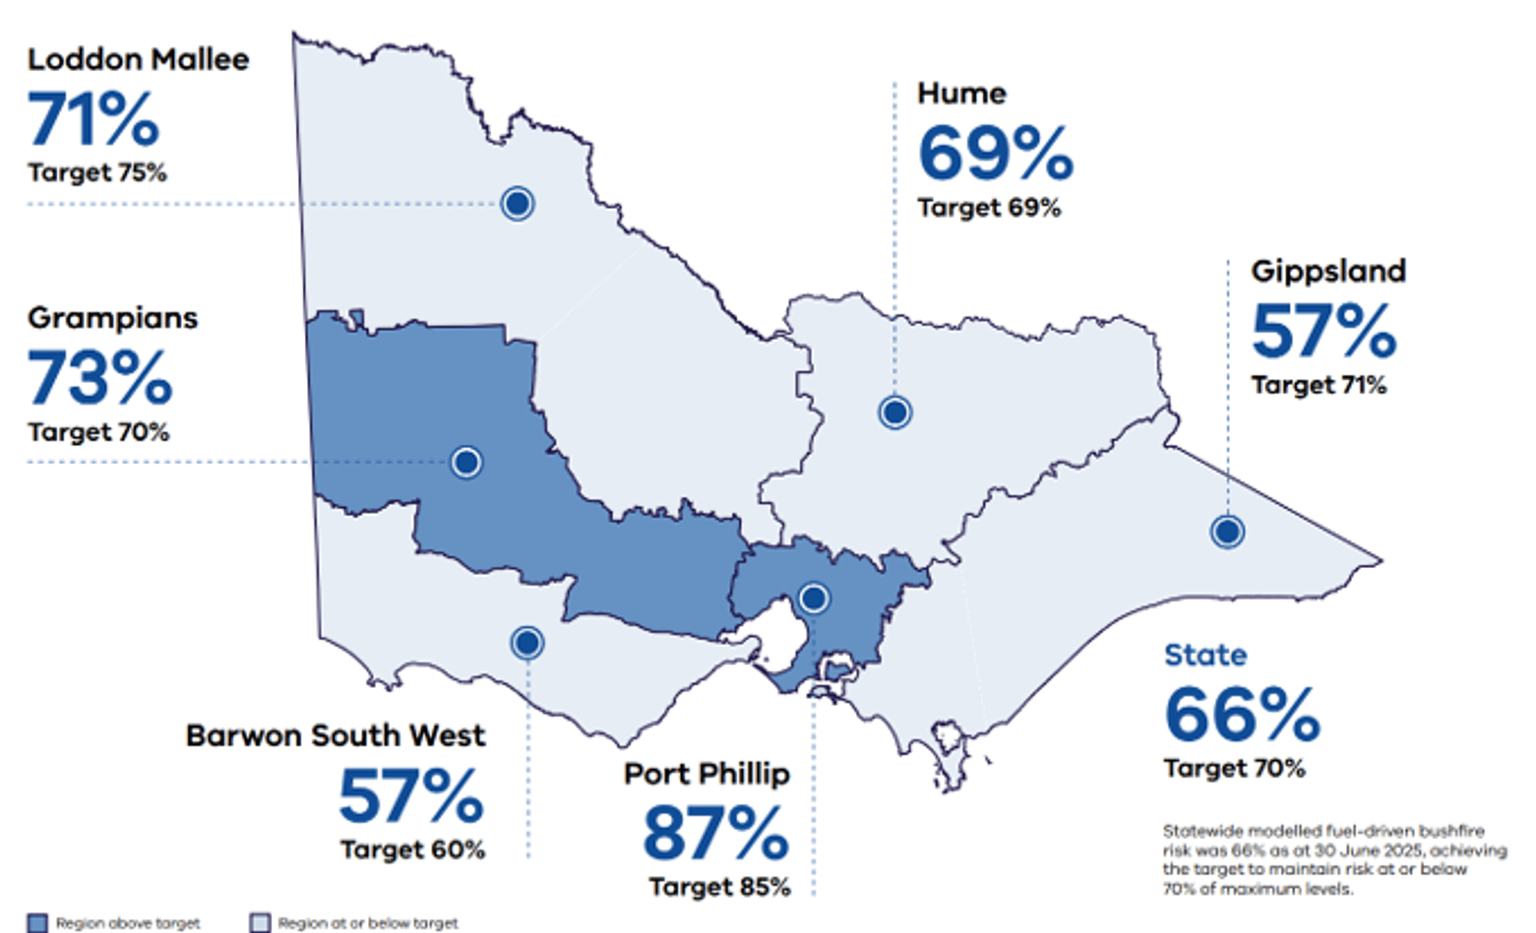
Table 4: Modelled fuel-driven bushfire risk, statewide and regions, 2022-23 to 2024-25.
Indicator: Risk to life and property is reduced (1.2.1) | Target | 2022-23 | 2023-24 | 2024-25 | 2024-25 result |
|---|---|---|---|---|---|
| Modelled fuel-driven bushfire risk (%) – Statewide | 70% | 65% | 64% | 66% | ✓ |
| Barwon South West Region | 60% | 61% | 57% | 57% | ✓ |
| Gippsland Region | 71% | 46% | 49% | 57% | ✓ |
| Grampians Region | 70% | 76% | 75% | 73% | ◯ |
| Hume Region | 69% | 71% | 70% | 69% | ✓ |
| Loddon Mallee Region | 75% | 74% | 72% | 71% | ✓ |
| Port Phillip Region | 85% | 89% | 87% | 87% | ◯ |
See Appendix to explore regional data further.
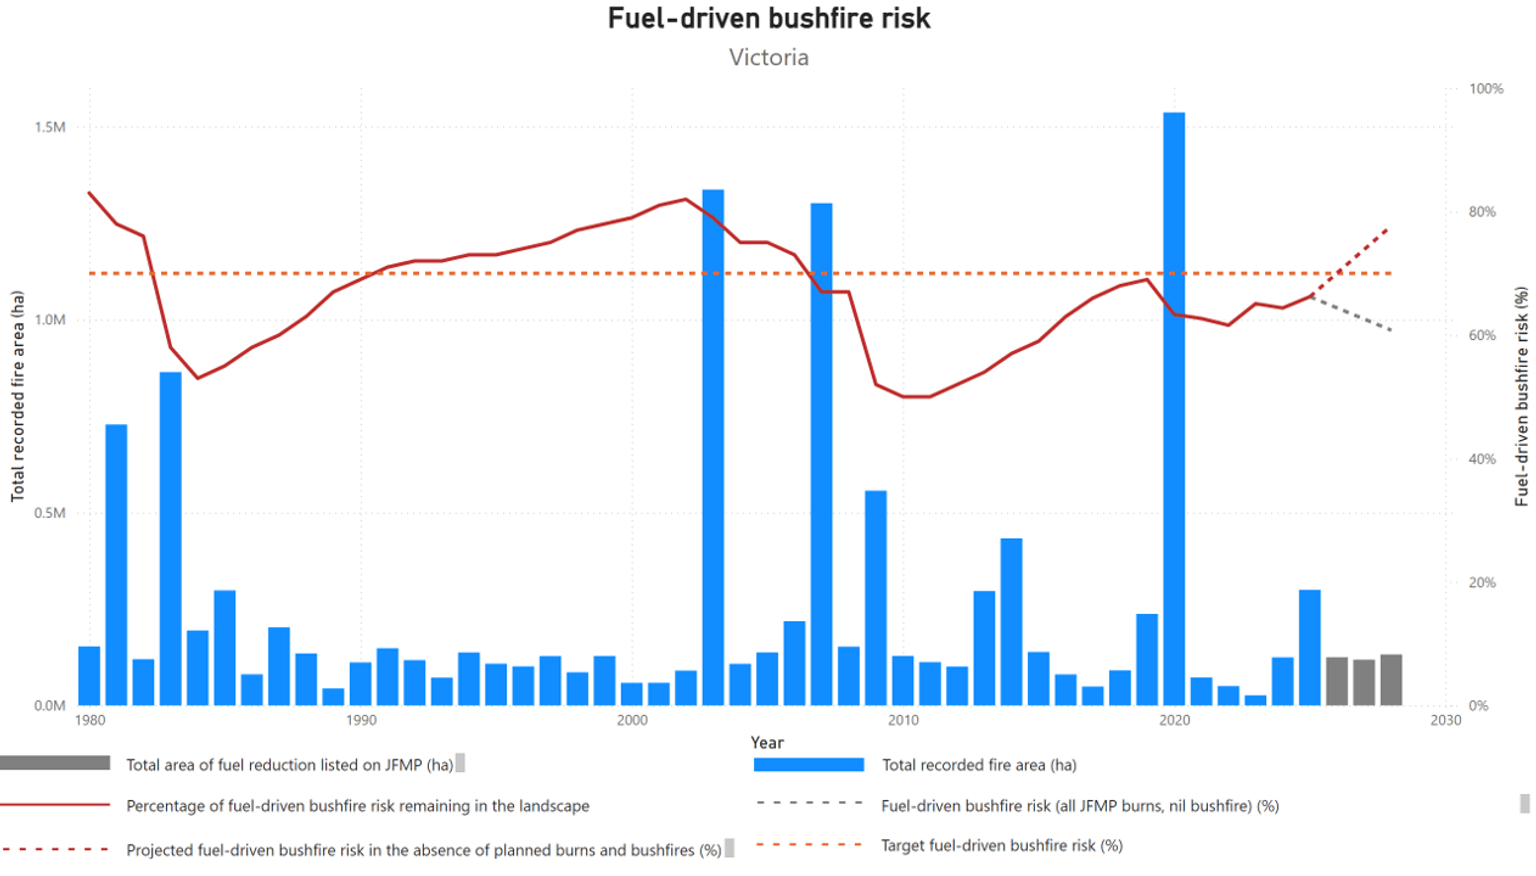
Figure 2: Victoria’s fuel-driven bushfire risk from 1980-2025
Joint Fuel Management Program
The Joint Fuel Management Program (JFMP) is a statewide operational planning process for the management of bushfire fuels on public and private land over a 3-year rolling timeframe. Each year the JFMP includes more fuel management operations planned than are operationally feasible, providing flexibility to adapt the program to seasonal conditions. JFMP integrates a risk-based bushfire management approach that the sector works within and shares personnel, resources, vehicles, and other equipment to maximise the prioritisation and delivery of fuel management activities.
FFMVic and CFA staff developed JFMP in consultation with local councils, the viticulture and tourism industries, apiarists and flora and fauna specialists. Drawing on knowledge from local communities including Traditional Owners, key stakeholders, local community leaders and other interested parties. FFMVic and the CFA welcome and encourage public involvement around the timing and scheduling of activities in local areas. Burns are nominated for a variety of reasons including:
- reducing bushfire risk
- enhancing ecological resilience
- regeneration
- supporting Traditional Owners to reintroduce cultural fire to Country.
Table 5: FFMVic preparations for JFMP burns delivery, 2022-23 to 2024-25
Indicator: Risk to life and property is reduced (1.2.1) | 2024-25 Target | 2022-23 | 2023-24 | 2024-25 | 2024-25 result |
|---|---|---|---|---|---|
| 100 per cent of burns identified in the current year of the Joint Fuel Management Program ready for on ground delivery (FFMVic) | Feb 2025 | Sept 2022 | April 2024 | May 2025 | ⬛ |
Note: FY 2024/25 performance is below target due to changes in seasonal conditions that required adjustments to the program, to allow for parallel burning and preparation through to May each year.
Fuel management makes bushfire suppression easier and safer for firefighters and helps to reduce the impact of bushfires on communities and the environment. It includes:
- Planned burning for risk reduction – lighting and managing planned fires in the landscape, including along roadsides and rail corridors
- Ecological burns – burns where the primary objective is to improve the health of our ecosystems and reduce the intensity and potential destructive impacts of bushfires on our native flora and fauna
- mechanical treatments – mowing, slashing and mulching
- other non-burn treatments like spraying for weed management
- construction and maintenance of the strategic fuel breaks
- removal or management of storm debris.
Table 6: Area treated with fuel management by FFMVic and CFA, Victoria, 2022-23 to 2024-25
Indicator: Risk to life and property is reduced (1.2.1)
| 2022-23 | 2023-24 | 2024-25 | ||||
No. treatments | Area (ha) | No. treatments | Area (ha) | No. treatments | Area (ha) | Explore data | |
| Total fuel management (CFA) | 180 | 3,358 | 287 | 6,231 | 241 | 4,757 |
|
| Total fuel management (FFMVic) | 1,816 | 92,257 | 1,926 | 138,454 | 1,221 | 109,938 | FFMVic: Bushfire Risk Mitigation Update 2024–25 |
| Planned burning | 214 | 75,500 | 316 | 122,291 | 270 | 92,473 |
|
| Non-burn fuel treatments | 1,602 | 16,757 | 1,610 | 16,163 | 951 | 17,465 |
|
| Total fuel management (CFA and FFMVic) | 1,996 | 95,615 | 2,213 | 144,685 | 1,462 | 114,695 |
|
Note: Fuel management figures do not include cultural burns delivered.
Under the Forests Act 1958, DEECA is responsible for the planned prevention of fire in State forests, National Parks and other protected public land in Victoria. It does this through FFMVic, which is led by DEECA and draws on partnership arrangements with Parks Victoria and Melbourne Water.
Other fuel management related actions taken to mitigate bushfire include mechanical (non-burn) fuel treatments to maintain the network of existing fuel breaks. They also treat small, discrete, or complex areas that are difficult to burn safely (such as in steep gullies). These mechanical treatments may complement a planned burn where the geography (i.e., community, vegetation or terrain) is complex, and planned burning opportunities are very limited. The mechanical fuel treatment program has remained steady in recent years, averaging just over 17,000 ha treated in the 6 years since 2019-20.
Table 7: Total area (ha) treated with fuel management by FFMVic, Victoria, 2022-23 to 2024-25
Indicator: Risk to life and property is reduced. (1.2.1) | Target | 2022-23 | 2023-24 | 2024-25 |
|---|---|---|---|---|
| Total area (ha) treated with fuel management |
| 92,257 | 138,454 | 109,938 |
| Area (ha) treated by planned burning |
| 75,500 | 122,291 | 92,473 |
| Ecological burns |
| 11,802 | 3,864 | 4,373 |
| Risk reduction burns |
| 63,628 | 118,386 | 88,090 |
| Windrow / heap |
| 70 | 41 | 10 |
| Area (ha) treated by non-burn fuel treatments |
| 16,757 | 16,163 | 17,465 |
| Mechanical mulching |
| 2,469 | 3,475 | 3,939 |
| Mechanical slashing or mowing |
| 10,461a | 9,221 | 10,498 |
| Other methods |
| 3,827a | 3,467 | 3,028 |
Note(a): Number corrected from Victoria’s Bushfire Risk Management Report 2022-23.
FFMVic Fuel Management Overview 2024-25
FFMVic delivered fuel management treatments across 109,938 ha of public land in Victoria in 2024-25. This included 270 planned burns covering 92,473 ha and non-burn fuel treatments covering 17,465 ha.
The 92,473 ha treated by planned burning is consistent with the average planned burn delivery since DEECA moved to a risk-based approach in 2016-17 (the average area treated in the 8-year period 2016-17 to 2023-24 is 92,528 ha).
The 2024-25 financial year saw a strong underlying dryness across much of the state influencing both bushfire activity and fuel management delivery. Significant bushfire response operations diverted resources to emergency management from all parts of the state to support western regions for long periods over summer and autumn. This meant some delays to both burn planning and on-ground preparation of burns prior to the peak autumn delivery period across all regions.
Planned burning in 2025 commenced with several burns across Gippsland in the last few days of February 2025. Then the eastern districts of Snowy, Tambo and Macalister each igniting multiple burns in the first week of March, while other parts of the state remained dry and were waiting for their first rains before burn programs could commence.
Significant rain across central and eastern areas of the state in mid-March meant the burn program quickly stopped. Following this rain, opportunities for the burn program to commence more broadly were emerging. 36 burns were ignited between 23 and 31 March across most regions of the state, with another 32 burns ignited in the following week, as conditions remained favourable across the Hume region. Conditions were less favourable south of the divide in early April, with Gippsland being too damp after successive rainfall events through March.
Underlying soil dryness (except in Gippsland) remained through all of autumn across central and western areas. This had operational impacts, including delays in safely igniting burns, extended patrol requirements before burns could be declared safe, and reduced availability of resources to commence new burns. Instead, crews remained committed to patrolling existing burns to ensure they stayed within control lines. In some instances, patrols were required well beyond a week after the initial ignition.
Underlying dryness (except in Gippsland) also reduced the length of burn windows following rain events, as the dry soil quickly absorbed moisture, drying out fuels quicker than in recent years. However, the drier conditions did mean good burning opportunities continued later into autumn. A Treasurer’s Advance enabled additional planned burning to be delivered through late-April to mid-May, with contract extensions of fixed term Seasonal Forest and Fire Operations Officers and Fire Support Officers providing additional capacity later than normally available for planned burn delivery. Planned burning activity slowed quickly as conditions transitioned from too dry to too wet, and day lengths shortened by late May with high humidity preventing ongoing burn opportunities through June.
Overall, Year 1 of the JFMP did provide flexibility through a broad variety of burns totalling 195,103 ha identified for potential delivery. This enabled FFMVic to deliver an average sized planned burn program of 92,473 ha in the context of a significant bushfire season and underlying dryness through central and western areas in autumn, noting the wet conditions in Gippsland. Planned burns delivered represent 47% of the area identified in Year 1 of the 2024-25 JFMP.
Relative contribution to risk reduction made by planned burning and bushfires
Modelling can be used to determine the relative contribution of planned burning and bushfires to risk reduction realised through the reduction of bushfire fuels. Presenting the contribution to risk reduction from planned burns and previous bushfires as a 10-year rolling average is a more meaningful and accurate way to view this data compared to doing it as a year-to-year contribution. The reason for this is the significant year-to-year variability in risk reduction contribution. For example, in years with very large bushfires, such as the 2019-20 fire season, the majority of risk reduction would be attributable to bushfires, whilst in years with minimal bushfire activity, almost 100% risk reduction is attributable to planned burning.
Although there is considerable variation from year to year, planned burning accounts for more fuel-driven bushfire risk reduction than bushfires. This is despite bushfires impacting a substantially greater area than planned burns over the last 10-year period.
Table 8: Relative contribution (%) of planned burning and bushfires to total risk reduction across Victoria, FFMVic, Victoria, 2024-25
Indicator: Risk to life and property is reduced (1.2.1) | 10-year averagea | 2024-25 |
|---|---|---|
| Planned burning | 58% | 87% |
| Bushfires | 42% | 13% |
| Total | 100% | 100% |
Note(a): 10-year average to 30 June 2024.
Table 9: Proportion (%) of total burnt area (ha) burnt by planned burning and bushfires in past 10 years (to 30 June 2024), FFMVic, Victoria, 2024-25.
Indicator: Risk to life and property is reduced (1.2.1) | Percent (%) | Area (ha) |
|---|---|---|
| Planned burning | 16% | 415,538 |
| Bushfires | 84% | 2,149,571 |
| Total | 100% | 2,565,109 |
Fuel breaks, strategic fire access roads and roadside vegetation
Fuel breaks (previously ‘strategic fuel breaks’) form part of the landscape infrastructure necessary to safeguard communities. A network of fuel breaks is a critical bushfire management tool to aid in limiting the size, spread, behaviour and impact of bushfires. They provide safe access to undertake suppression operations to respond to a bushfire. They also assist with planned fuel management activities, such as planned burning. In the context of a changing climate with increased bushfire frequency, a network of fuel breaks is an essential part of the infrastructure that safeguards environmental, social and economic wellbeing and cultural values for communities.
Victoria has over 50,000 kilometres of minor roads and tracks through state forests. Well-maintained fire access roads and bridges are another important element of the landscape infrastructure for bushfire suppression enabling personnel, vehicles and heavy equipment to safely access remote areas.
The Department of Transport and Planning (DTP), councils and FFMVic with the support of CFA manage roadside vegetation on priority routes to reduce the likelihood of fires igniting and spreading, improve the safety of firefighters responding to bushfires and communities leaving the area.
Table 10: Fuel breaks maintained and strategic fire access roads improved by FFMVic, Victoria, 2022-23 to 2024-25
Indicator: Risk to life and property is reduced (1.2.1) | Target | 2022-23 | 2023-24 | 2024-25 | 2024-25 result |
|---|---|---|---|---|---|
| Kilometres (km) of fuel breaks constructed (FFMVic) |
|
| 36.9 | 6.9 |
|
| Kilometres (km) of fuel breaks maintained (FFMVic) | 900 | 900 | 941 | 1,072 | ✓ |
| Kilometres (km) of strategic fire access roads improved (FFMVic) | 2,000 | 2,155 | 2,082 | 2,236 | ✓ |
| Number of bridges or crossings on the strategic fire access road network replaced or upgraded (FFMVic) | 10 | 10 | 10 | 10 | ✓ |
Further information: In 2022-23, the Strategic Fuel Break Program completed its initial phase of creating new strategic fuel breaks. The focus has now shifted to maintaining these breaks, which is crucial for their long-term effectiveness. FFMVic maintained more than 1,072 km of existing fuel breaks to ensure they remained fit-for-purpose and constructed an additional 6.9 km to the network. Strengthening and expanding the fuel break network is a key strategy to make it easier, faster, and safer for firefighters to suppress bushfires and complements other fuel management works. | |||||
Bushfire response
Following the ignition of a bushfire, the fuel, topography and weather in the area where the bushfire is burning will determine its size, direction and intensity. The fire agencies are responsible for the first response to bushfire according to their respective legislative and jurisdictional responsibilities, often supported by privately owned and managed resources in rural areas.
In light fuels such as grass, firefighters generally extinguish bushfires using water. Where water is scarce or where fuels are heavier, such as in a forest, firefighters generally contain bushfires within mineral earth firebreaks, created using either hand tools or heavy machinery.
Aircraft can assist in halting the intensity and spread of a fire for a temporary period, allowing ground firefighters to approach with increased safety. Predetermined dispatch of aircraft is a key measure to achieve this initial reduction in bushfire development.
Early detection of and response to bushfires is vital to restricting the spread and development of bushfires. The fire agencies detect bushfires using a range of methods including reports from the public, spotters in fire towers or detection aircraft. Enhanced levels of fire detection arrangements are activated commensurate with the forecast fire danger.
Where response is undertaken quickly to a bushfire, fires can generally be contained before they reach their maximum potential. An efficient first response will keep the area of impact of the bushfire as small as possible and will minimise the potential for bushfire to have broader consequences. On days of elevated fire danger, fire agencies adjust their readiness and response arrangements by planning for the initial response or first attack to fail and the fire to grow rapidly.
Table 11: Bushfire suppression performance by FFMVic and CFA, Victoria, 2022-23 to 2024-25
Indicator: The impact of bushfires is minimised (e.g. fire size and time to control fire) (1.2.2) | Target | 2022-23 | 2023-24 | 2024-25 | 2024-25 result | Explore Data |
|---|---|---|---|---|---|---|
| Percentage (%) of fires contained at less than 5 ha to suppress fires before they become established, minimising impact (FFMVic) | 80% | 92.4% | 91.8% | 92.4% | ✓ |
|
| Percentage (%) of total fires contained by 8am following day (FFMVic) | 80% | 97.7% | 96% | 83.1% | ✓ |
|
| Percentage (%) of vegetation fires contained to 5 ha (CFA)a | 94.7%b | 91.5% | 93.9% | 96.6% | ✓ |
|
Additional Information: Additional CFA bushfire suppression performance measures are available in the CFA Annual Report 2024-25 and in CFA Outcomes Framework reporting published via Fire Services Implementation Monitor (FSIM) progress reports. | ||||||
Note(a): Indicator 2.2.2 from CFA Outcomes Framework.
Note(b): Historical baseline applied as target.
Table 12: Response to bushfires on public land and private land by FFMVic and CFA, Victoria, 2022-23 to 2024-25
Indicator: The impact of bushfires is minimised (e.g. fire size and time to control fire) (1.2.2) | Target | 2022-23 | 2023-24 | 2024-25 | 2024-25 result | Explore Data |
|---|---|---|---|---|---|---|
| Area (ha) of bushfires attended by FFMVic |
| 4,280 | 50,890 | 251,730 |
|
|
| Number of fires attended by FFMVicc |
| 838 | 1,179 | 1,371 |
|
|
| Number of vegetation fires attended by CFAa, c |
| 1,949 | 2,892 | 3,820b |
|
Note(a): Indicator 2.1.2 from CFA Outcomes Framework.
Note(b): In Q1 FY 2024-25, the number is based on ‘grass and scrub’ fires. This was later updated to ‘vegetation’ fires from Q2 onwards.
Note(c): Figures represent the number of fires attended by FFMVic or CFA and may include instances where both agencies responded to the same fire. As a result, totals may exceed the actual number of bushfires recorded in the relevant financial year.
Aboriginal self-determination in cultural fire and bushfire management
Strategy Outcome: The sector supports and enables self-determination of Traditional Owners and Aboriginal Victorians in land and bushfire management
Aboriginal self-determination in cultural fire and bushfire management is a core commitment of Victoria’s Bushfire Management Strategy. The Strategy recognises the importance of working in genuine partnership with Traditional Owners and Aboriginal Victorians in land and bushfire management, including cultural fire.
Measuring progress in this domain is different to other areas of the Report Card. Meaningful indicators and measures need to be shaped and strengthened over time through engagement and co-development with Traditional Owners. For that reason, reporting in this domain uses an interim approach for 2024–25.
The interim measures reported here provide a practical baseline for early monitoring and reporting, and are drawn from existing sources where measures already exist and sit within established Traditional Owner governance and reporting contexts. In particular, this includes measures drawn from Pupangarli Marnmarnepu ‘Owning Our Future’ Aboriginal Self-Determination Reform Strategy 2020–2025 and the Statewide Caring for Country Partnership Forum Implementation Plan 2025–2026. Where relevant, workforce and cultural capability-related measures are also aligned to DEECA’s First Peoples Workforce Strategy 2026–2031.
Over time, the sector intends to expand and strengthen what is reported in this domain, working with Traditional Owners to ensure measures remain appropriate, meaningful and transparent for public reporting.
Intermediate Outcome 3.1
The sector works with Traditional Owners and Aboriginal Victorians to enable their participation in fire management to their self-determined interests and objectives.
Table 13: Number of Aboriginal community members employed by FFMVic to support cultural burning activities 2024-25
Interim Indicator: Increased number of Aboriginal community members employed by sector in fire management | Target | 2022-23 | 2023-24 | 2024-25 |
|---|---|---|---|---|
| Number of Aboriginal community members employed by FFMVic to support cultural burning activities |
|
|
| 18 |
Note: New reporting measure introduced in FY2024-25.
Intermediate Outcome 3.3
The sector provides culturally appropriate support to Traditional Owners and Aboriginal Victorians who are seeking to plan and deliver cultural fire management activities on Country
Table 14: Cultural Burns delivered in partnership with FFMVic and CFA, Victoria, 2022-23 to 2024-25
Interim Indicator: Increased number of cultural fire management activities delivered on Country. | Target | 2022-23 | 2023-24 | 2024-25 |
|---|---|---|---|---|
| Number of Cultural Burns delivered in partnership (FFMVic and CFA) |
| 23 | 36 | 31 |
FFMVic and CFA partner with Victorian Traditional Owners to deliver cultural burns. This includes a record number of cultural burns (104) nominated to year 1 of the JFMP bringing the total number of cultural burns planned to 211. Of these, 31 were delivered (FFMVic – 26; CFA – 5).
Partnering with Traditional Owners in bushfire response
DEECA is establishing new ways of working with Traditional Owners during emergencies to support self-determination and improve outcomes for Country.
This includes a pilot program to enable Registered Aboriginal Parties (RAPs) to deploy Country Advisors to Incident Management Teams (IMTs) to provide advice regarding Country and biocultural values during in-scope emergencies.
The pilot was developed over the 2025-26 high risk weather season but was not finalised in time to deploy Country Advisors when major fires ignited in January. However, some RAPS were involved with IMTs through local arrangements. The pilot has been extended over the 2026-27 high risk weather season.
Wadawurrung Wiyn – Healing Country with Fire
While cultural burns often receive attention for their visual and ecological impact, the extensive planning, collaboration and cultural leadership behind them are less frequently acknowledged. Wadawurrung Traditional Owners Aboriginal Corporation’s (WTOACWiyn) Murrup Rangers, have been working tirelessly with partners to reintroduce Cultural fire practices across Wadawurrung Dja (Country).
Strategic Cultural Fire Program
In 2024/25, Wadawurrung Wiyn Murrup Rangers delivered 9 cultural burns across Dja in collaboration with DEECA, CFA, Corangamite CMA, Glenelg Hopkins CMA and Trust for Nature. Wadawurrung are on the journey to reintroduce burning Culturally in a way the Ancestors once did. Many connections are made throughout the self-determined process of Wadawurrung people reclaiming Cultural obligations building the partnerships (extract from Wadawurrung Wiyn – Cultural Fire Strategy - Healing Country with Fire 2024-2034).
Wadawurrung’s approach is deeply aligned with their Paleert Tjaara Dja – Let’s Make Country Good Together (2020–2030) Wadawurrung Country Plan, a 10-year strategy that guides their work in restoring Country through cultural practices and community empowerment.
Launching the Cultural Fire Strategy
A major milestone this year was the launch of Wadawurrung Wiyn – Cultural Fire Strategy: Healing Country with Fire. This strategy was shaped through inclusive engagement with WTOAC staff and Wadawurrung members, who came together in a series of events to co-design the vision. The launch event, held at the Wadawurrung Ballan Depot – Bostock, was a celebration of community, Culture and collaboration, attended by partners who have supported Wadawurrung on their journey.
The strategy outlines 3 key objectives:
- Build connections
- Share knowledge
- Be empowered
These objectives reflect Wadawurrung’s commitment to cultural leadership, knowledge exchange and community resilience.
Building Capacity for the Future
To support the growing fire program, Wadawurrung has invested in fit-for-purpose fleet vehicles, including a fire-line compliant Landcruiser and a tanker. This infrastructure enhances their capacity to deliver Cultural burns and, when appropriate, partner with DEECA in fuel reduction and emergency response efforts.
Wadawurrung continues to look ahead, forging new collaborations with organisations such as Federation University and local Landcare groups to plan future burns and expand the reach of cultural fire practices.
Ecosystem resilience and nature conservation
Strategy Outcome: Fire regimes support healthy and resilient ecosystems and nature conservation in a changing climate.
Intermediate Outcome 4.2
Bushfire management supports appropriate fire regimes to promote ecosystem resilience
Ecosystem resilience
Fire is a natural and vital process for many of Victoria’s ecosystems. Many plants rely on fire to reproduce. However, inappropriate fire regimes and particularly multiple severe fires in close succession can have detrimental impacts on the resilience of natural ecosystems.
In the context of bushfire management, ecosystem resilience is an ecosystem’s capacity to absorb natural and management-imposed disturbance but still retain its basic structure – in terms of species abundance and composition – function and identity over space and time.
Victoria currently monitors ecosystem resilience using 2 key metrics:
- Tolerable Fire Interval (TFI) – which measures how well vegetation is likely to regenerate after fire, with regard to its reproductive maturity, and
- Growth Stage Structure (GSS) – which provides information on the diversity of ages of forests and other vegetation types, which are important for providing habitats for different plants and animals.
It is desirable to minimise the total area burnt (by bushfires and/or planned burning) while vegetation is below reproductive maturity or in early growth stages. Sometimes planned burning in areas below minimum TFI is undertaken where there is an important need to reduce bushfire risk. Planned burning may also be applied in areas below minimum TFI and/or in early growth stages where there is a need to reintroduce fire back into a bushfire affected area to create a diversity of growth stages (e.g. a large bushfire scar such as those in Gippsland following the 2019-20 Black Summer fires) and/or there is a net benefit to ecological resilience by using low-intensity planned fire to seek to reduce the impact of large high-severity bushfires.
Table 15: Percentage (%) of total public land estate in Growth stage structures by FFMVic, Victoria, 2022–23 to 2024–25
Indicator: Fire regimes across Victoria maintain or improve ecosystem resilience (4.2.1) | Target | 2022-23 | 2023-24 | 2024-25 | 2024-25 result | Explore data |
|---|---|---|---|---|---|---|
| Percentage (%) of total public land estate in juvenile state |
| 15% | 13% | 15% |
| |
| Percentage (%) of total public land estate in adolescent state |
| 27% | 27% | 26% |
| |
| Percentage (%) of total public land estate in mature state |
| 34% | 35% | 34% |
| |
| Percentage (%) of total public land estate in old stage |
| 4% | 4% | 4% |
| |
| Percentage (%) of total public land estate with no fire history |
| 21% | 20% | 20% |
|
Table 16: Percentage (%) of total public land estate under min, over max and within Tolerable Fire Interval by FFMVic, Victoria, 2022–23 to 2024–25
Indicator: Fire regimes across Victoria maintain or improve ecosystem resilience (4.2.1) | Target | 2022-23 | 2023-24 | 2024-25 | 2024-25 result | Explore data |
|---|---|---|---|---|---|---|
| Percentage (%) of total public land estate below minimum TFI |
| 49% | 47% | 48% |
| |
| Percentage (%) of total public land estate within TFI |
| 28% | 29% | 29% |
| |
| Percentage (%) of total public land estate above maximum TFI |
| 2% | 3% | 2% |
| |
| Percentage (%) of total public land estate with no fire history |
| 21% | 21% | 20% |
|
Intermediate Outcome 7.1
The sector has the resources it needs, and in the right places to undertake bushfire management.
Ecological burns have a primary objective to improve the health of our ecosystems and reduce the intensity and potential destructive impacts of bushfires on our native flora and fauna.
Table 17: Ecological burns delivered by FFMVic, Victoria, 2022-23 to 2024–25
Indicator: Fire is increasingly used to support positive ecological outcomes (4.3.1) | Target | 2022-23 | 2023-24 | 2024-25 | 2024-25 result | Explore data |
|---|---|---|---|---|---|---|
| Number of ecological burns delivered (FFMVic) |
| 28 | 37 | 27 |
|
|
Working together, accountability and shared responsibility
Strategy Outcome: The sector, land managers, communities and industry work together effectively and share responsibility for managing bushfire risk across public and private land
Intermediate Outcome 6.1
The sector and partners collaborate to identify and implement bushfire management that meets their individual and shared responsibilities
Cross-tenure burning
FFMVic’s fuel management program is strengthened by the Victorian Government’s Safer Together program, which ensures that DEECA, including FFMVic, works in partnership with the CFA, Fire Rescue Victoria (FRV), DTP, councils and other sector partners to support integrated, evidence-based bushfire risk management across all public and private land in Victoria.
Table 18: Cross-tenure planned burns led by FFMVic, by region, Victoria, 2022-23 to 2024-25
| Indicator: Bushfire risk management works are increasingly delivered in partnership and across tenures (6.1.1) | Target | 2022-23 No. burns | 2022-23 Area (ha) | 2023-24 No. burns | 2023-24 Area (ha) | 2024-25 No. burns | 2024-25 Area (ha) |
|---|---|---|---|---|---|---|---|
| Barwon South West |
| 14 | 1,512 | 10 | 956 | 5 | 515 |
| Gippsland |
| 3 | 5,408 | 11 | 13,875 | 7 | 8,494 |
| Grampians |
| 2 | 2,908 | 1 | 49 | 1 | 640 |
| Hume |
| 1 | 419 | 2 | 4,664 | 5 | 2,675 |
| Loddon Mallee |
| 0 | 0 | 0 | 0 | 0 | 0 |
| Port Phillip |
| 2 | 37 | 6 | 224 | 3 | 655 |
| Total |
| 22 | 10,282 | 30 | 19,767 | 21 | 12,979 |
Table 19: Cross-tenure planned burns led by CFA, by region, Victoria, 2022-23 to 2024-25
| Indicator: Bushfire risk management works are increasingly delivered in partnership and across tenures (6.1.1) | Target | 2022-23 No. burns | 2022-23 Area (ha) | 2023-24 No. burns | 2023-24 Area (ha) | 2024-25 No. burns | 2024-25 Area (ha) |
|---|---|---|---|---|---|---|---|
| North East |
| 1 | 1.4 | 1 | 0.8 | 0 | 0 |
| North West |
| 0 | 0 | 0 | 0 | 0 | 0 |
| South East |
| 0 | 0 | 0 | 0 | 0 | 0 |
| South West |
| 0 | 0 | 1 | 8.2 | 0 | 0 |
| West |
| 0 | 0 | 1 | 5.9 | 0 | 0 |
| Total |
| 1 | 1.4 | 3 | 14.8 | 0 | 0 |
Planned Burn Taskforce
The Safer Together Planned Burn Taskforce (PBTF) is a recruitment program which deploys available CFA volunteers to planned burns across the State who require personnel support to deliver their burn program. The project commenced as a pilot and is now recognised as an ongoing CFA funded program.
Table 20: CFA Planned Burn Taskforce, Victoria, 2022-23 to 2024-25
Indicator: Increased preparedness of the sector to respond to bushfires. (6.1.2) | Target | 2022-23 | 2023-24 | 2024-25 |
|---|---|---|---|---|
| Number of CFA Planned Burn Taskforce deployments |
| 20 | 38 | 44 |
Enhanced capability and capacity
Strategy Outcome: Victoria is supported and equipped with the skills, equipment, capability and systems to safely and effectively manage bushfire
Intermediate Outcome 7.1
The sector has the resources it needs, and in the right places to undertake bushfire management
How to read table symbols
| Icon | What this indicates |
|---|---|
✓ | Performance target achieved or exceeded |
◯ | Performance target not achieved – within 5 per cent variance. |
⬛ | Performance target not achieved – exceeds 5 per cent variance |
Standing workforce capability
FFMVic, CFA and partner agencies maintain and enhance workforce capability to ensure their capacity to meet current and future demand, including through training and accreditation, resourcing assessments, and readiness and response planning.
Table 21: Workforce and resource capability, FFMVic, Victoria, 2022-23 to 2024-25
Indicator: Increased effectiveness of workforce and asset planning to meet current and future operational demand. (7.1.1) | Target | 2022-23 | 2023-24 | 2024-25 | 2024-25 result |
|---|---|---|---|---|---|
| Personnel with accreditation in a fire and emergency management role (FFMVic) | 2,450 | 2,747 | 2,949 | 2,598 | ✓ |
| Personnel accredited to serve in a senior capacity (level 2 or 3) in a fire and emergency management role (FFMVic) | 340 | 379 | 352 | 353 | ✓ |
| Assessment of model of cover completed to assess resource requirements and availability (FFMVic) | Dec 2024 | Dec 2022 | Dec 2023 | Dec 2024 | ✓ |
| Readiness and response plans completed prior to the upcoming fire season (FFMVic) | Oct 2024 | Oct 2022 | Oct 2023 | Oct 2024 | ✓ |
Additional Information: Current CFA workforce and resource numbers are available at CFA at a Glance. | |||||
Diversity and representation of workforce and volunteers
Intermediate Outcome 7.2
The sector’s workforce and volunteers are healthy, safe and representative of the community they protect
Through the Strategy, the sector will develop fire and emergency management training programs and recruitment processes to attract and retain women and people with diverse lived experiences, with consideration for gender identity, sexuality, race, culture, disability, socioeconomic factors, age and caring responsibilities. To do so, work environments must be safe and inclusive, accessible, and free of discrimination and harassment.
Bushfire management agencies will reinforce workplace cultures that are safe, inclusive, and free from discrimination and harassment. Workplace cultures will be grounded in common principles, with all staff across the sector required to adhere to consistent standards and expectations.
The sector will explore innovative and more flexible ways of working so staff with family or caring responsibilities have the same access to work opportunities, including leadership roles.
The sector will work to ensure its staff reflect the Victorian community by promoting diversity and inclusion at all levels of the sector, including leadership through training programs, recruitment processes and mentoring.
Table 22: Diversity and representation of workforce and volunteers, FFMVic and CFA, Victoria, 2022-23 to 2024-25
Indicator: Increased diversity and representation of workforce and volunteers. (7.2.1) | Target | 2022-23 | 2023-24 | 2024-25 | 2024-25 result |
|---|---|---|---|---|---|
| Percentage (%) of women volunteers in operational roles: CFA (Q4)b | 14.8%a | 15.2% | 15.6% | 15.8% | ✓ |
| Percentage (%) of women volunteers in leadership roles: CFA (Q4)c | 15.9%a | 17.5% | 17.9% | 18.5% | ✓ |
| Percentage (%) of women staff in senior roles: CFA (Q4)d | 45.1%a | 46.9% | 47.2% | 48.5% | ✓ |
| Percentage (%) of volunteers under 40 years of age: CFA (Q4)e | 29.1%a | 28.1% | 28.4% | 28.4% | ◯ |
| Percentage (%) of FFMVic’s emergency workforce that identify as women |
|
| 34% | 36% |
|
Note(a): Historical baseline applied as target.
Note(b): Indicator 3.2.1 from CFA Outcomes Framework.
Note(c): Indicator 3.2.2 from CFA Outcomes Framework.
Note(d): Indicator 3.2.3 from CFA Outcomes Framework.
Note(e): Indicator 3.2.4 from CFA Outcomes Framework.
Appendix
The Appendix includes additional data and information that provides important context or further detail for measures within the Report Card
How to read table symbols
| Icon | What this indicates |
|---|---|
✓ | Performance target achieved or exceeded |
◯ | Performance target not achieved – within 5 per cent variance. |
⬛ | Performance target not achieved – exceeds 5 per cent variance |
Modelled fuel-driven bushfire risk – Barwon South West region and districts
Table 23: Modelled fuel-driven bushfire risk – Barwon South West region and districts.
Indicator: Risk to life and property is reduced. (1.2.1) | Target | 2022-23 | 2023-24 | 2024-25 | 2024-25 result |
|---|---|---|---|---|---|
| Modelled fuel-driven bushfire risk (%) |
| ||||
| Barwon South West Region | 60% | 61% | 57% | 57% | ✓ |
| Far South West District | 55% | 53% | 50% | 54% | ✓ |
| Otway District | 60% | 62% | 58% | 58% | ✓ |
Figure 3: Barwon South West’s fuel-driven bushfire risk from 1980-2025.
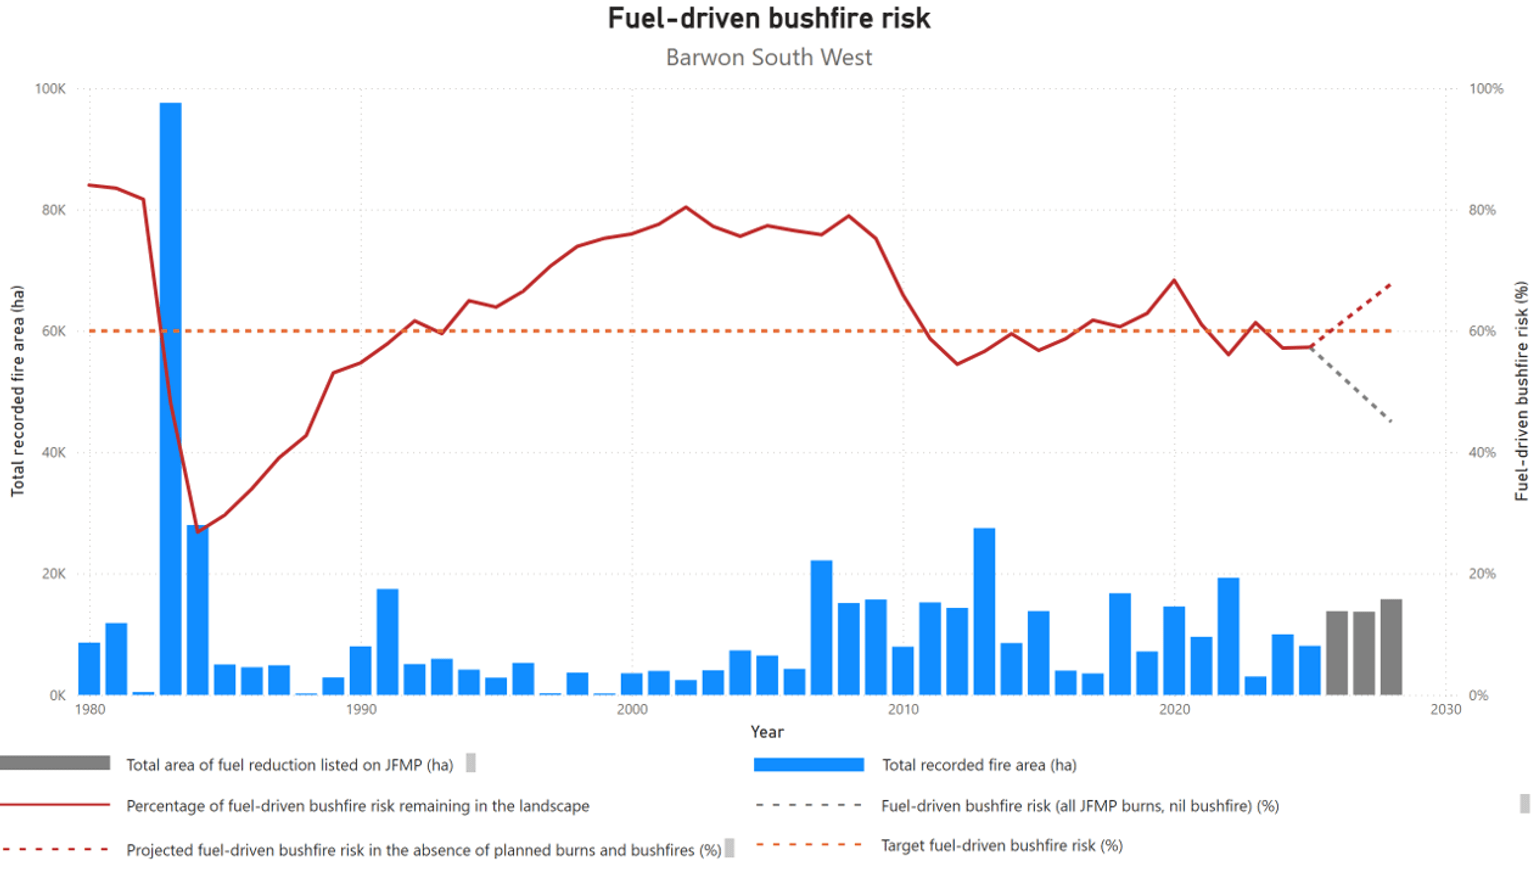
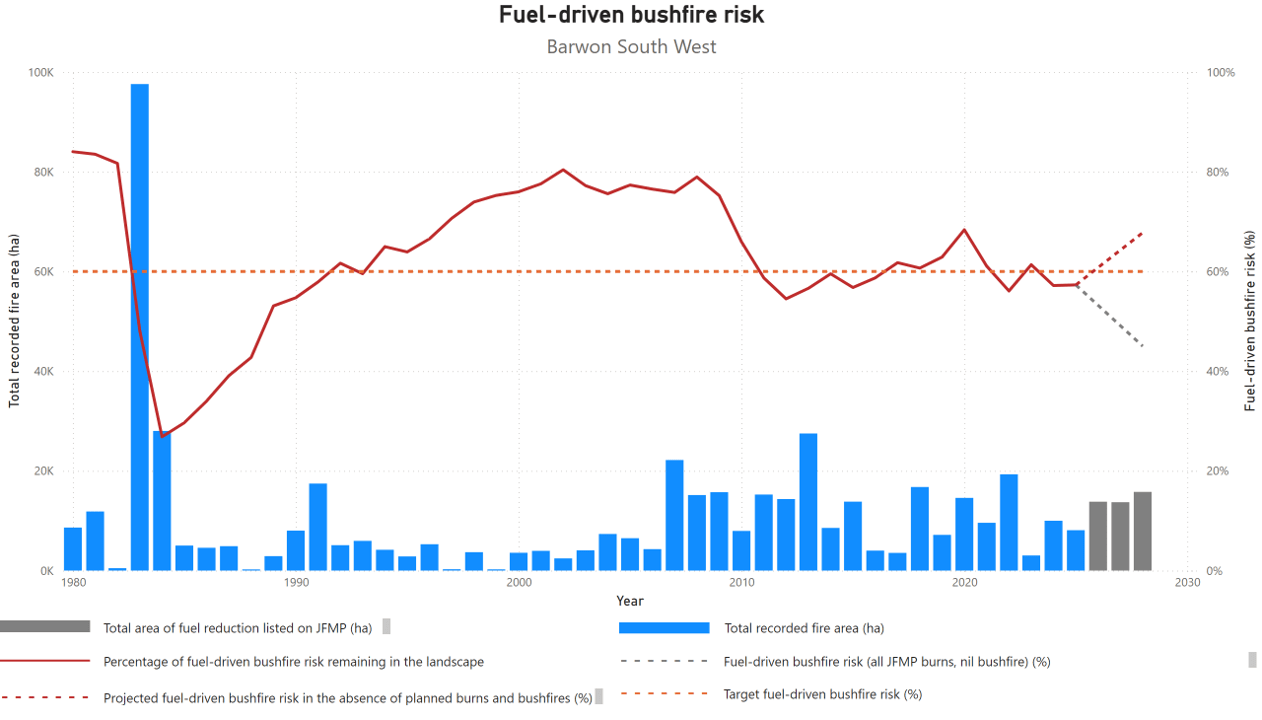
The Barwon South West (BSW) Region has a maximum target of 60% for the modelled fuel-driven bushfire risk, to human life and property. BSW has remained below this target, at 57% for the past 2 years, without significant bushfire activity. Similarly, the Far South West (FSW) district has maintained fuel-driven bushfire risk below a target of 55% since 2010 and is expected to remain below this threshold in the medium-term.
Regional risk is primarily influenced by outcomes in the Otway District, accounting for approximately 95% of the total modelled fuel-driven bushfire risk. Priority burns within the Otway district have maintained risk below its target of 60% since 2020.
The BSW region entered the 2024-25 summer following a dry winter, with Cape Otway recording its lowest annual rainfall on record. This underlying dryness created favourable conditions for several large areas of heath burns over winter. Some of these burns proved valuable in reducing the footprint of the Chapple Vale–Colac Tree fire, which started in November 2024.
Dry conditions persisted through to June 2025, contributing to a relatively late starting autumn burn program and constraining the scale of planned fuel reduction burns. While the dry conditions limited the number of burns that could be safely undertaken, it also enabled late season burns to occur in the FSW and Otway districts. Additional burning opportunities in April and early May enabled the completion of major burn program components.
Several mosaic burns were also delivered across the region, maintaining a focus on landscape scale burning, creating patches of unburnt and burnt areas. However, these burns were restricted to August, with limited opportunities compared with recent years.
Other factors influencing the scale of the 2024-25 fuel management program included:
- higher than normal patrol requirements due to underlying dryness, demonstrated by prolonged fire activity of some burns requiring resources for long periods
- a lack of extended stable weather conditions, with frequent short dry periods following light rain events, reduced the number of suitable days available for planned burns
- constrained access to external to region resources, with BSW generally reliant on external taskforces to assist in program delivery.
Modelled fuel-driven bushfire risk – Gippsland region and districts
Table 24: Modelled fuel-driven bushfire risk – Gippsland region and districts
Indicator: Risk to life and property is reduced. (1.2.1) | Target | 2022-23 | 2023-24 | 2024-25 | 2024-25 result |
|---|---|---|---|---|---|
| Modelled fuel-driven bushfire risk (%) |
|
|
|
|
|
| Gippsland Region | 71% | 46% | 49% | 57% | ✓ |
| Latrobe District | 80% | 84% | 85% | 87% | ⬛ |
| Macalister District | 65% | 58% | 60% | 62% | ✓ |
| Snowy District | 65% | 8% | 14% | 27% | ✓ |
| Tambo District | 65% | 33% | 35% | 47% | ✓ |
Figure 4: Gippsland’s fuel-driven bushfire risk from 1980-2025.
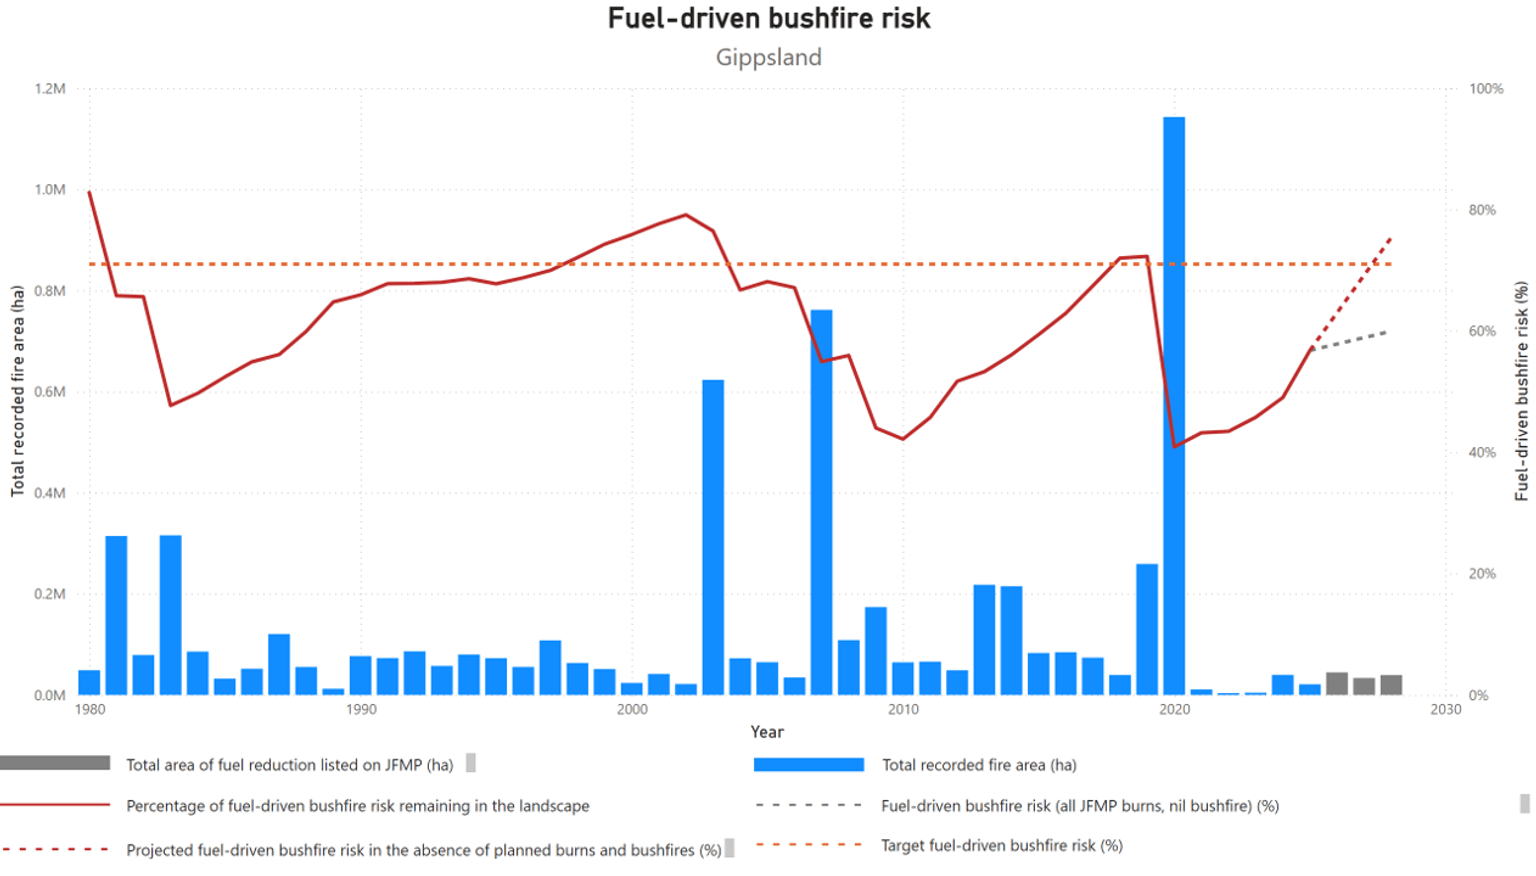
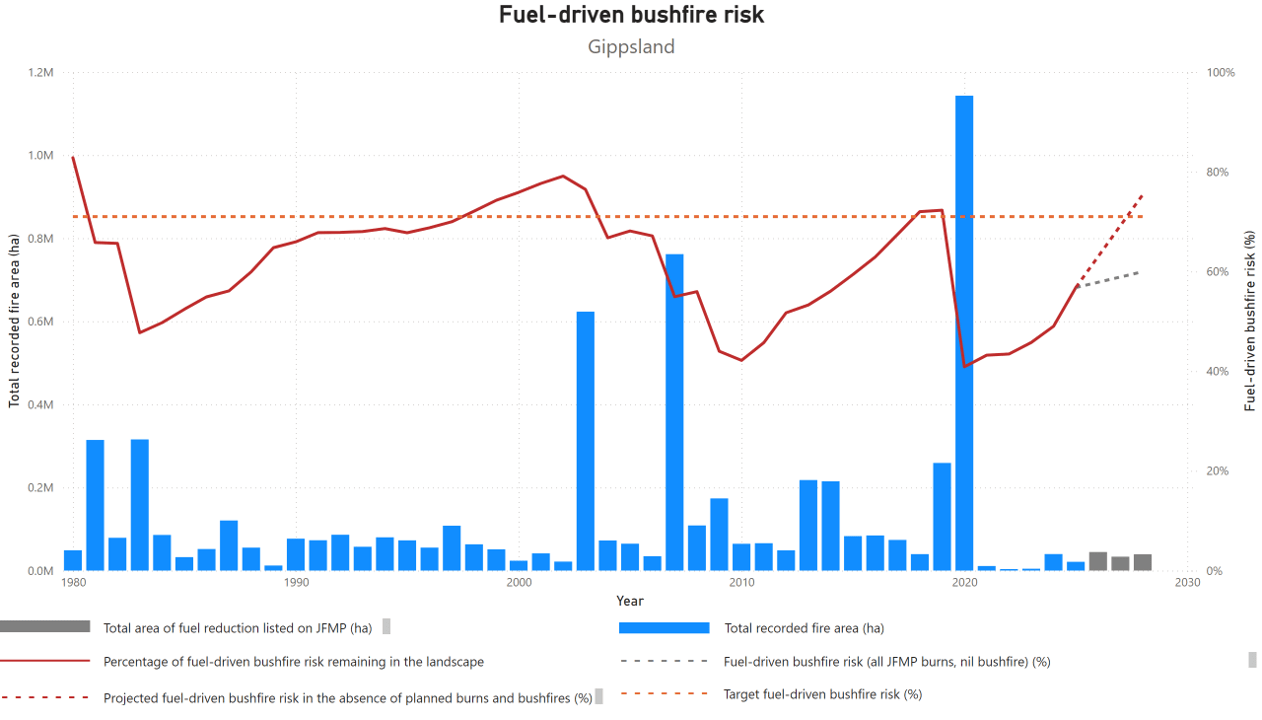
Gippsland’s long-term regional planning target is to maintain fuel-driven bushfire risk at or below 71%. This year, risk has remained below this target at 57%. Macalister, Snowy, and Tambo districts have all remained below their targets of 65%, however Latrobe district continues to face elevated fuel-driven risk – currently modelled at 87% against a target of 80%.
Only some of Latrobe district’s fuel-driven bushfire risk can be reduced through fuel management delivered by FFMVic. Most of the risk originates from private land, plantations or neighbouring districts, including Yarra and Murrindindi, which are dominated by Mountain Ash Forest and are difficult to treat through planned burning.
Short burning windows and unfavourable weather conditions have limited the extent and effectiveness of the planned burning program in the Latrobe districts over recent years. Planned burning opportunities in the district were limited by below average rainfall combined with a prolonged fire season into autumn, which prevented the completion of all burns planned for 2024/25.
Despite this, Latrobe district delivered over 4,500 ha of planned burns, preventing an increase in fuel-driven bushfire risk. Future fuel management activities focus on areas where mitigation measures have the most significant impact on reducing this risk. Latrobe district is working with neighbouring districts and landholders to deliver targeted fuel reduction burns to reduce residual risk. This targeted approach is aligned with long-term goals, contributing to broader risk reduction efforts across the region.
Modelled fuel-driven bushfire risk – Grampians region and districts
Table 25: Modelled fuel-driven bushfire risk – Grampians region and districts
Indicator: Risk to life and property is reduced. (1.2.1) | Target | 2022-23 | 2023-24 | 2024-25 | 2024-25 result |
|---|---|---|---|---|---|
| Modelled fuel-driven bushfire risk (%) |
|
|
|
|
|
| Grampians Region | 70% | 76% | 75% | 73% | ◯ |
| Midlands District | 70% | 79% | 78% | 75% | ⬛ |
| Wimmera District | 70% | 40% | 39% | 43% | ✓ |
Figure 5: Grampian’s fuel-driven bushfire risk from 1980-2025.
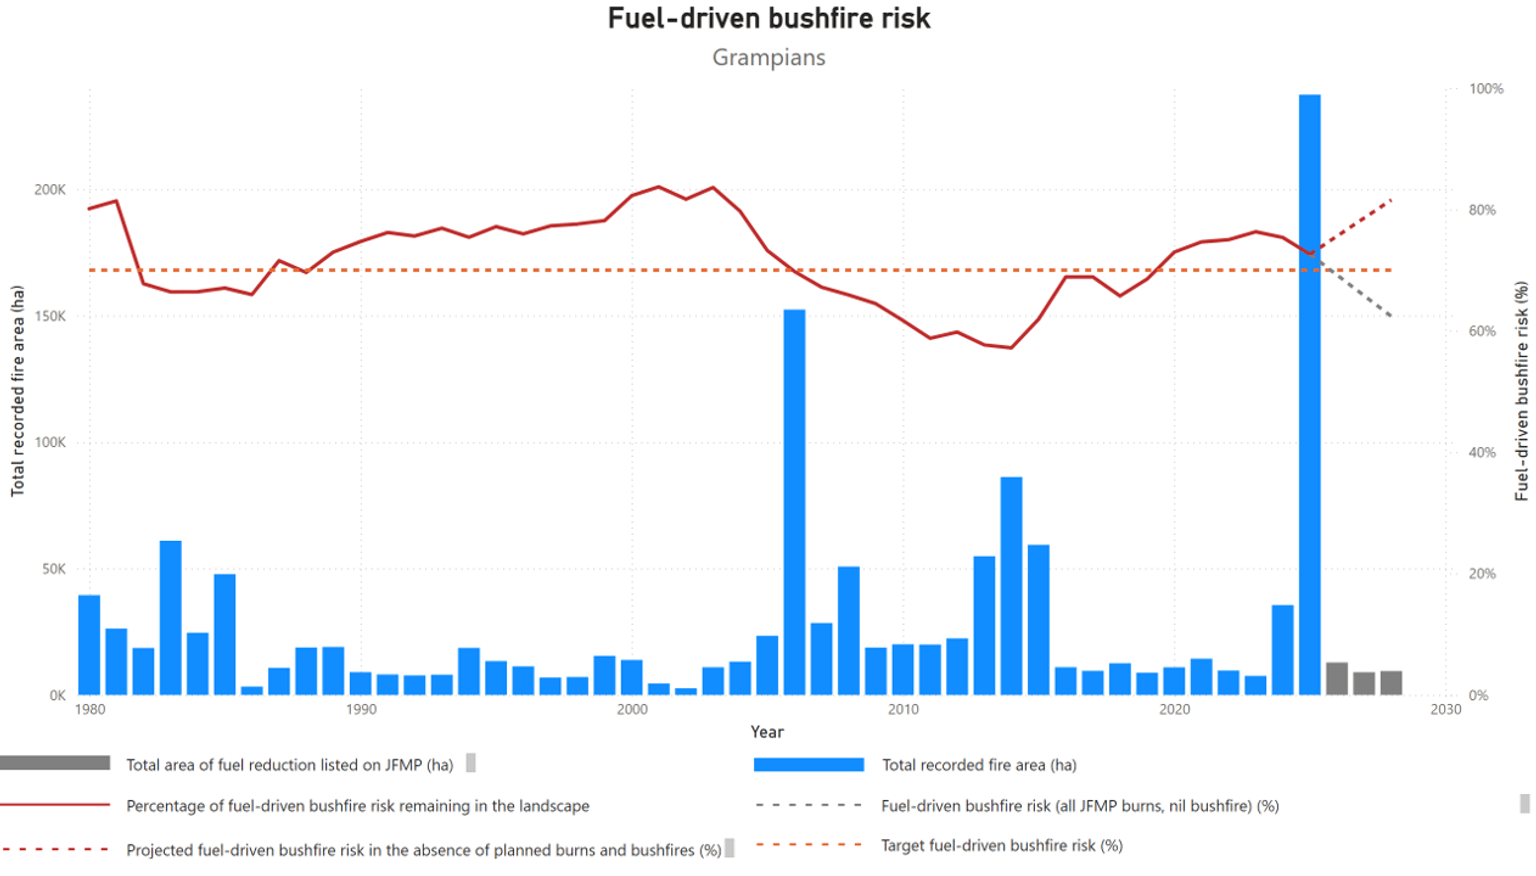
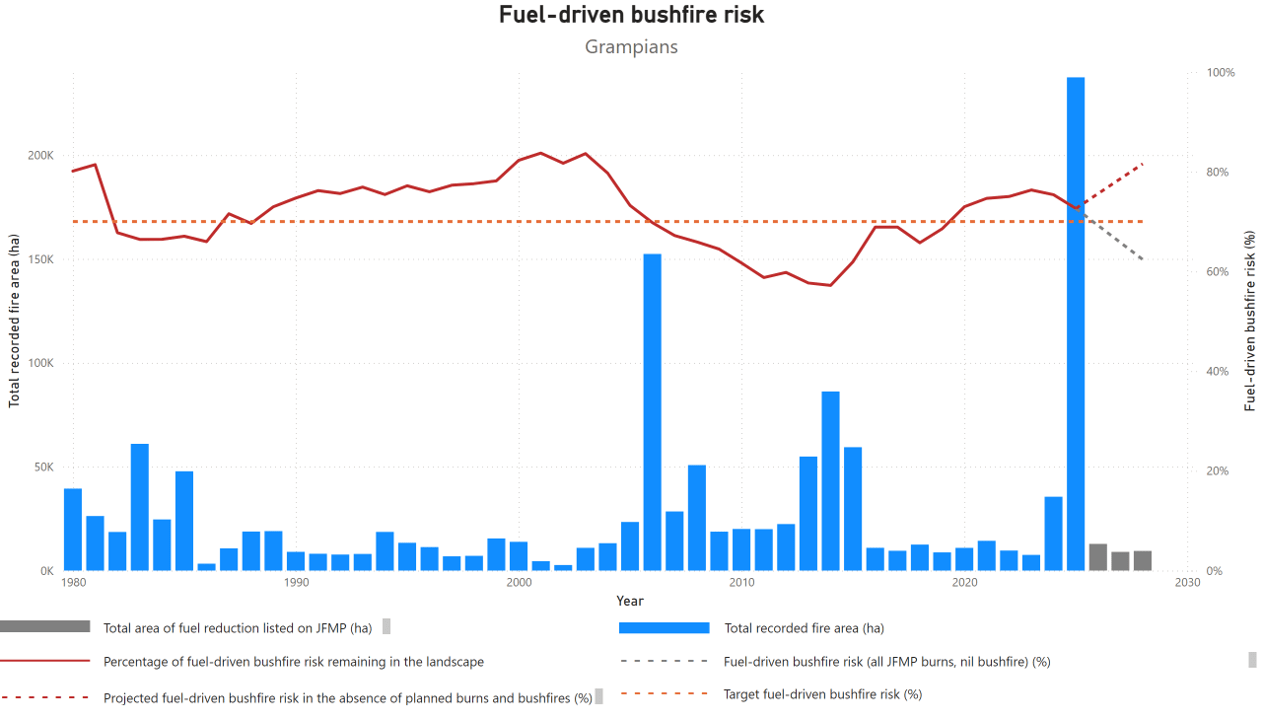
Fuel-driven bushfire risk within the Grampians region was 73% for this year, which remains above the regional target of 70%, but has decreased from 75% in 2023-24. Modelling indicates that without the fuel management program, this risk will continue to rise.
Delivery of the 2024-25 Grampians region fuel management program was again influenced by seasonal conditions and prolonged drought conditions. Across the region, rainfall was below average and temperatures were above average, which impacted the ability to safely deliver planned burns in spring.
Extreme dry conditions, coupled with several severe lightning storms, led to devastating bushfires which saw much of the Grampians (Gariwerd) and Little Desert National Parks impacted by fire between December 2024 and March 2025. While these areas have little impact on the fuel-driven bushfire risk in the Grampians region, these bushfires have had a significant effect on environmental and cultural values.
Involvement of staff and contractors in response to bushfires and subsequent recovery activities also impacted the delivery of planned burn and non-burning fuel treatment activities in both districts.
Extended settled weather in autumn 2025 assisted the Midlands district to deliver a sizeable planned burn program in high-risk areas, including the Wombat State Forest, the Lerderderg State Park and in the forests south-west of Ballarat. Removal of 2021 storm debris in the Wombat State Forest continued to reduce bushfire risk, improving safety and access for bushfire suppression across the broader forested landscape.
In April 2025, a planned burn at Old Tom Track near Daylesford breached its control lines and was investigated by OBRM. Recommendations from this investigation will contribute to the improvement of planning and delivery of fuel-reduction burns.
The Grampians region is expecting another high-risk bushfire season in 2025-26, which may impact fuel management program delivery.
Fuel management continues to focus on high-risk areas in the Wombat State Forest and in the forests south-west of Ballarat. Several burns are also planned in areas of the Wimmera district to protect communities and environmental assets which were not affected by 2024-25 bushfires.
Fuel management activities also include mulching and spraying of woody weeds in and around Hepburn Springs, Daylesford and Blackwood, where burning is difficult. Mulching in areas to the north and west of Ararat and Stawell is also aimed at reducing bushfire risk to these communities. Delivery of these non-burning fuel treatment activities is generally not limited by weather conditions.
Modelled fuel-driven bushfire risk – Hume region and districts
Table 26: Modelled fuel-driven bushfire risk – Hume region and districts
Indicator: Risk to life and property is reduced. (1.2.1) | Target | 2022-23 | 2023-24 | 2024-25 | 2024-25 result |
|---|---|---|---|---|---|
| Modelled fuel driven bushfire risk (%) |
|
|
|
|
|
| Hume Region | 69% | 71% | 70% | 69% | ✓ |
| Goulburn District | 75% | 73% | 70% | 73% | ✓ |
| Murrindindi District | 80% | 80% | 75% | 78% | ✓ |
| Ovens District | 55% | 65% | 67% | 62% | ⬛ |
| Upper Murray District | 60% | 42% | 49% | 51% | ✓ |
Figure 6: Hume’s fuel-driven bushfire risk from 1980-2025.
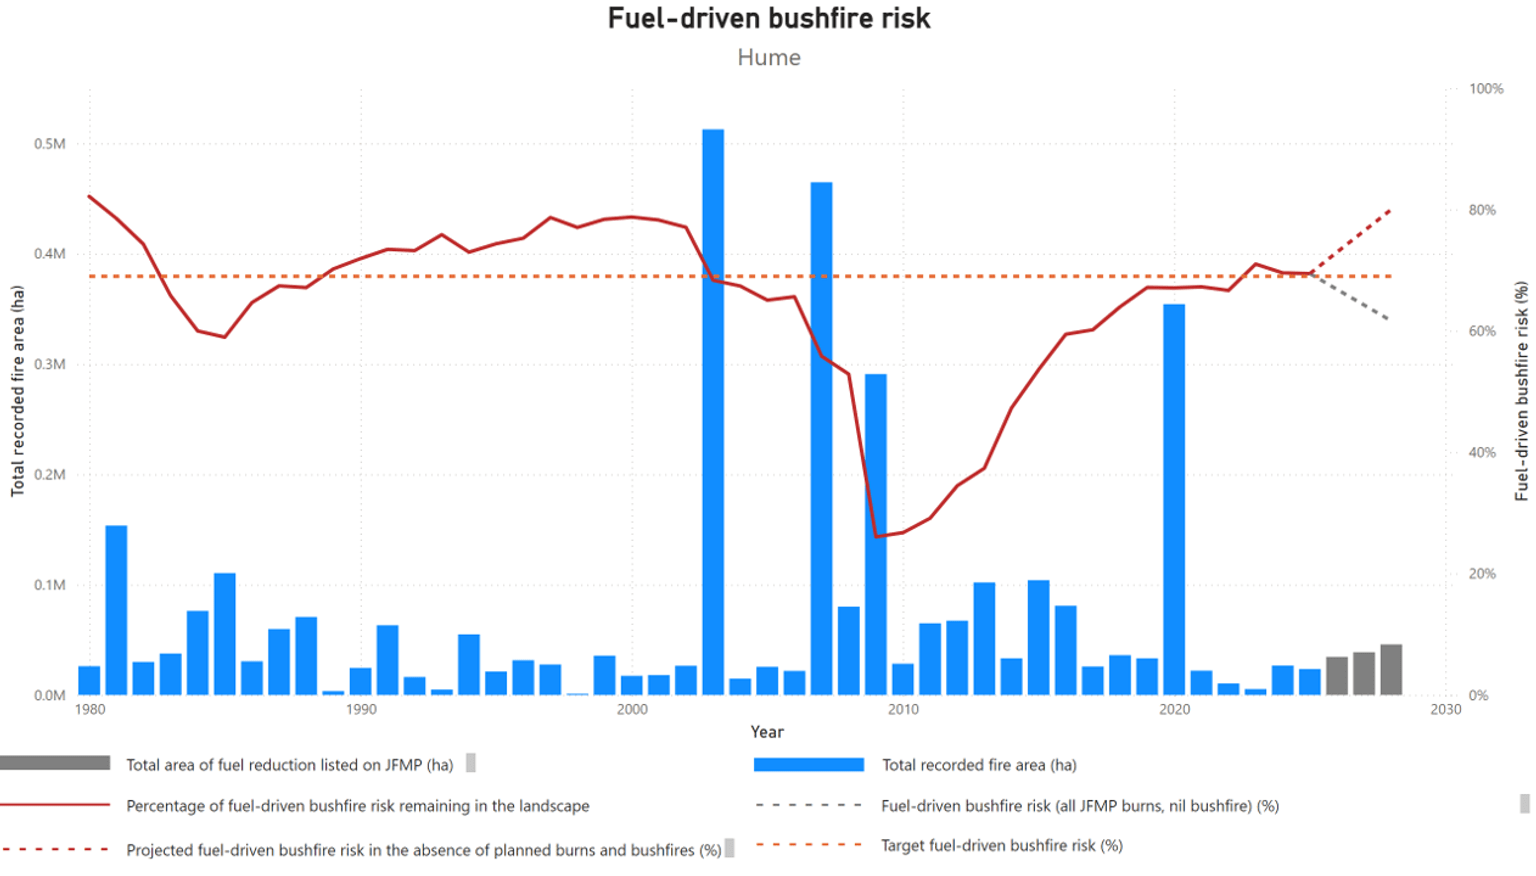
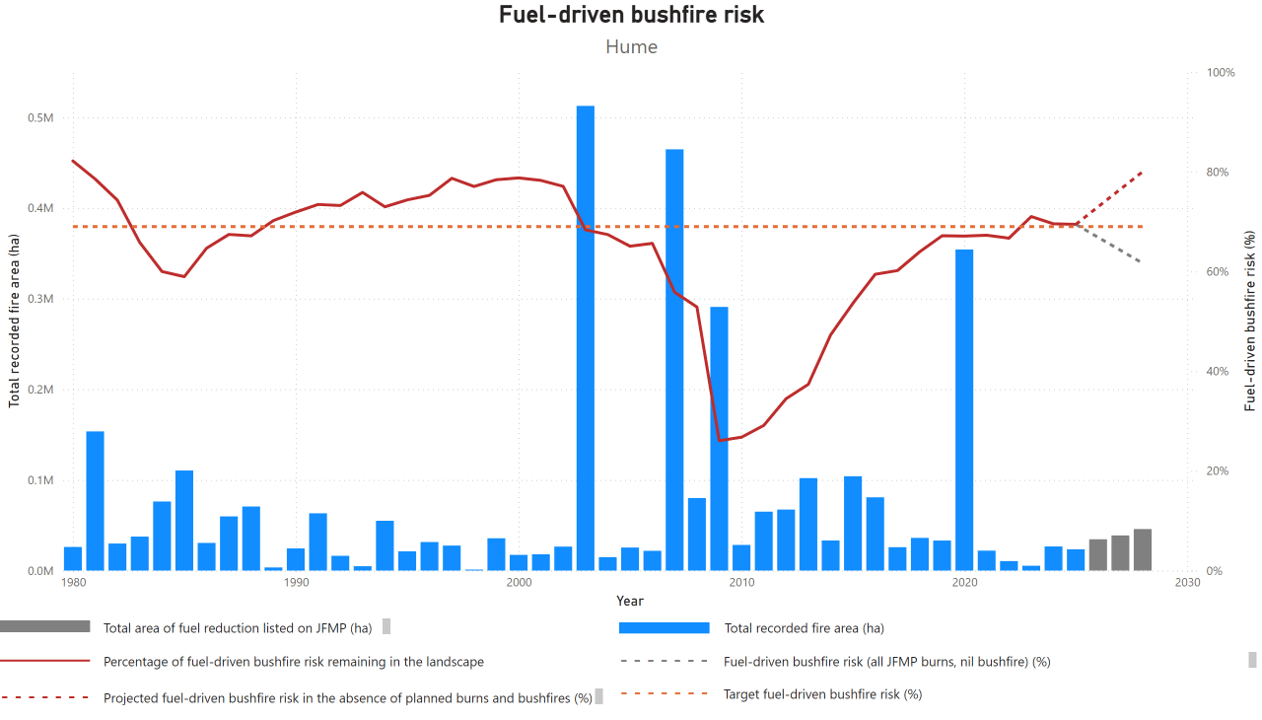
Fuel-driven bushfire risk within the Hume region was 69% for this year, achieving the region’s target of 69% and contributing to the State target of 70%. Fuel-driven bushfire risk was maintained below target levels in 3 of the region’s 4 fire districts. Burn delivery in the Goulburn, Murrindindi and Upper Murray districts has contributed to the maintenance of fuel-driven bushfire risk below their respective targets.
Delivery of the Hume region fuel management program was completed in June 2024. The 2024-25 fire season saw dry weather leading into summer, contributing to significant bushfires in Victoria’s west from 16 December 2024 to 6 January 2025. For these events, the Hume region provided suppression resources and support. Prolonged dry conditions continued throughout the season, with the Hume region’s largest bushfire at Boho in the Goulburn district, burning across the first week of March 2025. Conditions settled in late March, allowing planned burn delivery across all 4 districts from 25 March to 21 May.
The significant fire season of 2019-20 impacted over 330,000 ha of the Upper Murray and Ovens districts. This continues to contribute to substantially reduced fuel-driven bushfire risk levels in the Upper Murray district, beyond the effect of planned burning alone.
In the Ovens district, the fuel-driven bushfire risk has not been effected in the same way, due to the remoteness of those fires from population centres. Subsequent unfavourable conditions for planned burning during the autumns of 2022 and 2023 contributed to the rise in the district’s fuel-driven bushfire risk to 11% above target levels.
This season, the Ovens district’s autumn delivery program has successfully reduced risk levels from 66% to 62%. Although this remains above the district target of 55%, the reduction achieved in 2024-25 gives confidence that target levels can be re-established in the upcoming JFMP planning and delivery cycles.
The status of fuel-driven bushfire risk in the region indicates that the planning and implementation of burns is in line with Hume’s Bushfire Management Strategy (BMS). The BMS and updated Fuel Management Zones (FMZ) focus forest fuel reduction on public land, in areas impacting high-risk communities across the 4 fire districts. The BMS also identifies forested areas on private land near high-risk communities as focus areas for engagement and collaboration activities. Treatment of forest fuels in these areas complements risk reduction activities on public land.
The region and districts will continue to give priority to the fuel management program, except when responding to emergencies. This includes prioritising delivery resources for districts that are above or approaching their fuel-driven bushfire risk targets.
Modelled fuel-driven bushfire risk – Loddon Mallee region and districts
Table 27: Modelled fuel-driven bushfire risk – Loddon Mallee region and districts.
Indicator: Risk to life and property is reduced. (1.2.1) | Target | 2022-23 | 2023-24 | 2024-25 | 2024-25 result |
|---|---|---|---|---|---|
| Modelled fuel-driven bushfire risk (%) |
|
|
|
|
|
| Loddon Mallee Region | 75% | 74% | 72% | 71% | ✓ |
| Mallee District | 90% | 82% | 79% | 76% | ✓ |
| Murray Goldfields District | 75% | 74% | 72% | 71% | ✓ |
Figure 7: Loddon Mallee’s fuel-driven bushfire risk from 1980-2025.
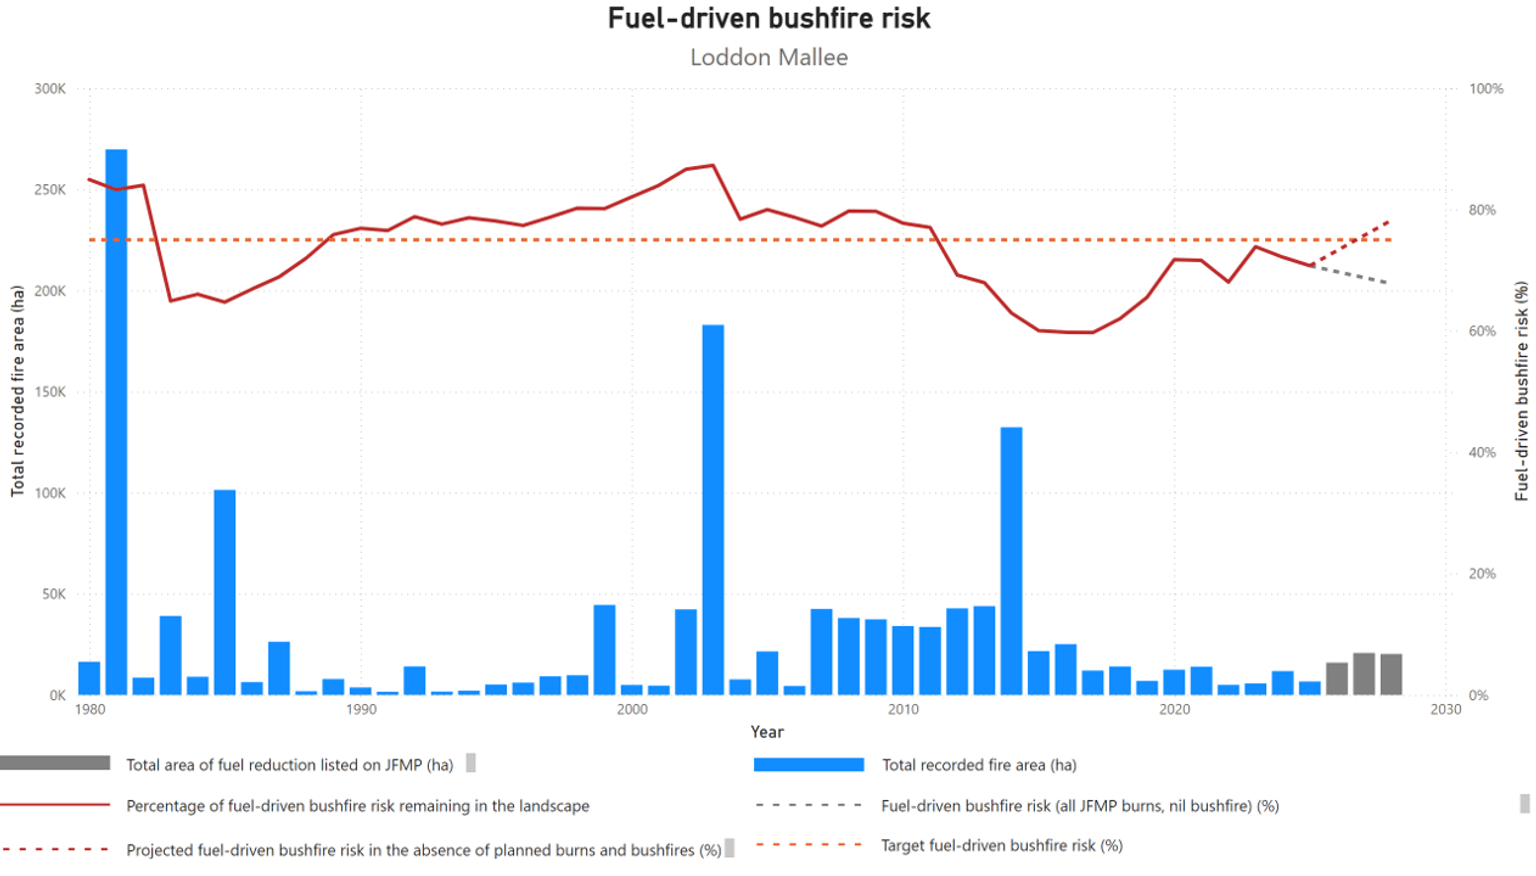
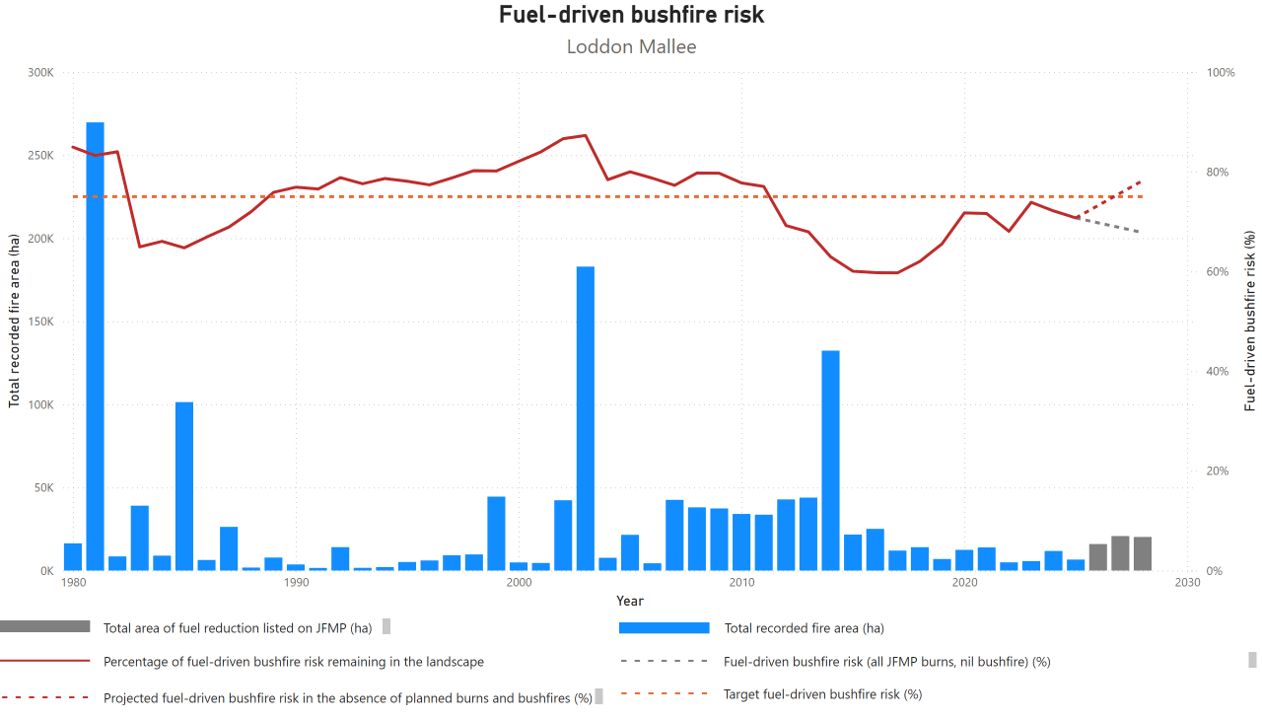
Fuel management programs in the Mallee district resulted in a modest risk reduction from 79% to 76%. While the Murray Goldfields district saw a stabilization of risk, it's crucial to note that without these treatments, risk would have likely increased significantly. The ongoing implementation of the JFMP is expected to drive substantial risk reductions, particularly in the Murray Goldfields district, over the next 3 years.
The Loddon Mallee region (LMR) successfully delivered a comprehensive planned burning program across the Murray Goldfields district, with unfavourable conditions limiting the delivery of the Mallee district’s program. The Murray Goldfields district delivered 25 fuel reduction burns, 3 Traditional Owner led burns and 2 fire investigation training burns, totalling 4,486ha for the year. The Mallee district completed 5 fuel reduction burns, and 2 Traditional Owner led burns, totalling 1,559ha.
This was achieved despite one of the longest dry spells on record, with conditions allowing large-scale bushfire moderation zone (BMZ) burning through to the end of May in the Pyrenees Ranges. FFMVic took advantage of favourable conditions in the Murray Goldfields, bringing some burns forward from years 2 and 3 in the JFMP. This decision was made as other planned burns around Bendigo and Castlemaine were not delivered, due to ongoing drought conditions and the risk of negative environmental impacts. There was also a known risk of intense fires in untreated forested areas, as seen in the Grampian regions where bushfires were difficult to control.
Despite challenging weather conditions, the Mallee district completed 2,140 ha of non-burn fuel treatments across 135 sites, while the Murray Goldfields district completed 1,968 ha of non-burn fuel treatment across 144 sites.
Much of this work was conducted directly adjacent to private property, reducing the risk to life and assets by mitigating the potential for exit fires.
The Murray Goldfields district, classified as elevated risk, prioritised burns in areas that would significantly reduce the risk of bushfires impacting local communities. Over 4,000 ha were treated during the autumn burn season. In the Pyrenees area favourable weather conditions allowed for the completion of 5 burns, scheduled to avoid the grape-growing season. The burn program focused on edge ignitions and some internal work using hand ignition and aerial drip torches. Resources from the Gippsland and Port Phillip regions were instrumental in the successful delivery of this large-scale program. The Pyrenees area located southwest of Avoca, shares similar terrain and fuels to the Mt Cole area in Midlands district, where the devastating Bayindeen fire in late February 2025 started.
This season, LMR partnered with Traditional Owners to deliver or build skills in their cultural fire programs. Weather conditions and an intensive fire season created some resourcing constraints that impacted on the ground support to Traditional Owners, although most groups were still able to deliver part of their program. This included Yorta Yorta conducting their first burn within the Murray Goldfields district at Wyuna, the First Peoples of the Millewa Mallee delivering their second burn at Merbein near Mildura and Djaara continued in their Djandak Wi program with delivery of 5 burns across Murray goldfields district. These programs develop staff capacity and provide opportunities to work more strategically on their burn program, supported by state cultural fire grants.
Modelled fuel-driven bushfire risk – Port Phillip region and districts
Table 28: Modelled fuel-driven bushfire risk – Port Phillip region and districts.
Indicator: Risk to life and property is reduced. (1.2.1) | Target | 2022-23 | 2023-24 | 2024-25 | 2024-25 result |
|---|---|---|---|---|---|
| Modelled fuel-driven bushfire risk (%) |
|
|
|
|
|
| Port Phillip Region | 85% | 89% | 87% | 87% | ◯ |
| Metropolitan District | 85% | 95% | 91% | 92% | ⬛ |
| Yarra District | 85% | 88% | 86% | 86% | ◯ |
Figure 8: Port Phillip’s fuel-driven bushfire risk from 1980-2025.
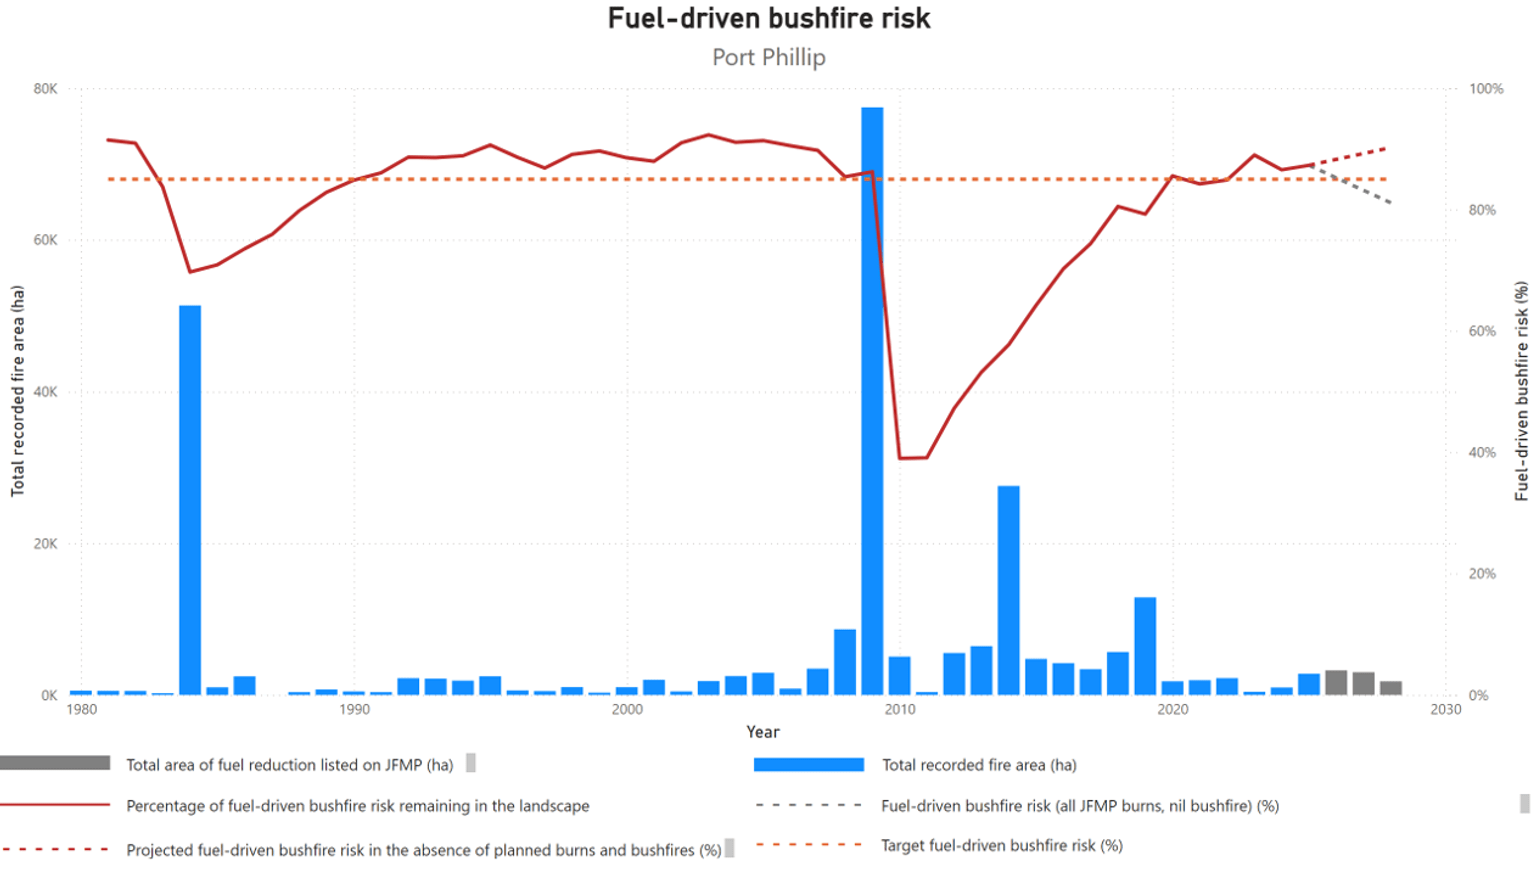
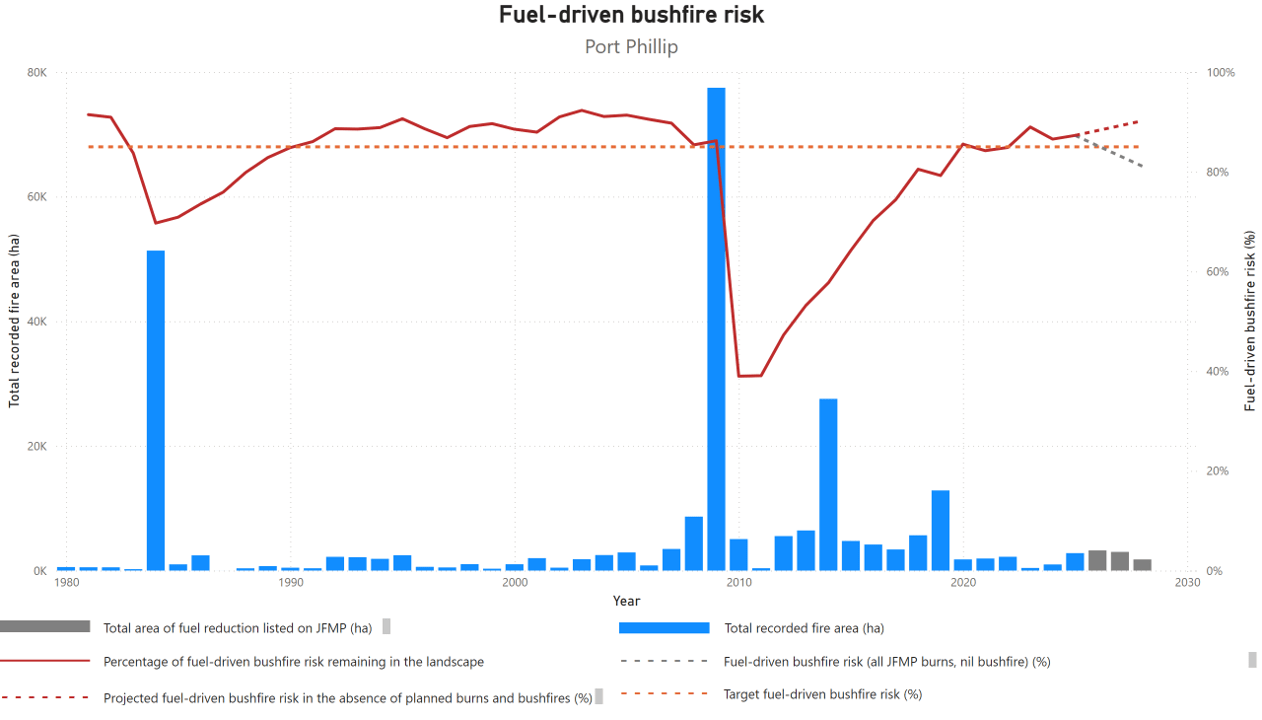
The delivery of last season’s JFMP was limited due to the prolonged fire season, which encroached on the start of the burn season. The region saw fires in Montrose in the middle of March, which is typically when planned burning starts. Extraordinarily dry conditions also impacted burn delivery, with a drought factor of 10 across the Port Phillip region and Keetch–Byram drought index (KBDI) values exceeding 100 for most of the autumn burn window.
This resulted in a later start to the planned burn season, meaning typically dryer forest such as Paul Range remained too dry to burn the entire season. Burning continued through until the middle of May, limited to areas with sufficient rainfall to combat the excessive underlying dryness (the Dandenong Ranges and Warburton Valley).
Table 29: Number of bushfires attended by FFMVic, Statewide and DEECA regions, 2022-23 to 2024-25.
Indicator: The impact of bushfires is minimised (e.g. fire size and time to control fire) (1.2.2) | Target | 2022-23 | 2023-24 | 2024-25 |
|---|---|---|---|---|
| Number of bushfires attended by FFMVic – Statewide |
| 838 | 1,179 | 1,371 |
| Barwon South West |
| 48 | 105 | 145 |
| Gippsland |
| 196 | 209 | 283 |
| Grampians |
| 86 | 168 | 179 |
| Hume |
| 320 | 357 | 407 |
| Loddon Mallee |
| 169 | 293 | 244 |
| Port Phillip |
| 19 | 47 | 113 |
FFMVic fuel management
Planned burn ignition opportunities
FFMVic considers when conditions are favourable to deliver planned burning safely and effectively and utilises appropriate burning windows to deliver the planned burning program. Most of the planned burning program continues to be delivered in autumn, when weather conditions are typically more stable, there is lower risk of extreme fire danger days, and the fuel conditions are appropriate to achieve the desired burn objective. Under these conditions, fire behaviour is generally more manageable and predictable.
During 2024-25 of the 467 burns planned to be delivered, 241 were scheduled for ignition at least once. There was no suitable scheduling opportunity identified for the remainder of the year 1 program due to weather, fuel conditions, response to emergency activities and other program constraints. In the Wimmera district, 20 burns were overrun by the Grampians and Little Desert bushfires before suitable opportunities for delivery.
On average, each scheduled burn was rescheduled 5 times across the year. 19 burns were scheduled over 10 times, and up to 24 times, demonstrating the amount of effort that is committed to finding the right opportunities to deliver burns within the constraints of things like weather and fuel conditions.
Table 30 provides a snapshot of FFMVic planned burn planning, scheduling and delivery, 2024-25.
Table 30: Snapshot of FFMVic planned burn planning, scheduling and delivery, Victoria, 2022-23 to 2024-25
| Target | 2022-23 | 2023-24 | 2024-25 | 2024-25 result | ||||
|---|---|---|---|---|---|---|---|---|
| Planned | 381 | 445 | 467 | |||||
| Scheduled | 335 | 386 |
| |||||
| Delivered | 234 | 316 | 234 | |||||
| Delivered on first scheduling |
| 20 | 59 | |||||
| Scheduled but not delivered | 101 | 79 | 7 | |||||
| Number of burns identified in the current year of JFMP (Year 1 burn) |
|
| 468 | |||||
| Number of burns identified in the current year of the JFMP ready for on ground delivery by 30 May. |
|
| 340 | |||||
Table 31: FFMVic Priority Burn identification and delivery, Victoria, 2022-23 to 2024-25
| Target | 2022-23 | 2023-24 | 2024-25 | 2024-25 result | |
|---|---|---|---|---|---|
| Priority Burns identified (of # of planned burns) |
| 166 | 215 | 145 / 468 | |
| Priority burns delivered |
| 76 | 138 | 66 | |
| Percent of priority burns delivered |
| 46%a | 64% | 46% |
Note(a): Number corrected from Victoria’s Bushfire Risk Management Report 2023-24.
FFMVic reschedules burns frequently to optimise burn delivery across the State. Burns can be scheduled up to nine days from planned ignition. Within four days of planned ignition, a reschedule reason is generally recorded. Beyond four days, no reason is recorded due to higher uncertainty and often multiple reasons for rescheduling.
In 37% of cases, burns were rescheduled beyond the four-day window and no reason was recorded. This is reported as ‘No reason given’ due to the impracticality of assigning a single cause at that stage.
Table 32 indicates the reasons scheduled burns were rescheduled between 2022-23 and 2024-25.
Table 32: Reasons the delivery of scheduled burns were rescheduled, Victoria, 2022-23 to 2024-25
| Reason | 2022-23 | 2023-24 | 2024-25 | |||
|---|---|---|---|---|---|---|
| Number of occurrences | Proportion of instances (%) | Number of occurrences | Proportion of instances (%) | Number of occurrences | Proportion of instances (%) | |
| Burns rescheduled 5-9 days out from planned ignition |
|
|
|
|
|
|
| No reason given | 589 | 50% | 1,072 | 58.9% | 310 | 37% |
| Burns rescheduled within 4 days of planned ignition |
|
|
|
|
|
|
| Fuel Moisture | 333 | 18.9% | 320 | 17.6% | 259 | 26.2% |
| Weather | 287 | 24.4% | 285 | 15.7% | 220 | 22.2% |
| Resourcing | 32 | 2.7% | 110 | 6.0% | 108 | 10.9% |
| Risk | 12 | 1% | 10 | 0.6% | 17 | 1.7% |
| Priority | 3 | 0.3% | 14 | 0.8% | 11 | 1.1% |
| Community Impacts | - | - | 6 | 0.3% | 8 | 0.8% |
| Funding | - | - | 2 | 0.1% | 0 | 0% |
| Miscellaneous | 29 | 2.5% | - | - | - | - |
| Smoke | 1 | 0.1% | - | - | - | - |
| Tourism | 1 | 0.1% | - | - | - | - |
Insights about the reasons why some burns were not ignited can be gained from the Burn Opportunity Reporting Tool (BORT).
In 2021, FFMVic released the prototype BORT to track ignition opportunities on a day-by-day basis and assess whether weather conditions provided an opportunity to ignite each burn as originally planned. The tool is partly automated and requires some manual review for accuracy. Table 33 indicates the reasons why planned burns were not ignited as recorded in BORT.
Table 33: Factors influencing the delivery of planned burns using the Burn Opportunity Reporting Tool (BORT), Victoria, 2022-23 to 2024-25
| Factors influencing delivery | Target | 2022-23 | 2023-24 | 2024-25 |
|---|---|---|---|---|
| Weather conditions not suitable | 64% | 57.5% | 52.5 % | |
| Weather prescription window occurred prior to completion of burn planning or preparation | 24% | 14.3% | 30.3 % | |
| Possible missed opportunity | 5.4% | 8.5% | 8.6 % | |
| Fuel conditions not suitable | 6% | 8.0% | 5.4 % | |
| Undefined | 0% | 7.4% | % | |
| Operation risk too high | 0.3% | 2.7% | 0.1% | |
| Bushfires and other emergencies | 0% | 0.8% | 2.7 % | |
| Other | 0.04% | 0.4% | 0.4 % | |
| Resource availability during peak delivery period | 0.04% | 0.3% | 0.2 % | |
| Community Impact | 0.1 % | |||
| Financial considerations | 0.2% | 0.1% |
Data and model output improvements
The best available evidence-based models and data are used to calculate the results presented in this report each year. Models for metrics, such as fuel-driven bushfire risk or reported costs, are regularly updated as technology improves, better data becomes available, research programs provide new knowledge or mapping accuracy improves. Modelling and data improvements can cause information reported in previous years reports to change. For example, improved fire history and severity mapping may result in a recalculation of fuel-driven bushfire risk in a particular region.
Despite the data and model improvements described above, limitations to the modelling remain. For example, the current method for calculating fuel-driven bushfire risk can only consider fuel reductions that occur due to planned burning or bushfire. This means that the method cannot account for the risk reduction benefits of the broader fuel management program, such as mechanical fuel reduction and smaller treatments like roadside vegetation management. Further, the calculation does not currently account for bushfire risk management activities beyond fuel management, such as reducing potential sources of ignitions, or increasing the success of fire suppression. Lastly, the fuel-driven bushfire risk metric is currently limited to expressing risk reduction to human life and property, and not the full spectrum of values that may be impacted by bushfire.
Improving the data and science behind decisions happens continuously and is reflected through updates to reporting. Consequently, direct comparisons between this report and past or future reports cannot necessarily be made. For the most accurate view of current and historic figures, always consult the most recent report.