How to read table symbols
| Icon | What this indicates |
|---|---|
✓ | Performance target achieved or exceeded |
◯ | Performance target not achieved – within 5 per cent variance. |
⬛ | Performance target not achieved – exceeds 5 per cent variance |
Modelled fuel-driven bushfire risk – Barwon South West region and districts
Table 23: Modelled fuel-driven bushfire risk – Barwon South West region and districts.
Indicator: Risk to life and property is reduced. (1.2.1) | Target | 2022-23 | 2023-24 | 2024-25 | 2024-25 result |
|---|---|---|---|---|---|
| Modelled fuel-driven bushfire risk (%) |
| ||||
| Barwon South West Region | 60% | 61% | 57% | 57% | ✓ |
| Far South West District | 55% | 53% | 50% | 54% | ✓ |
| Otway District | 60% | 62% | 58% | 58% | ✓ |
Figure 3: Barwon South West’s fuel-driven bushfire risk from 1980-2025.
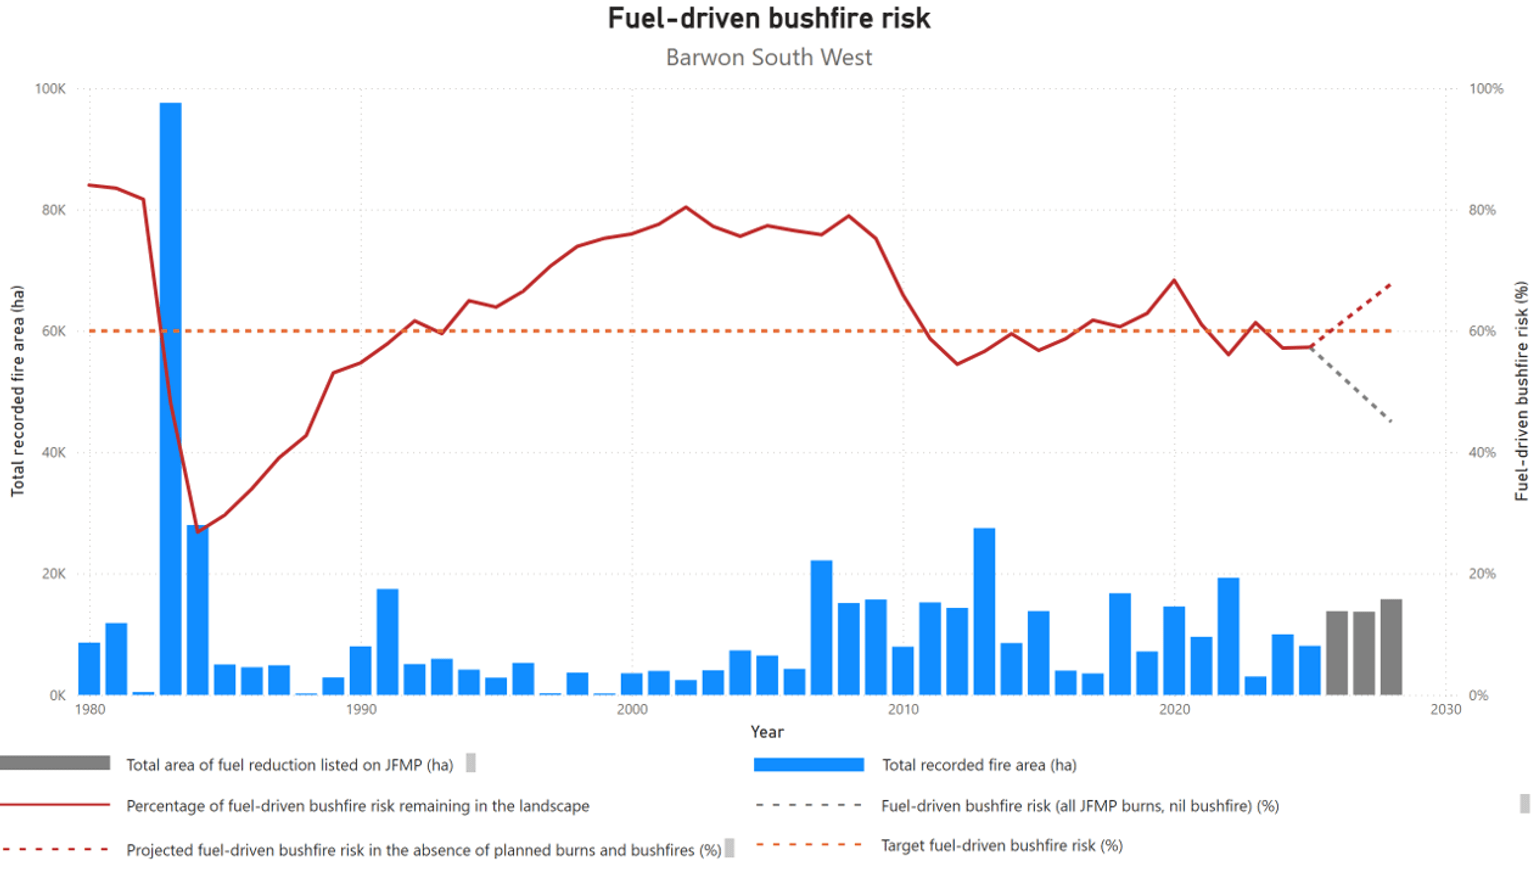
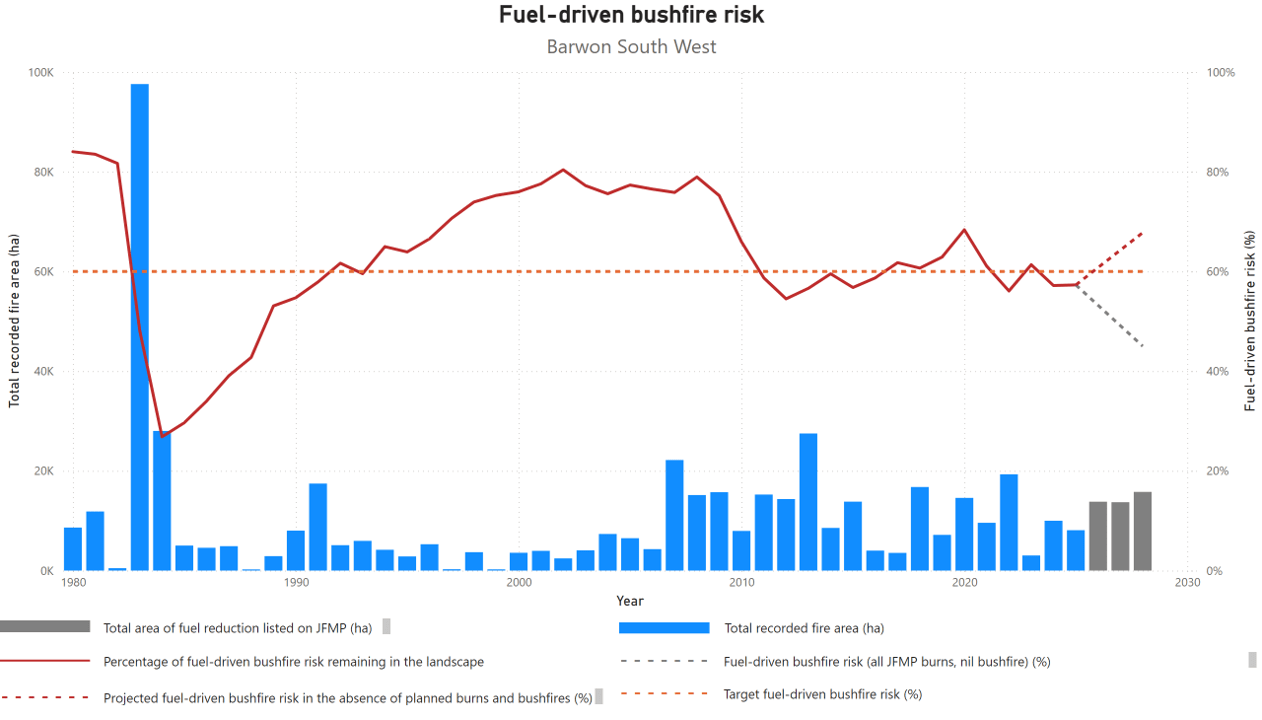
The Barwon South West (BSW) Region has a maximum target of 60% for the modelled fuel-driven bushfire risk, to human life and property. BSW has remained below this target, at 57% for the past 2 years, without significant bushfire activity. Similarly, the Far South West (FSW) district has maintained fuel-driven bushfire risk below a target of 55% since 2010 and is expected to remain below this threshold in the medium-term.
Regional risk is primarily influenced by outcomes in the Otway District, accounting for approximately 95% of the total modelled fuel-driven bushfire risk. Priority burns within the Otway district have maintained risk below its target of 60% since 2020.
The BSW region entered the 2024-25 summer following a dry winter, with Cape Otway recording its lowest annual rainfall on record. This underlying dryness created favourable conditions for several large areas of heath burns over winter. Some of these burns proved valuable in reducing the footprint of the Chapple Vale–Colac Tree fire, which started in November 2024.
Dry conditions persisted through to June 2025, contributing to a relatively late starting autumn burn program and constraining the scale of planned fuel reduction burns. While the dry conditions limited the number of burns that could be safely undertaken, it also enabled late season burns to occur in the FSW and Otway districts. Additional burning opportunities in April and early May enabled the completion of major burn program components.
Several mosaic burns were also delivered across the region, maintaining a focus on landscape scale burning, creating patches of unburnt and burnt areas. However, these burns were restricted to August, with limited opportunities compared with recent years.
Other factors influencing the scale of the 2024-25 fuel management program included:
- higher than normal patrol requirements due to underlying dryness, demonstrated by prolonged fire activity of some burns requiring resources for long periods
- a lack of extended stable weather conditions, with frequent short dry periods following light rain events, reduced the number of suitable days available for planned burns
- constrained access to external to region resources, with BSW generally reliant on external taskforces to assist in program delivery.
Modelled fuel-driven bushfire risk – Gippsland region and districts
Table 24: Modelled fuel-driven bushfire risk – Gippsland region and districts
Indicator: Risk to life and property is reduced. (1.2.1) | Target | 2022-23 | 2023-24 | 2024-25 | 2024-25 result |
|---|---|---|---|---|---|
| Modelled fuel-driven bushfire risk (%) |
|
|
|
|
|
| Gippsland Region | 71% | 46% | 49% | 57% | ✓ |
| Latrobe District | 80% | 84% | 85% | 87% | ⬛ |
| Macalister District | 65% | 58% | 60% | 62% | ✓ |
| Snowy District | 65% | 8% | 14% | 27% | ✓ |
| Tambo District | 65% | 33% | 35% | 47% | ✓ |
Figure 4: Gippsland’s fuel-driven bushfire risk from 1980-2025.
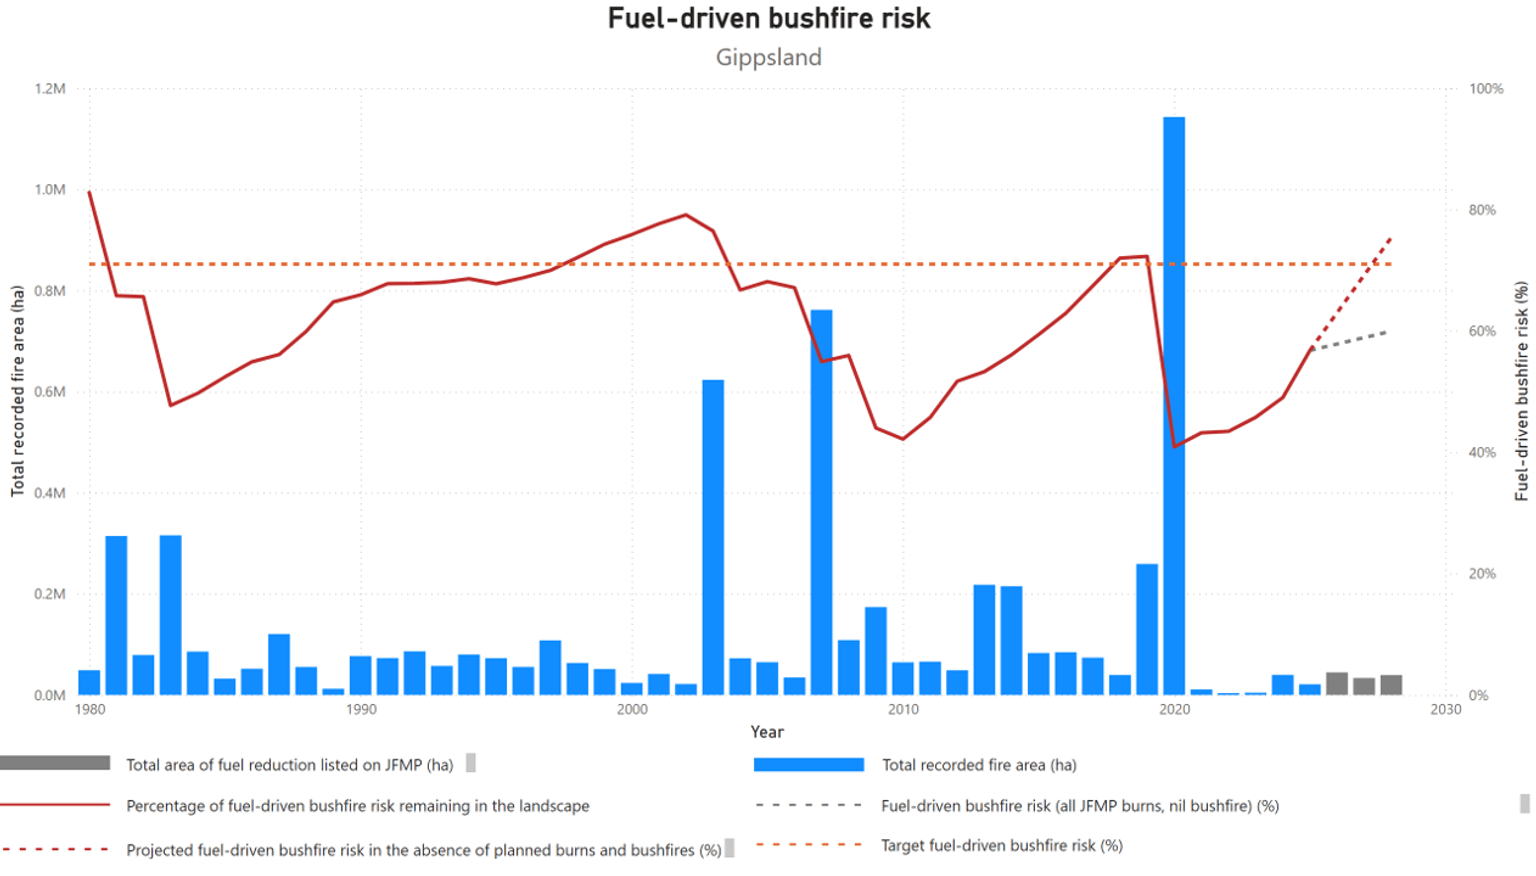
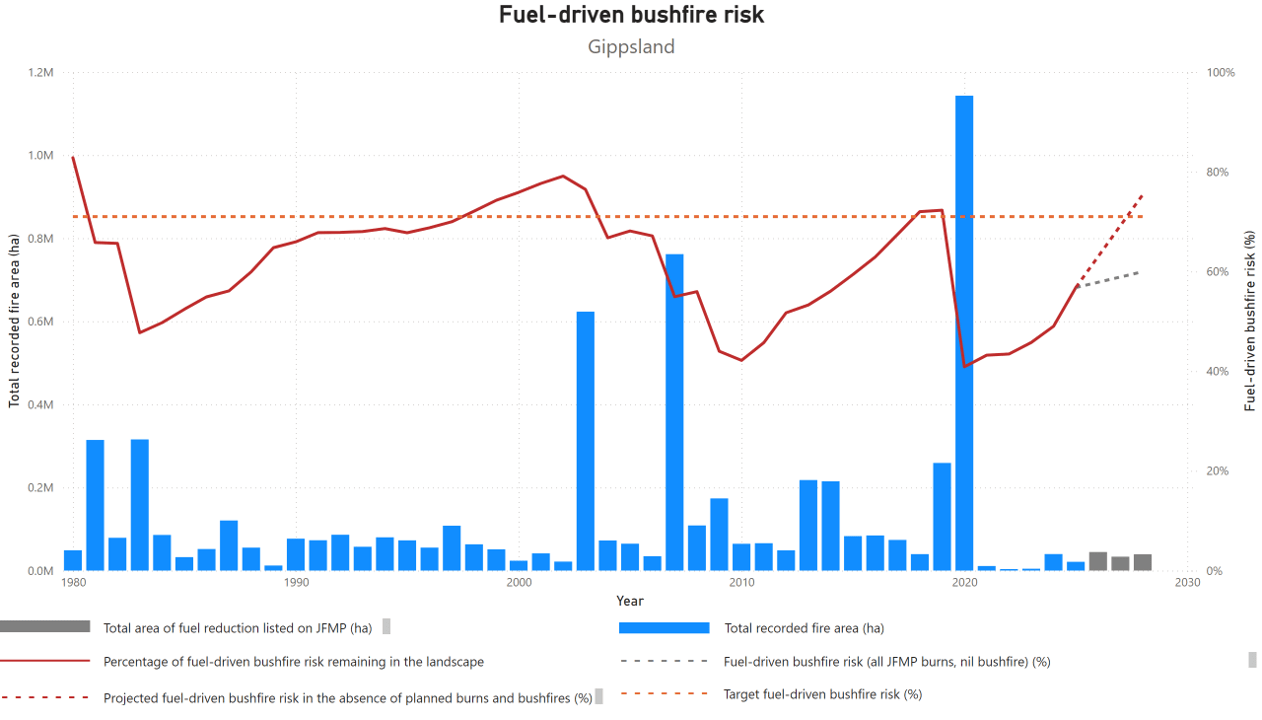
Gippsland’s long-term regional planning target is to maintain fuel-driven bushfire risk at or below 71%. This year, risk has remained below this target at 57%. Macalister, Snowy, and Tambo districts have all remained below their targets of 65%, however Latrobe district continues to face elevated fuel-driven risk – currently modelled at 87% against a target of 80%.
Only some of Latrobe district’s fuel-driven bushfire risk can be reduced through fuel management delivered by FFMVic. Most of the risk originates from private land, plantations or neighbouring districts, including Yarra and Murrindindi, which are dominated by Mountain Ash Forest and are difficult to treat through planned burning.
Short burning windows and unfavourable weather conditions have limited the extent and effectiveness of the planned burning program in the Latrobe districts over recent years. Planned burning opportunities in the district were limited by below average rainfall combined with a prolonged fire season into autumn, which prevented the completion of all burns planned for 2024/25.
Despite this, Latrobe district delivered over 4,500 ha of planned burns, preventing an increase in fuel-driven bushfire risk. Future fuel management activities focus on areas where mitigation measures have the most significant impact on reducing this risk. Latrobe district is working with neighbouring districts and landholders to deliver targeted fuel reduction burns to reduce residual risk. This targeted approach is aligned with long-term goals, contributing to broader risk reduction efforts across the region.
Modelled fuel-driven bushfire risk – Grampians region and districts
Table 25: Modelled fuel-driven bushfire risk – Grampians region and districts
Indicator: Risk to life and property is reduced. (1.2.1) | Target | 2022-23 | 2023-24 | 2024-25 | 2024-25 result |
|---|---|---|---|---|---|
| Modelled fuel-driven bushfire risk (%) |
|
|
|
|
|
| Grampians Region | 70% | 76% | 75% | 73% | ◯ |
| Midlands District | 70% | 79% | 78% | 75% | ⬛ |
| Wimmera District | 70% | 40% | 39% | 43% | ✓ |
Figure 5: Grampian’s fuel-driven bushfire risk from 1980-2025.
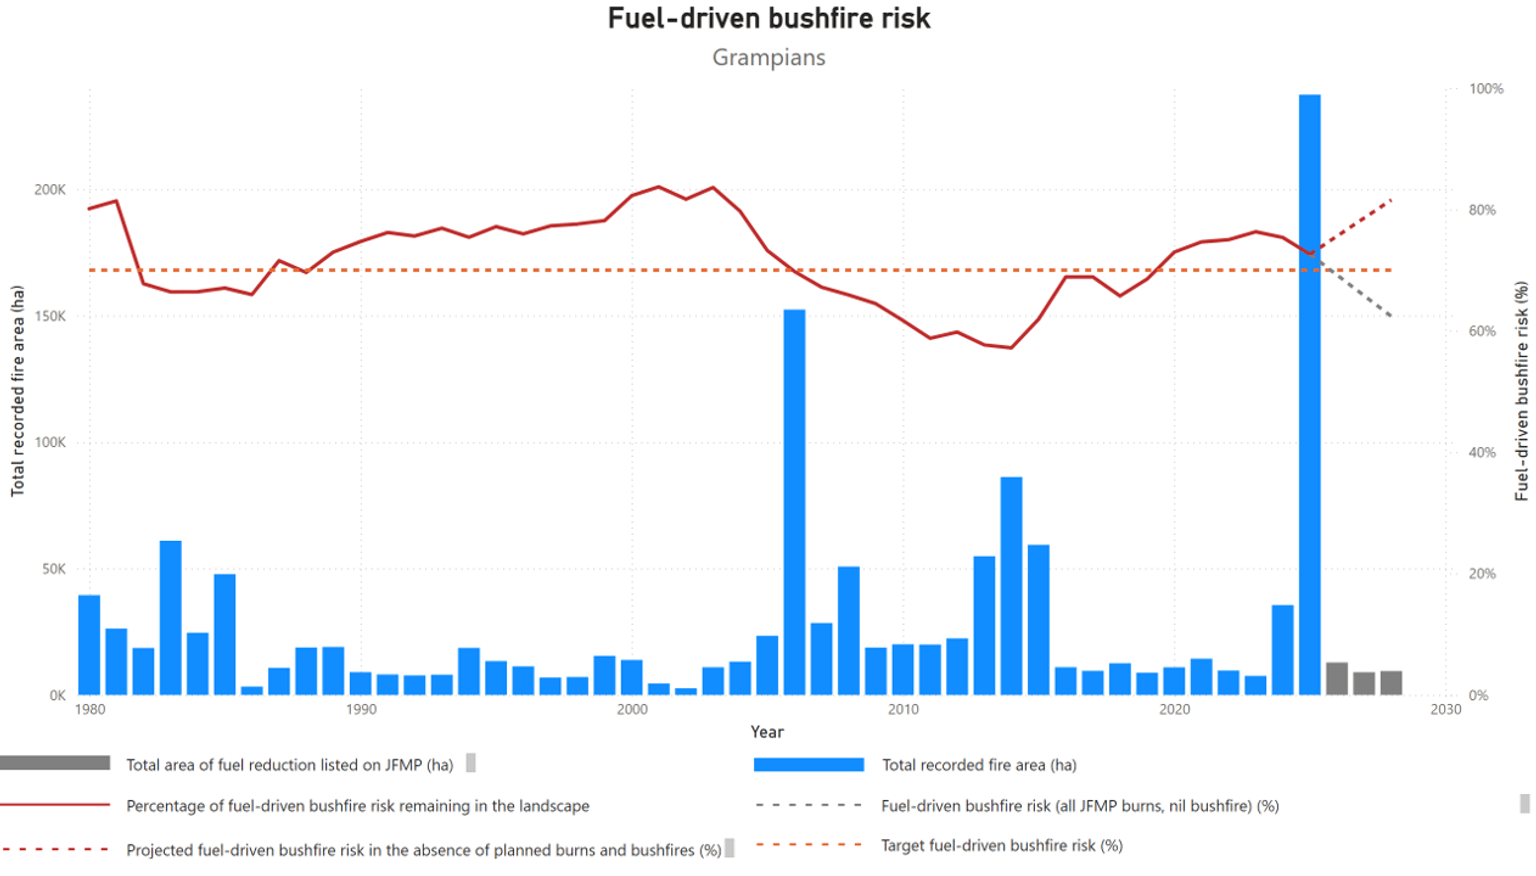
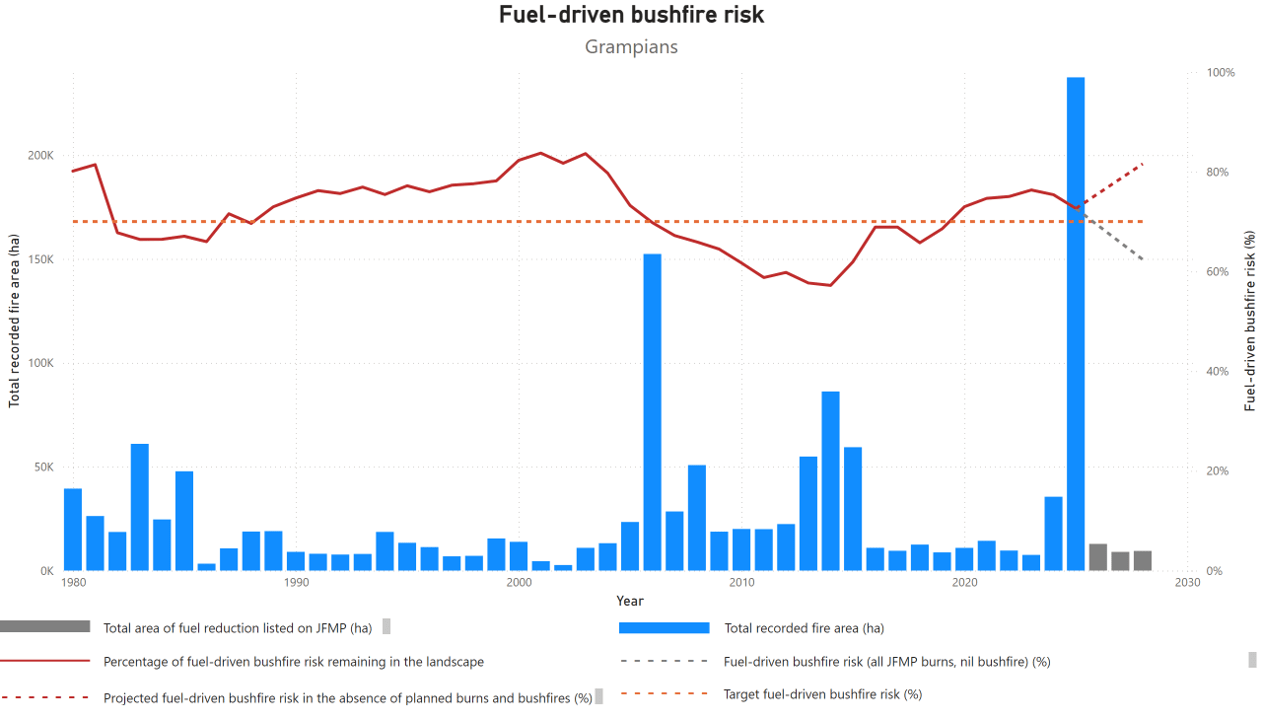
Fuel-driven bushfire risk within the Grampians region was 73% for this year, which remains above the regional target of 70%, but has decreased from 75% in 2023-24. Modelling indicates that without the fuel management program, this risk will continue to rise.
Delivery of the 2024-25 Grampians region fuel management program was again influenced by seasonal conditions and prolonged drought conditions. Across the region, rainfall was below average and temperatures were above average, which impacted the ability to safely deliver planned burns in spring.
Extreme dry conditions, coupled with several severe lightning storms, led to devastating bushfires which saw much of the Grampians (Gariwerd) and Little Desert National Parks impacted by fire between December 2024 and March 2025. While these areas have little impact on the fuel-driven bushfire risk in the Grampians region, these bushfires have had a significant effect on environmental and cultural values.
Involvement of staff and contractors in response to bushfires and subsequent recovery activities also impacted the delivery of planned burn and non-burning fuel treatment activities in both districts.
Extended settled weather in autumn 2025 assisted the Midlands district to deliver a sizeable planned burn program in high-risk areas, including the Wombat State Forest, the Lerderderg State Park and in the forests south-west of Ballarat. Removal of 2021 storm debris in the Wombat State Forest continued to reduce bushfire risk, improving safety and access for bushfire suppression across the broader forested landscape.
In April 2025, a planned burn at Old Tom Track near Daylesford breached its control lines and was investigated by OBRM. Recommendations from this investigation will contribute to the improvement of planning and delivery of fuel-reduction burns.
The Grampians region is expecting another high-risk bushfire season in 2025-26, which may impact fuel management program delivery.
Fuel management continues to focus on high-risk areas in the Wombat State Forest and in the forests south-west of Ballarat. Several burns are also planned in areas of the Wimmera district to protect communities and environmental assets which were not affected by 2024-25 bushfires.
Fuel management activities also include mulching and spraying of woody weeds in and around Hepburn Springs, Daylesford and Blackwood, where burning is difficult. Mulching in areas to the north and west of Ararat and Stawell is also aimed at reducing bushfire risk to these communities. Delivery of these non-burning fuel treatment activities is generally not limited by weather conditions.
Modelled fuel-driven bushfire risk – Hume region and districts
Table 26: Modelled fuel-driven bushfire risk – Hume region and districts
Indicator: Risk to life and property is reduced. (1.2.1) | Target | 2022-23 | 2023-24 | 2024-25 | 2024-25 result |
|---|---|---|---|---|---|
| Modelled fuel driven bushfire risk (%) |
|
|
|
|
|
| Hume Region | 69% | 71% | 70% | 69% | ✓ |
| Goulburn District | 75% | 73% | 70% | 73% | ✓ |
| Murrindindi District | 80% | 80% | 75% | 78% | ✓ |
| Ovens District | 55% | 65% | 67% | 62% | ⬛ |
| Upper Murray District | 60% | 42% | 49% | 51% | ✓ |
Figure 6: Hume’s fuel-driven bushfire risk from 1980-2025.
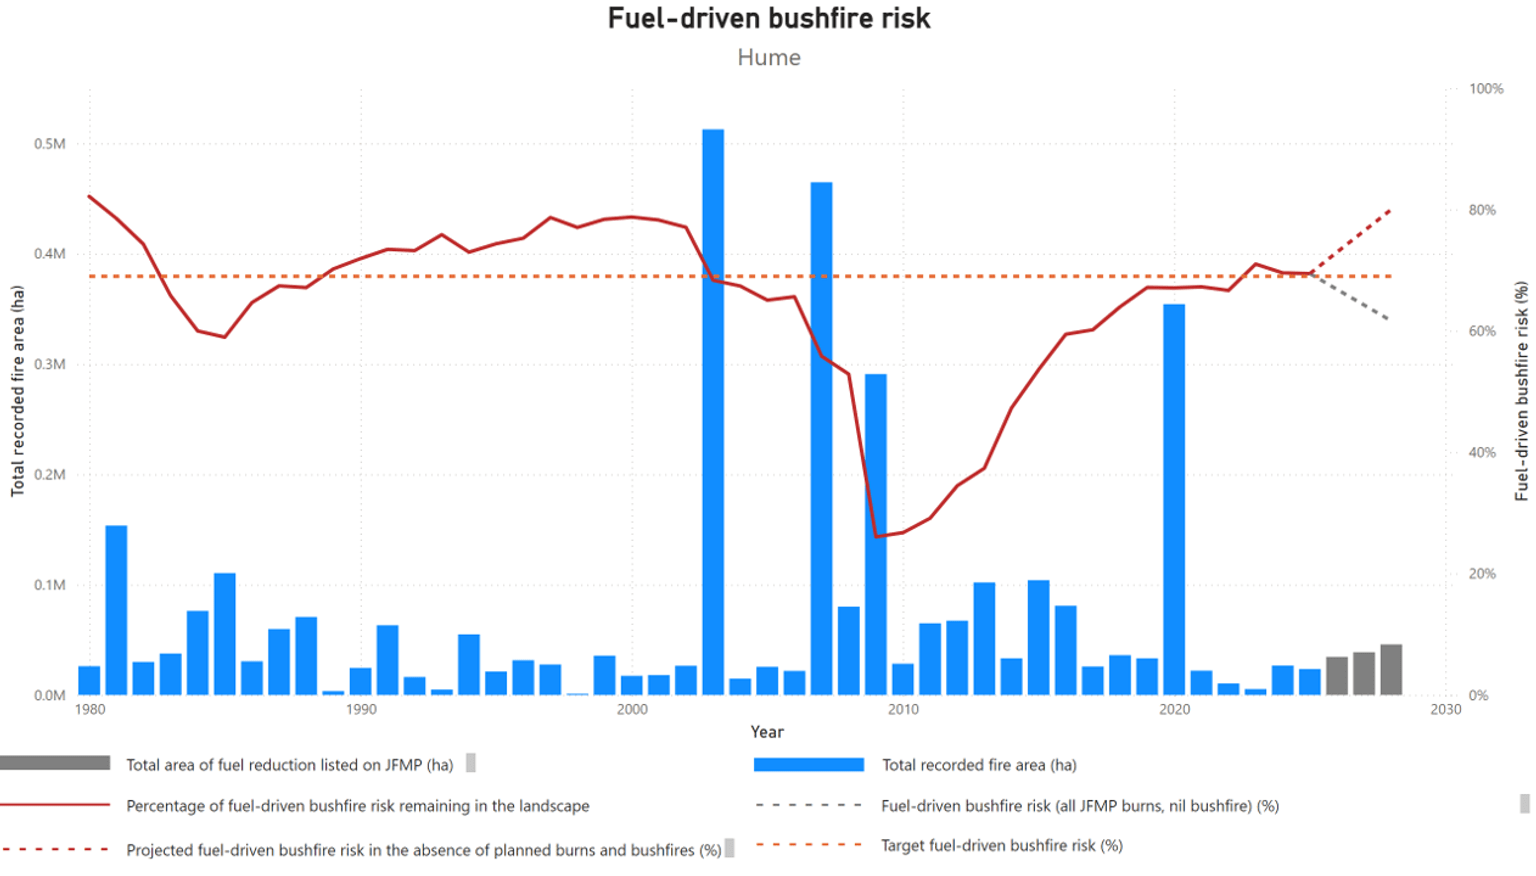
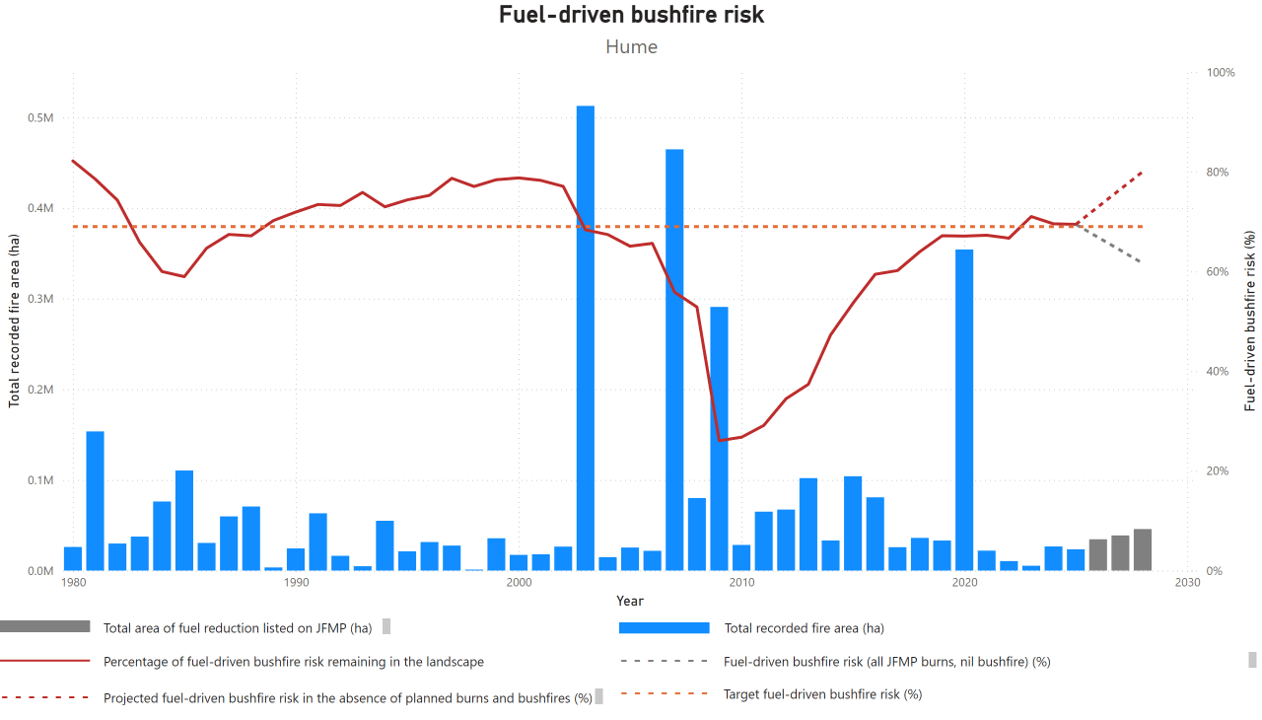
Fuel-driven bushfire risk within the Hume region was 69% for this year, achieving the region’s target of 69% and contributing to the State target of 70%. Fuel-driven bushfire risk was maintained below target levels in 3 of the region’s 4 fire districts. Burn delivery in the Goulburn, Murrindindi and Upper Murray districts has contributed to the maintenance of fuel-driven bushfire risk below their respective targets.
Delivery of the Hume region fuel management program was completed in June 2024. The 2024-25 fire season saw dry weather leading into summer, contributing to significant bushfires in Victoria’s west from 16 December 2024 to 6 January 2025. For these events, the Hume region provided suppression resources and support. Prolonged dry conditions continued throughout the season, with the Hume region’s largest bushfire at Boho in the Goulburn district, burning across the first week of March 2025. Conditions settled in late March, allowing planned burn delivery across all 4 districts from 25 March to 21 May.
The significant fire season of 2019-20 impacted over 330,000 ha of the Upper Murray and Ovens districts. This continues to contribute to substantially reduced fuel-driven bushfire risk levels in the Upper Murray district, beyond the effect of planned burning alone.
In the Ovens district, the fuel-driven bushfire risk has not been effected in the same way, due to the remoteness of those fires from population centres. Subsequent unfavourable conditions for planned burning during the autumns of 2022 and 2023 contributed to the rise in the district’s fuel-driven bushfire risk to 11% above target levels.
This season, the Ovens district’s autumn delivery program has successfully reduced risk levels from 66% to 62%. Although this remains above the district target of 55%, the reduction achieved in 2024-25 gives confidence that target levels can be re-established in the upcoming JFMP planning and delivery cycles.
The status of fuel-driven bushfire risk in the region indicates that the planning and implementation of burns is in line with Hume’s Bushfire Management Strategy (BMS). The BMS and updated Fuel Management Zones (FMZ) focus forest fuel reduction on public land, in areas impacting high-risk communities across the 4 fire districts. The BMS also identifies forested areas on private land near high-risk communities as focus areas for engagement and collaboration activities. Treatment of forest fuels in these areas complements risk reduction activities on public land.
The region and districts will continue to give priority to the fuel management program, except when responding to emergencies. This includes prioritising delivery resources for districts that are above or approaching their fuel-driven bushfire risk targets.
Modelled fuel-driven bushfire risk – Loddon Mallee region and districts
Table 27: Modelled fuel-driven bushfire risk – Loddon Mallee region and districts.
Indicator: Risk to life and property is reduced. (1.2.1) | Target | 2022-23 | 2023-24 | 2024-25 | 2024-25 result |
|---|---|---|---|---|---|
| Modelled fuel-driven bushfire risk (%) |
|
|
|
|
|
| Loddon Mallee Region | 75% | 74% | 72% | 71% | ✓ |
| Mallee District | 90% | 82% | 79% | 76% | ✓ |
| Murray Goldfields District | 75% | 74% | 72% | 71% | ✓ |
Figure 7: Loddon Mallee’s fuel-driven bushfire risk from 1980-2025.
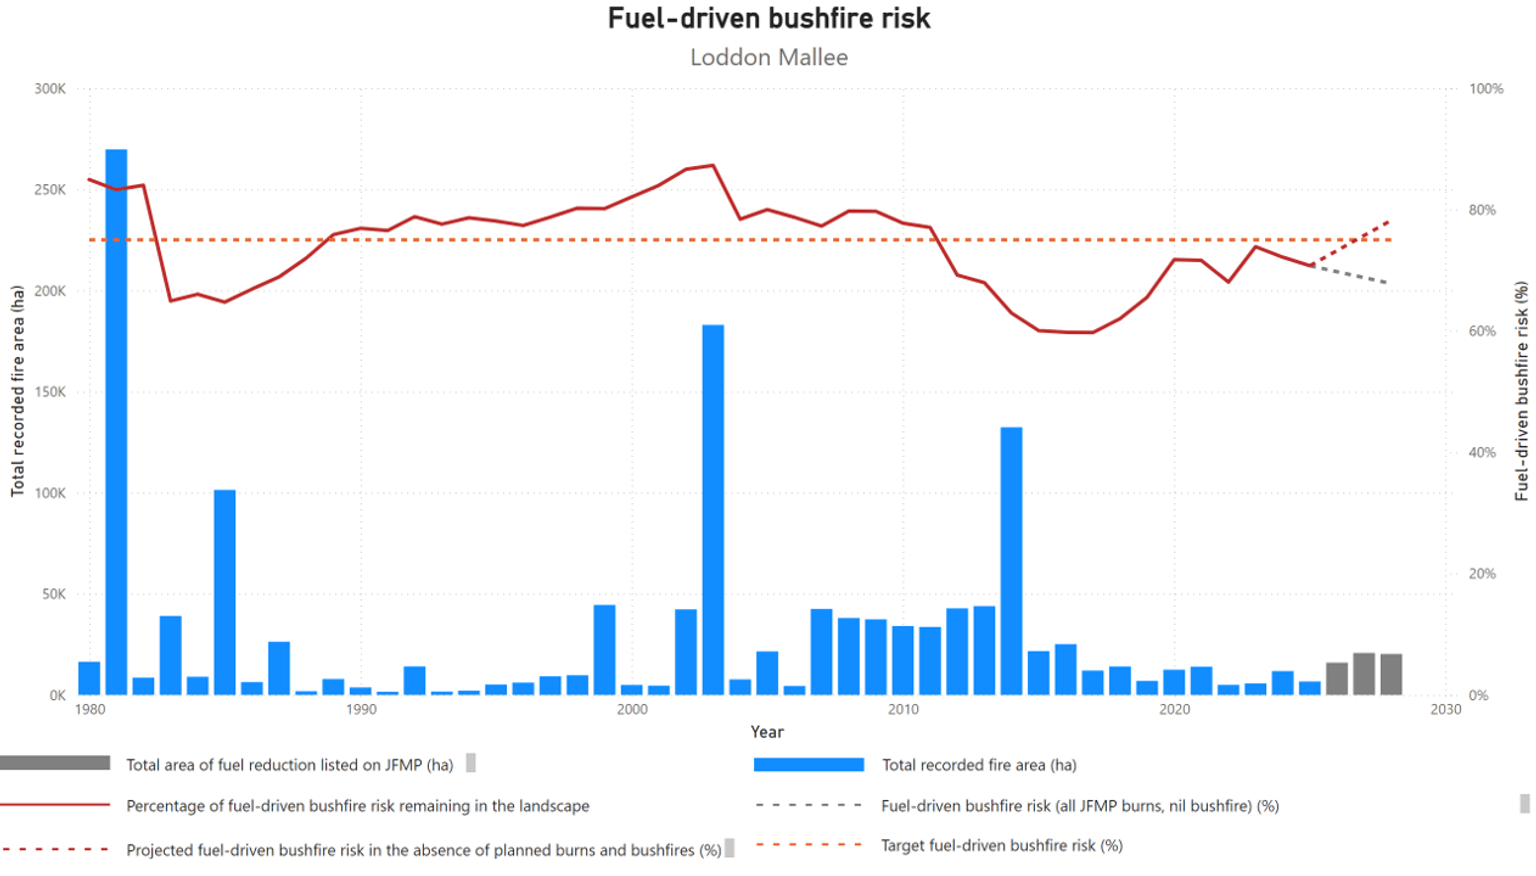
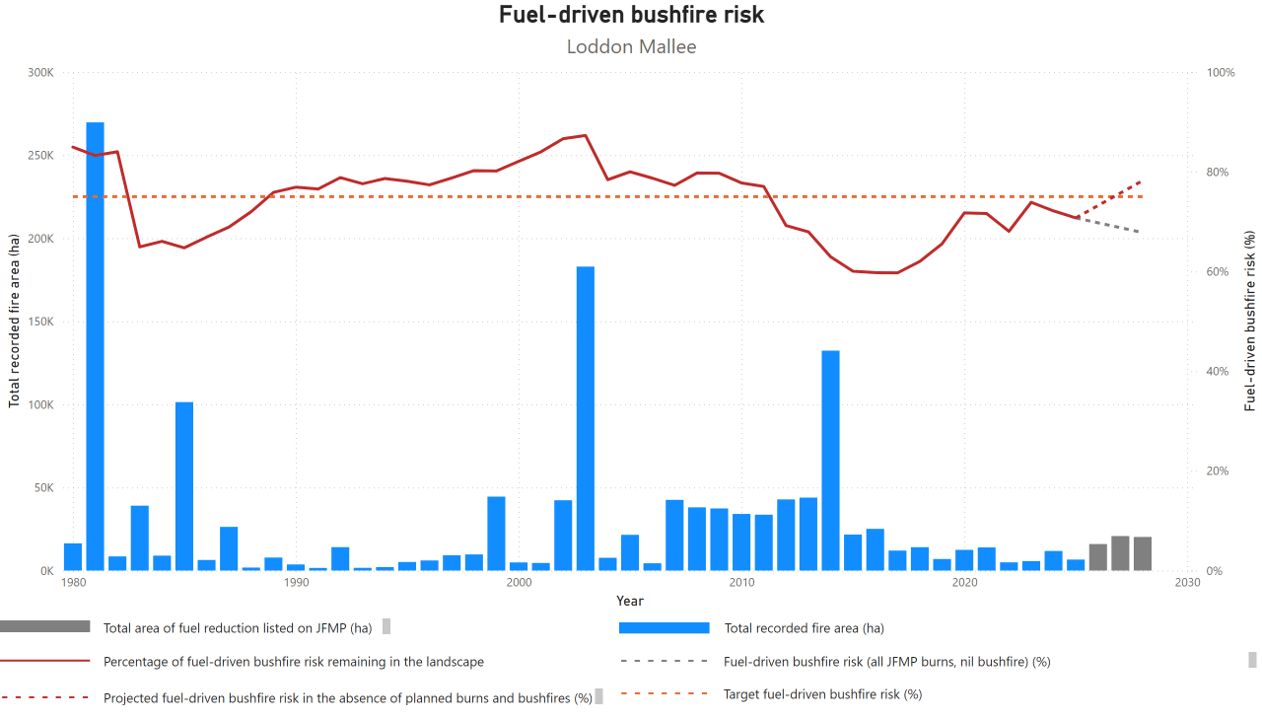
Fuel management programs in the Mallee district resulted in a modest risk reduction from 79% to 76%. While the Murray Goldfields district saw a stabilization of risk, it's crucial to note that without these treatments, risk would have likely increased significantly. The ongoing implementation of the JFMP is expected to drive substantial risk reductions, particularly in the Murray Goldfields district, over the next 3 years.
The Loddon Mallee region (LMR) successfully delivered a comprehensive planned burning program across the Murray Goldfields district, with unfavourable conditions limiting the delivery of the Mallee district’s program. The Murray Goldfields district delivered 25 fuel reduction burns, 3 Traditional Owner led burns and 2 fire investigation training burns, totalling 4,486ha for the year. The Mallee district completed 5 fuel reduction burns, and 2 Traditional Owner led burns, totalling 1,559ha.
This was achieved despite one of the longest dry spells on record, with conditions allowing large-scale bushfire moderation zone (BMZ) burning through to the end of May in the Pyrenees Ranges. FFMVic took advantage of favourable conditions in the Murray Goldfields, bringing some burns forward from years 2 and 3 in the JFMP. This decision was made as other planned burns around Bendigo and Castlemaine were not delivered, due to ongoing drought conditions and the risk of negative environmental impacts. There was also a known risk of intense fires in untreated forested areas, as seen in the Grampian regions where bushfires were difficult to control.
Despite challenging weather conditions, the Mallee district completed 2,140 ha of non-burn fuel treatments across 135 sites, while the Murray Goldfields district completed 1,968 ha of non-burn fuel treatment across 144 sites.
Much of this work was conducted directly adjacent to private property, reducing the risk to life and assets by mitigating the potential for exit fires.
The Murray Goldfields district, classified as elevated risk, prioritised burns in areas that would significantly reduce the risk of bushfires impacting local communities. Over 4,000 ha were treated during the autumn burn season. In the Pyrenees area favourable weather conditions allowed for the completion of 5 burns, scheduled to avoid the grape-growing season. The burn program focused on edge ignitions and some internal work using hand ignition and aerial drip torches. Resources from the Gippsland and Port Phillip regions were instrumental in the successful delivery of this large-scale program. The Pyrenees area located southwest of Avoca, shares similar terrain and fuels to the Mt Cole area in Midlands district, where the devastating Bayindeen fire in late February 2025 started.
This season, LMR partnered with Traditional Owners to deliver or build skills in their cultural fire programs. Weather conditions and an intensive fire season created some resourcing constraints that impacted on the ground support to Traditional Owners, although most groups were still able to deliver part of their program. This included Yorta Yorta conducting their first burn within the Murray Goldfields district at Wyuna, the First Peoples of the Millewa Mallee delivering their second burn at Merbein near Mildura and Djaara continued in their Djandak Wi program with delivery of 5 burns across Murray goldfields district. These programs develop staff capacity and provide opportunities to work more strategically on their burn program, supported by state cultural fire grants.
Modelled fuel-driven bushfire risk – Port Phillip region and districts
Table 28: Modelled fuel-driven bushfire risk – Port Phillip region and districts.
Indicator: Risk to life and property is reduced. (1.2.1) | Target | 2022-23 | 2023-24 | 2024-25 | 2024-25 result |
|---|---|---|---|---|---|
| Modelled fuel-driven bushfire risk (%) |
|
|
|
|
|
| Port Phillip Region | 85% | 89% | 87% | 87% | ◯ |
| Metropolitan District | 85% | 95% | 91% | 92% | ⬛ |
| Yarra District | 85% | 88% | 86% | 86% | ◯ |
Figure 8: Port Phillip’s fuel-driven bushfire risk from 1980-2025.
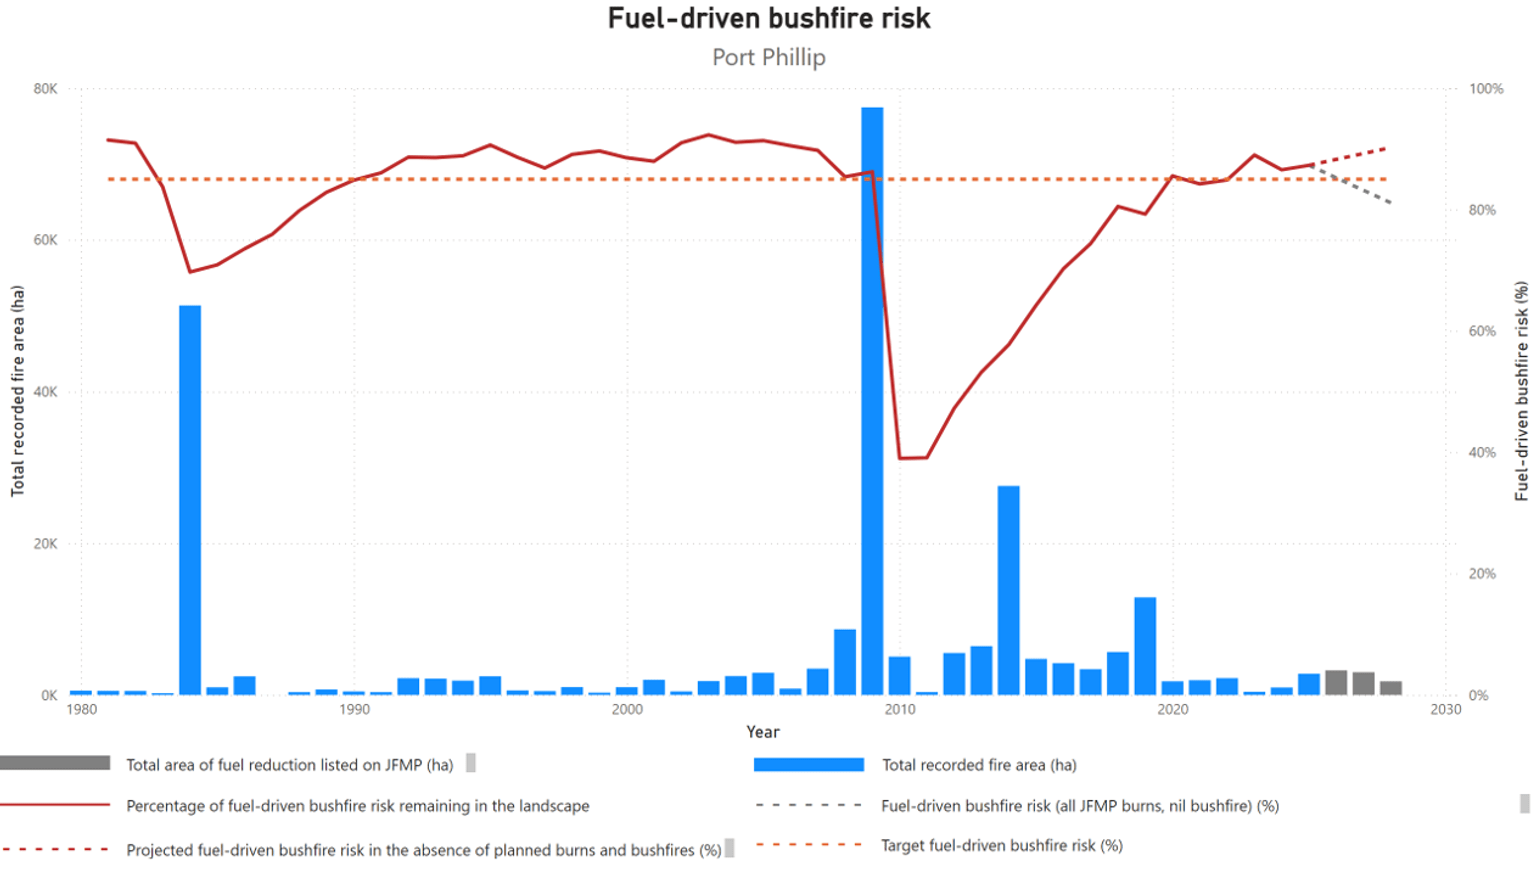
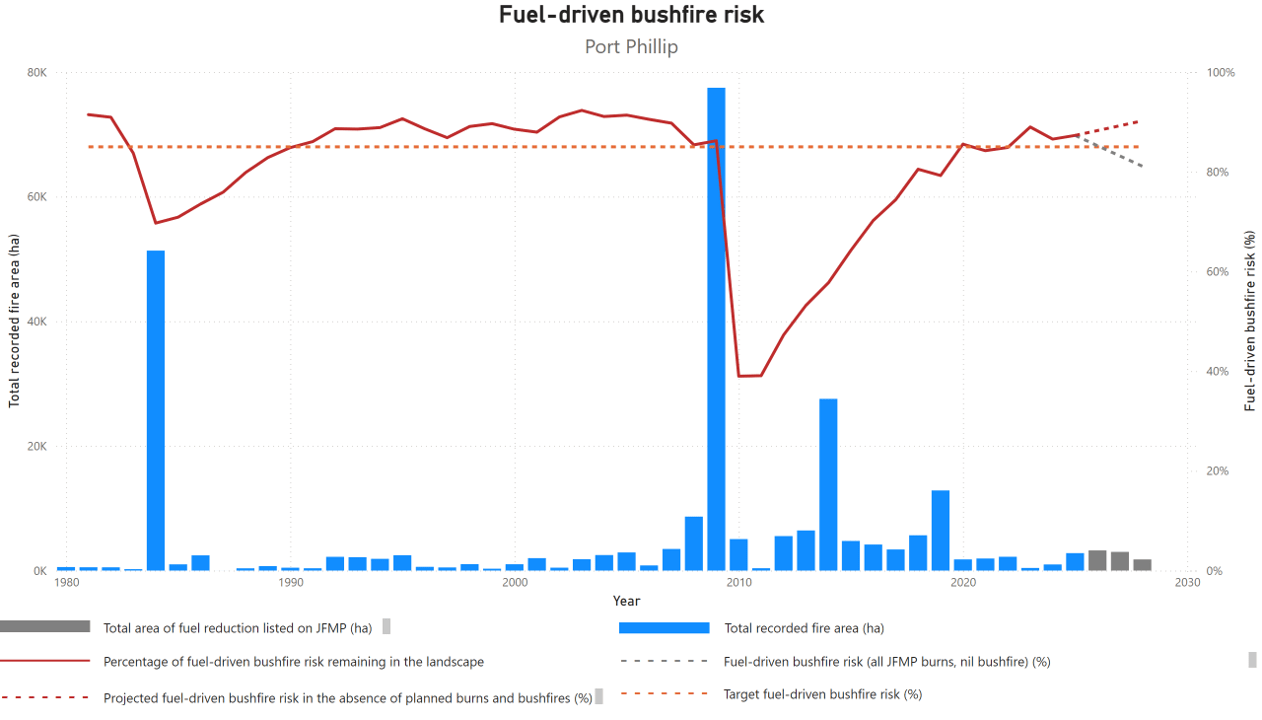
The delivery of last season’s JFMP was limited due to the prolonged fire season, which encroached on the start of the burn season. The region saw fires in Montrose in the middle of March, which is typically when planned burning starts. Extraordinarily dry conditions also impacted burn delivery, with a drought factor of 10 across the Port Phillip region and Keetch–Byram drought index (KBDI) values exceeding 100 for most of the autumn burn window.
This resulted in a later start to the planned burn season, meaning typically dryer forest such as Paul Range remained too dry to burn the entire season. Burning continued through until the middle of May, limited to areas with sufficient rainfall to combat the excessive underlying dryness (the Dandenong Ranges and Warburton Valley).
Table 29: Number of bushfires attended by FFMVic, Statewide and DEECA regions, 2022-23 to 2024-25.
Indicator: The impact of bushfires is minimised (e.g. fire size and time to control fire) (1.2.2) | Target | 2022-23 | 2023-24 | 2024-25 |
|---|---|---|---|---|
| Number of bushfires attended by FFMVic – Statewide |
| 838 | 1,179 | 1,371 |
| Barwon South West |
| 48 | 105 | 145 |
| Gippsland |
| 196 | 209 | 283 |
| Grampians |
| 86 | 168 | 179 |
| Hume |
| 320 | 357 | 407 |
| Loddon Mallee |
| 169 | 293 | 244 |
| Port Phillip |
| 19 | 47 | 113 |
FFMVic fuel management
Planned burn ignition opportunities
FFMVic considers when conditions are favourable to deliver planned burning safely and effectively and utilises appropriate burning windows to deliver the planned burning program. Most of the planned burning program continues to be delivered in autumn, when weather conditions are typically more stable, there is lower risk of extreme fire danger days, and the fuel conditions are appropriate to achieve the desired burn objective. Under these conditions, fire behaviour is generally more manageable and predictable.
During 2024-25 of the 467 burns planned to be delivered, 241 were scheduled for ignition at least once. There was no suitable scheduling opportunity identified for the remainder of the year 1 program due to weather, fuel conditions, response to emergency activities and other program constraints. In the Wimmera district, 20 burns were overrun by the Grampians and Little Desert bushfires before suitable opportunities for delivery.
On average, each scheduled burn was rescheduled 5 times across the year. 19 burns were scheduled over 10 times, and up to 24 times, demonstrating the amount of effort that is committed to finding the right opportunities to deliver burns within the constraints of things like weather and fuel conditions.
Table 30 provides a snapshot of FFMVic planned burn planning, scheduling and delivery, 2024-25.
Table 30: Snapshot of FFMVic planned burn planning, scheduling and delivery, Victoria, 2022-23 to 2024-25
| Target | 2022-23 | 2023-24 | 2024-25 | 2024-25 result | ||||
|---|---|---|---|---|---|---|---|---|
| Planned | 381 | 445 | 467 | |||||
| Scheduled | 335 | 386 |
| |||||
| Delivered | 234 | 316 | 234 | |||||
| Delivered on first scheduling |
| 20 | 59 | |||||
| Scheduled but not delivered | 101 | 79 | 7 | |||||
| Number of burns identified in the current year of JFMP (Year 1 burn) |
|
| 468 | |||||
| Number of burns identified in the current year of the JFMP ready for on ground delivery by 30 May. |
|
| 340 | |||||
Table 31: FFMVic Priority Burn identification and delivery, Victoria, 2022-23 to 2024-25
| Target | 2022-23 | 2023-24 | 2024-25 | 2024-25 result | |
|---|---|---|---|---|---|
| Priority Burns identified (of # of planned burns) |
| 166 | 215 | 145 / 468 | |
| Priority burns delivered |
| 76 | 138 | 66 | |
| Percent of priority burns delivered |
| 46%a | 64% | 46% |
Note(a): Number corrected from Victoria’s Bushfire Risk Management Report 2023-24.
FFMVic reschedules burns frequently to optimise burn delivery across the State. Burns can be scheduled up to nine days from planned ignition. Within four days of planned ignition, a reschedule reason is generally recorded. Beyond four days, no reason is recorded due to higher uncertainty and often multiple reasons for rescheduling.
In 37% of cases, burns were rescheduled beyond the four-day window and no reason was recorded. This is reported as ‘No reason given’ due to the impracticality of assigning a single cause at that stage.
Table 32 indicates the reasons scheduled burns were rescheduled between 2022-23 and 2024-25.
Table 32: Reasons the delivery of scheduled burns were rescheduled, Victoria, 2022-23 to 2024-25
| Reason | 2022-23 | 2023-24 | 2024-25 | |||
|---|---|---|---|---|---|---|
| Number of occurrences | Proportion of instances (%) | Number of occurrences | Proportion of instances (%) | Number of occurrences | Proportion of instances (%) | |
| Burns rescheduled 5-9 days out from planned ignition |
|
|
|
|
|
|
| No reason given | 589 | 50% | 1,072 | 58.9% | 310 | 37% |
| Burns rescheduled within 4 days of planned ignition |
|
|
|
|
|
|
| Fuel Moisture | 333 | 18.9% | 320 | 17.6% | 259 | 26.2% |
| Weather | 287 | 24.4% | 285 | 15.7% | 220 | 22.2% |
| Resourcing | 32 | 2.7% | 110 | 6.0% | 108 | 10.9% |
| Risk | 12 | 1% | 10 | 0.6% | 17 | 1.7% |
| Priority | 3 | 0.3% | 14 | 0.8% | 11 | 1.1% |
| Community Impacts | - | - | 6 | 0.3% | 8 | 0.8% |
| Funding | - | - | 2 | 0.1% | 0 | 0% |
| Miscellaneous | 29 | 2.5% | - | - | - | - |
| Smoke | 1 | 0.1% | - | - | - | - |
| Tourism | 1 | 0.1% | - | - | - | - |
Insights about the reasons why some burns were not ignited can be gained from the Burn Opportunity Reporting Tool (BORT).
In 2021, FFMVic released the prototype BORT to track ignition opportunities on a day-by-day basis and assess whether weather conditions provided an opportunity to ignite each burn as originally planned. The tool is partly automated and requires some manual review for accuracy. Table 33 indicates the reasons why planned burns were not ignited as recorded in BORT.
Table 33: Factors influencing the delivery of planned burns using the Burn Opportunity Reporting Tool (BORT), Victoria, 2022-23 to 2024-25
| Factors influencing delivery | Target | 2022-23 | 2023-24 | 2024-25 |
|---|---|---|---|---|
| Weather conditions not suitable | 64% | 57.5% | 52.5 % | |
| Weather prescription window occurred prior to completion of burn planning or preparation | 24% | 14.3% | 30.3 % | |
| Possible missed opportunity | 5.4% | 8.5% | 8.6 % | |
| Fuel conditions not suitable | 6% | 8.0% | 5.4 % | |
| Undefined | 0% | 7.4% | % | |
| Operation risk too high | 0.3% | 2.7% | 0.1% | |
| Bushfires and other emergencies | 0% | 0.8% | 2.7 % | |
| Other | 0.04% | 0.4% | 0.4 % | |
| Resource availability during peak delivery period | 0.04% | 0.3% | 0.2 % | |
| Community Impact | 0.1 % | |||
| Financial considerations | 0.2% | 0.1% |
Data and model output improvements
The best available evidence-based models and data are used to calculate the results presented in this report each year. Models for metrics, such as fuel-driven bushfire risk or reported costs, are regularly updated as technology improves, better data becomes available, research programs provide new knowledge or mapping accuracy improves. Modelling and data improvements can cause information reported in previous years reports to change. For example, improved fire history and severity mapping may result in a recalculation of fuel-driven bushfire risk in a particular region.
Despite the data and model improvements described above, limitations to the modelling remain. For example, the current method for calculating fuel-driven bushfire risk can only consider fuel reductions that occur due to planned burning or bushfire. This means that the method cannot account for the risk reduction benefits of the broader fuel management program, such as mechanical fuel reduction and smaller treatments like roadside vegetation management. Further, the calculation does not currently account for bushfire risk management activities beyond fuel management, such as reducing potential sources of ignitions, or increasing the success of fire suppression. Lastly, the fuel-driven bushfire risk metric is currently limited to expressing risk reduction to human life and property, and not the full spectrum of values that may be impacted by bushfire.
Improving the data and science behind decisions happens continuously and is reflected through updates to reporting. Consequently, direct comparisons between this report and past or future reports cannot necessarily be made. For the most accurate view of current and historic figures, always consult the most recent report.
Updated