

Net movement of workers by industry
An analysis of job mobility by industry considers the proportion of employed Victorians in each industry who changed jobs. Another aspect of job mobility per industry is the proportion of workers entering and leaving that industry over a 12 month period. The difference in these proportions is the net movement of workers, which represents whether an industry is a net importer of workers (that is, they are gaining workers due to job mobility) or net exporter of workers (that is, they are losing workers due to job mobility).
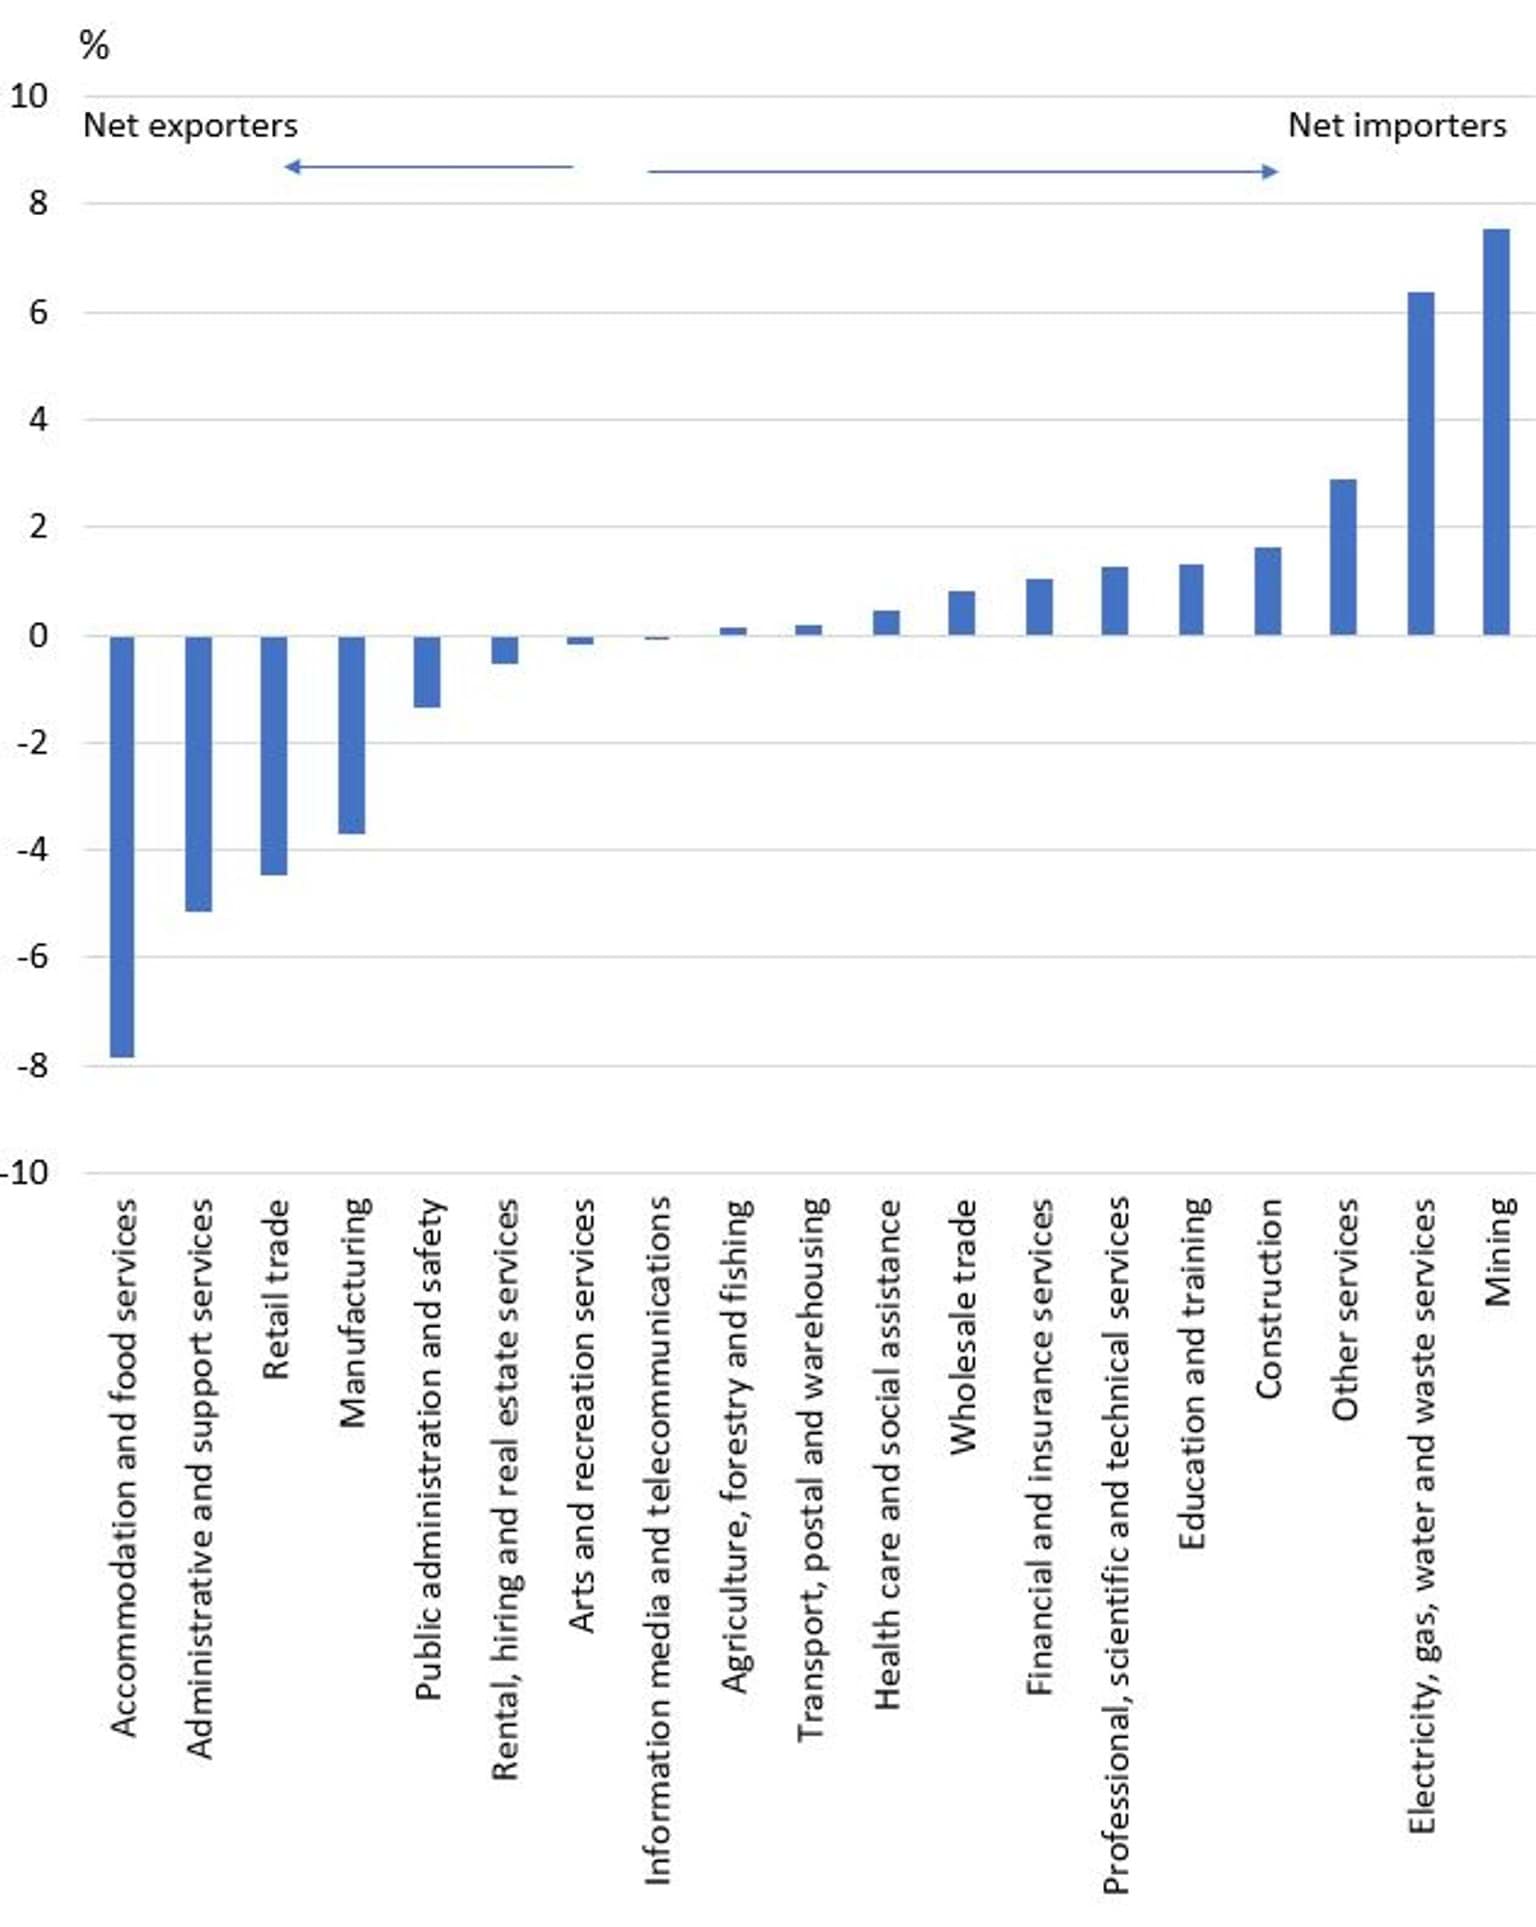
Mining and electricity, gas, water and waste services were the largest net importers of workers. In contrast, accommodation and food services, administrative and support services, and retail trade were the largest net exporters of workers (Figure 4.7).
Figure 4.7: Net movement of workers by industry, Victoria (over the year to February 2023)
Net importers and exporters by industry and years
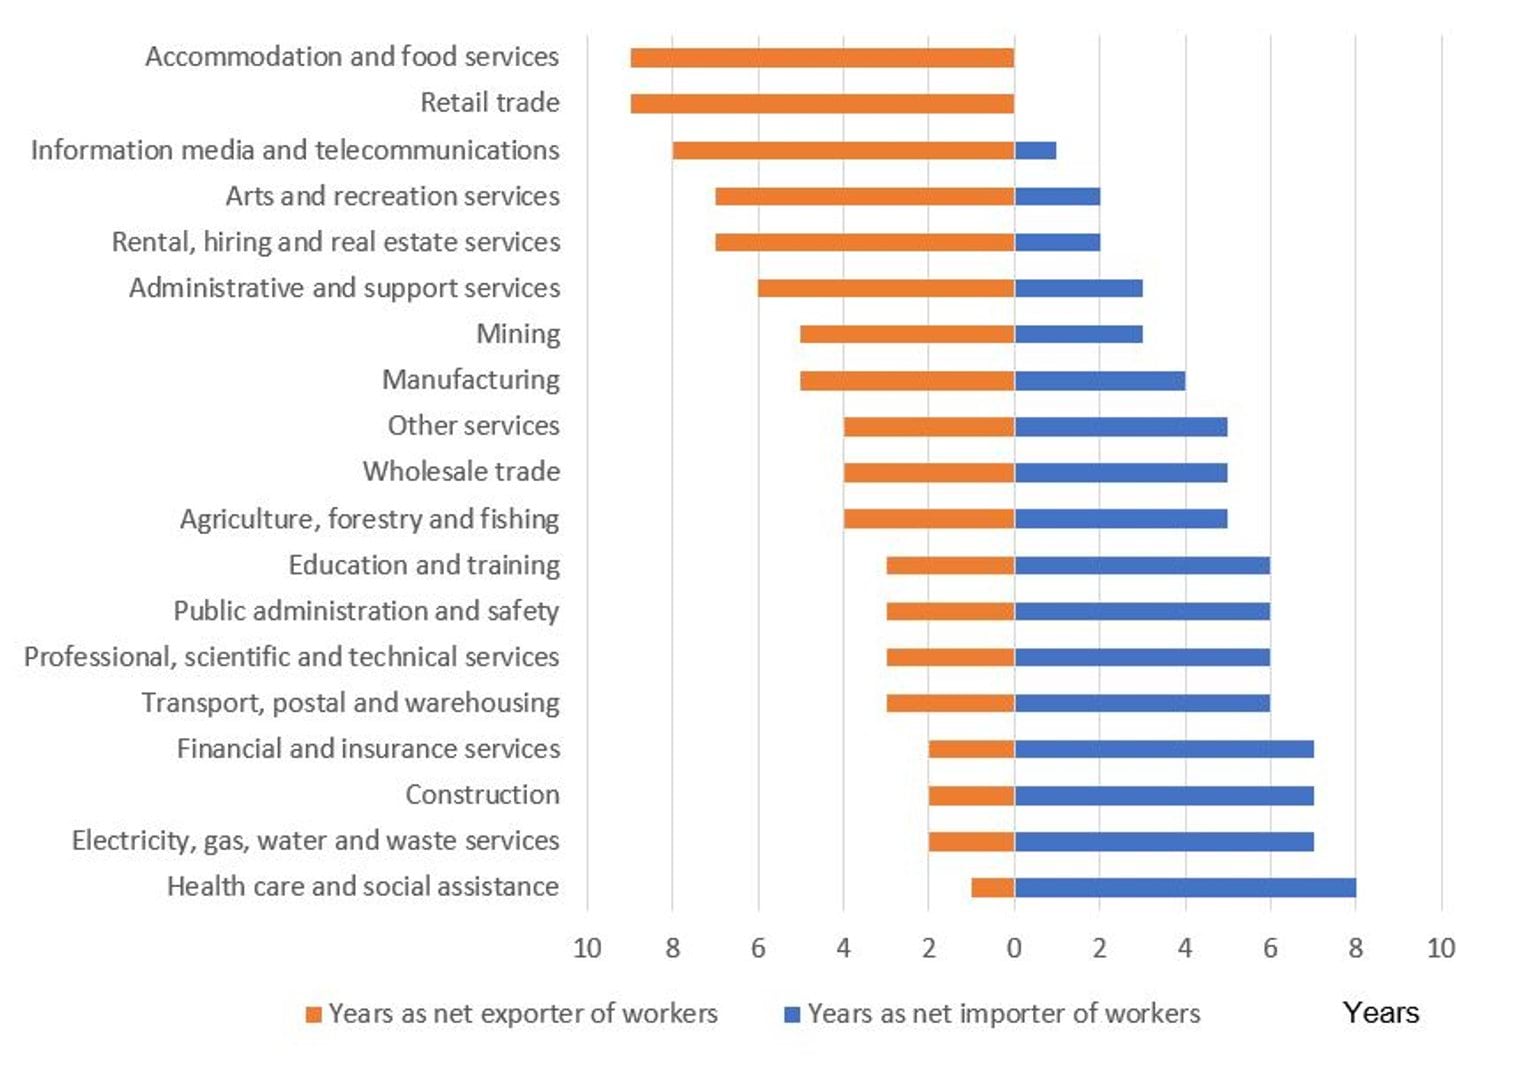
As these trends can be volatile, Figure 4.8 shows the number of years that an industry was a net importer and net exporter since 2015. Health care and social assistance, electricity, gas, water and waste services, construction, and financial and insurance services had the highest number of years as a net importer of workers. These industries benefited the most from workers changing jobs over the period.
In contrast, accommodation and food services and retail trade were net exporters of workers for the whole period. These industries lost workers due to job mobility every year since 2015, and acted as a stepping stone for workers to transition to jobs in other industries.
Figure 4.8: Number of years an industry was a net importer or exporter of workers (since 2015) Victoria
Updated