

- Date:
- 24 Oct 2023
Key points
The Victorian labour market is strong
- Around 3.6 million people are employed in Victoria, up 754,800 people over the past decade. The unemployment rate remains very low at 3.7% while the participation rate of 67.6% is near record highs.
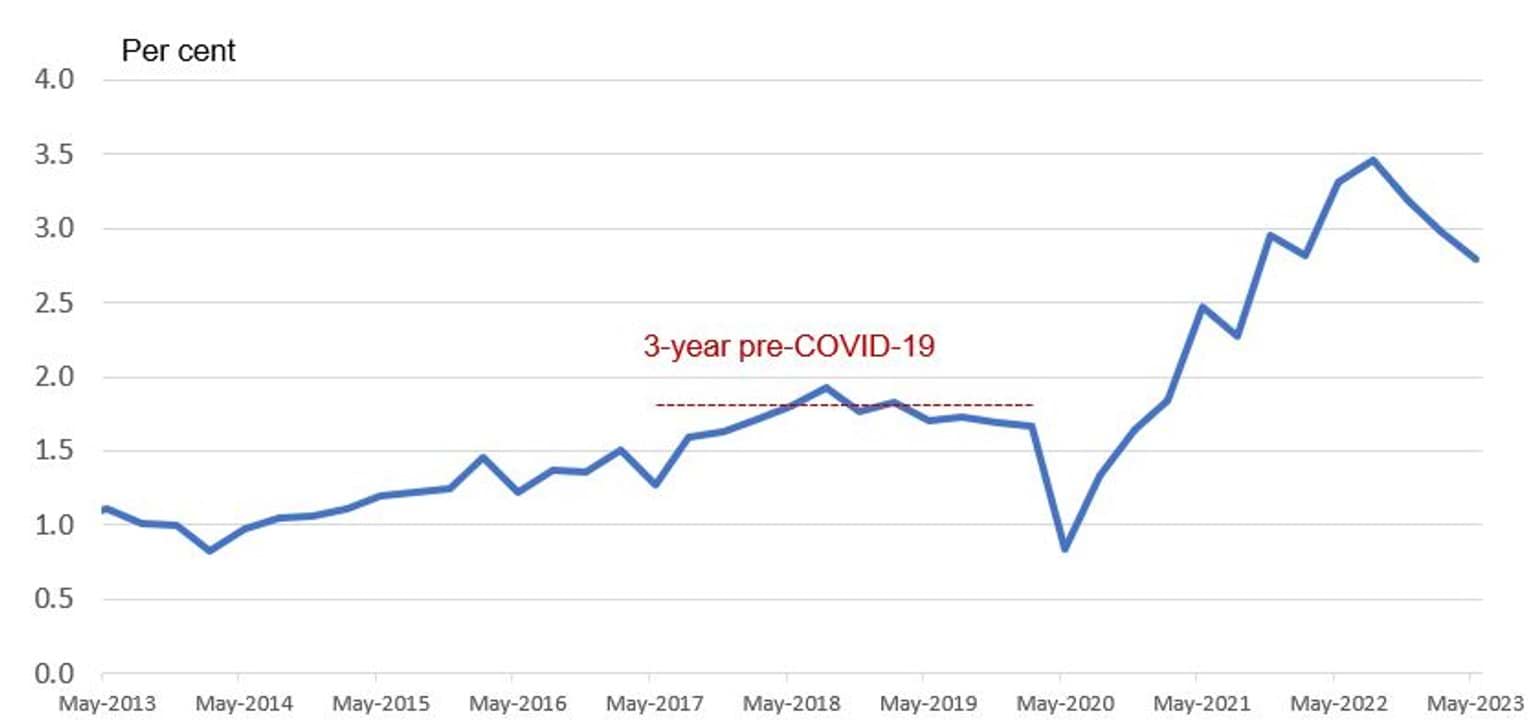
- Workforce shortages have eased from a peak but remain elevated. The job vacancy rate in Victoria was at 2.8% in May 2023, which is below the historical high of 3.5% in August 2022 but remains well above the three-year pre-COVID average of 1.7%. There are currently 1.3 unemployed persons for each job vacancy.
More than 350,000 new workers are expected in Victoria by 2026
- An estimated 352,000 new workers are expected by 2026 to meet demand from 137,000 new jobs and replace 215,000 retiring workers.
- Metropolitan Melbourne will account for 277,000 new workers while regional Victoria will account for 75,000 new workers.
- Around 64% of new workers will require higher-order skills, with most industries requiring new workers with higher-order skills.
- By industry, health care and social assistance, education and training, professional, scientific and technical services, and accommodation and food services will account for more than half of the 352,000 new workers expected over the next three years.
- By occupation, ageing and disability carers, general clerks, and registered nurses will account for the highest number of new workers expected over the next three years.
Influences on the Victorian labour market
- The number of new workers expected over the next three years is driven by the economic outlook, which has softened due to rising interest rates, higher cost of living, and a weaker global economic outlook.
- Workforce supply continues to be affected by issues such as the ageing population.
A few ideas to help us meet the demand for new workers
- The skilling and government response needed to help meet the demand for new workers is discussed in the Victorian Skills Plan for 2023 into 2024(opens in a new window). Further to what is covered in the plan, improved productivity, participation in education and employment and labour mobility will help Victoria meet its employment needs.
- Productivity growth can be driven by strengthening education and training, which will also alleviate skills shortages in the labour market. While labour productivity growth in Victoria has been slightly above the national average in recent years, opportunities for further increases exist by supporting businesses to innovate through adopting new business models, practices, and technology. Innovation will also drive new business activity and create new demand for different and higher-level skills due to the rapid technological change. Skill requirements increase as technology can replace more routine tasks, freeing up workers to focus on higher-skill activities.
- Despite the strong labour market, not all Victorians have been able to share the benefits of participating in the labour force and securing employment. There are currently around 498,000 potential workers in Victoria, including 139,600 individuals who are defined as unemployed. This means that there are approximately an additional 358,400 Victorians (of whom 204,100 can start work within 4 weeks) who can potentially contribute to the labour force and help address the significant labour and skills shortages. However, these individuals are not actively looking for work for reasons such as study commitments and caring responsibilities.
- Labour market mobility helps workers move to where new jobs are available and assists the economy to adjust to economic shocks and structural change.
The Victorian labour market remains strong
Around 3.6 million people are employed in Victoria, increasing by 754,800 over the past decade. While metropolitan Melbourne accounts for around three-quarters of employment in Victoria, the regional share of employment has increased slightly over the same period.1
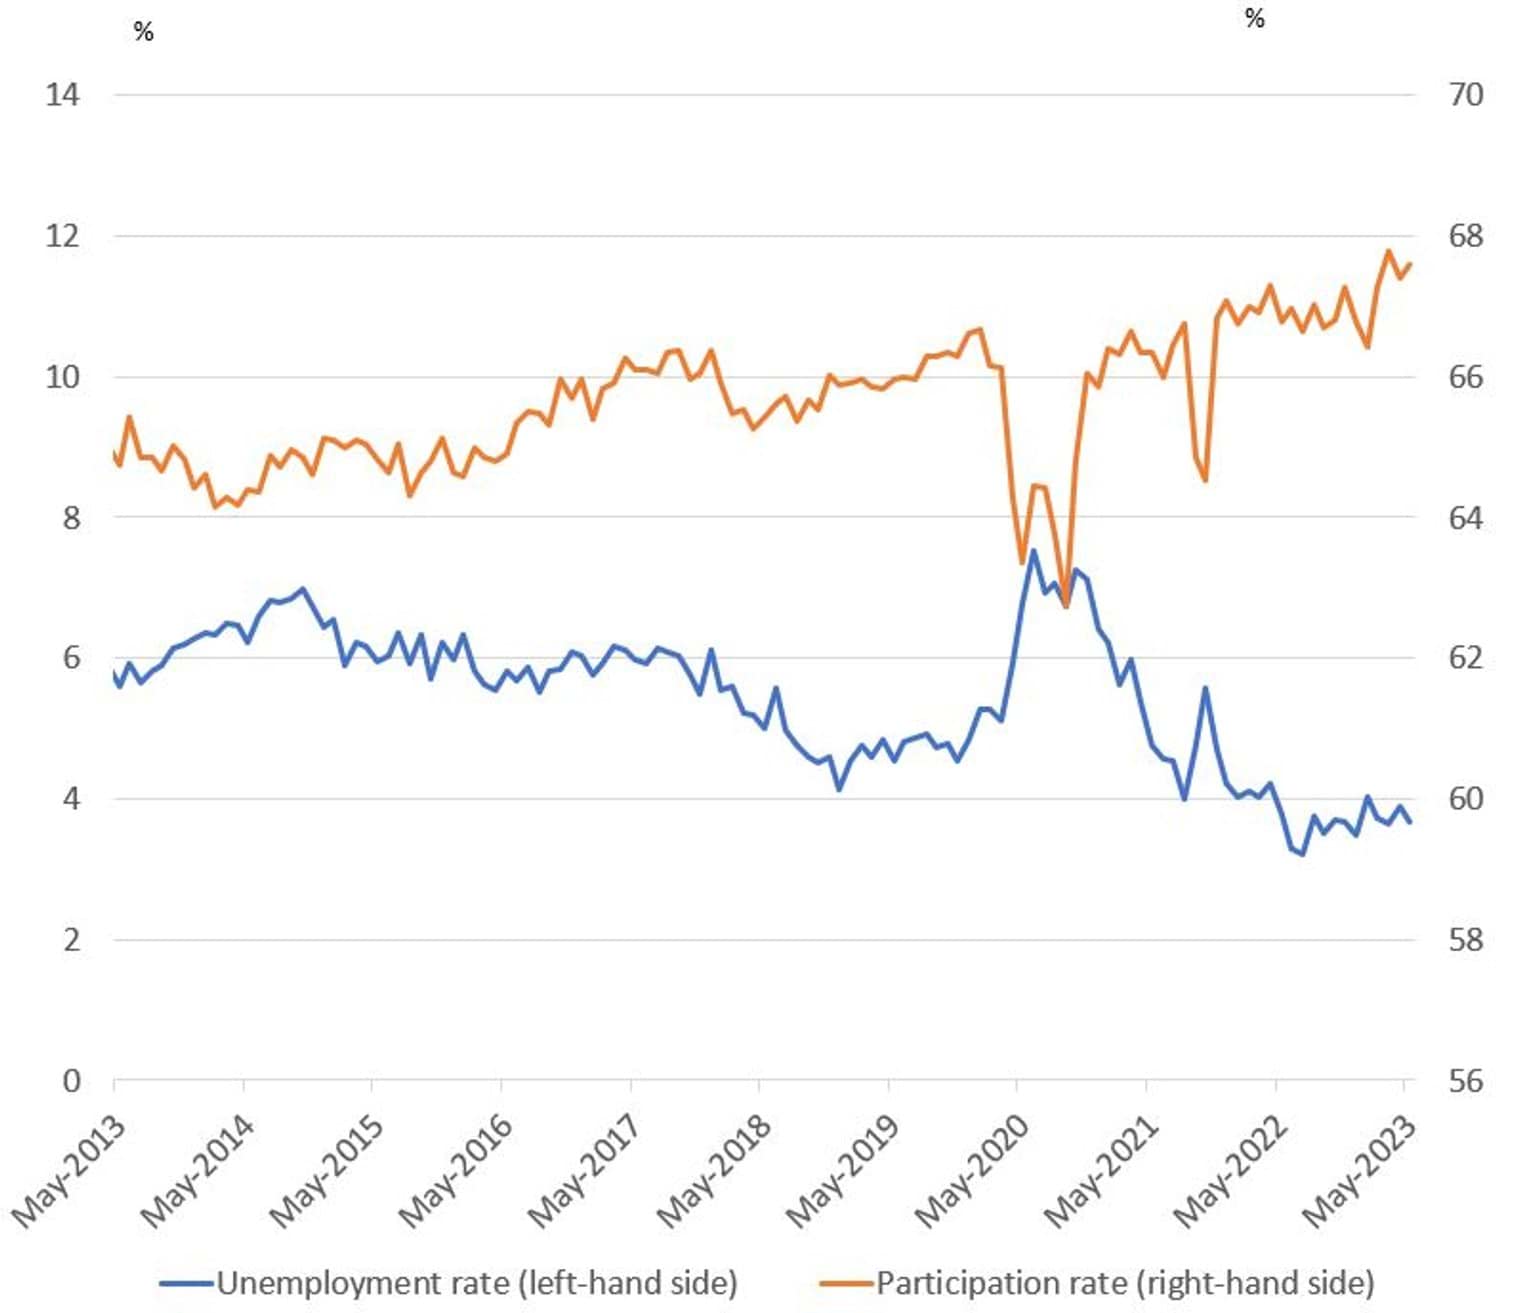
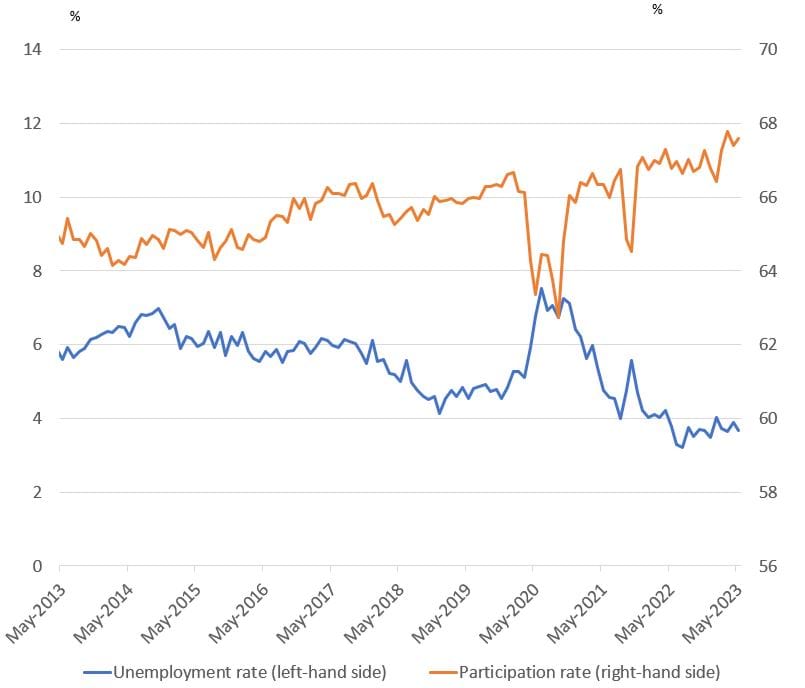
The proportion of people employed or actively looking for employment – the labour force participation rate – is near record highs. The unemployment rate is very low.
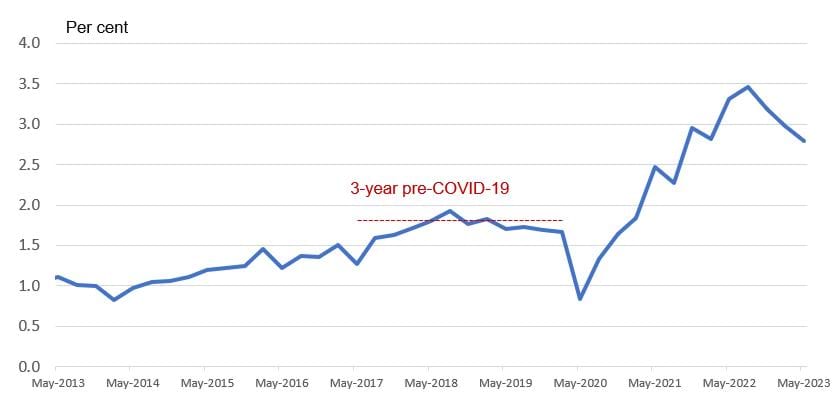
Over the decade, the participation rate increased by 2.8 percentage points (from 64.8% to 67.6%), while the unemployment rate declined by 1.9 percentage points (from 5.6% to 3.7%) (Figure 1.1).2
Figure 1.1: Participation and unemployment rates Victoria (May 2013 to May 2023)
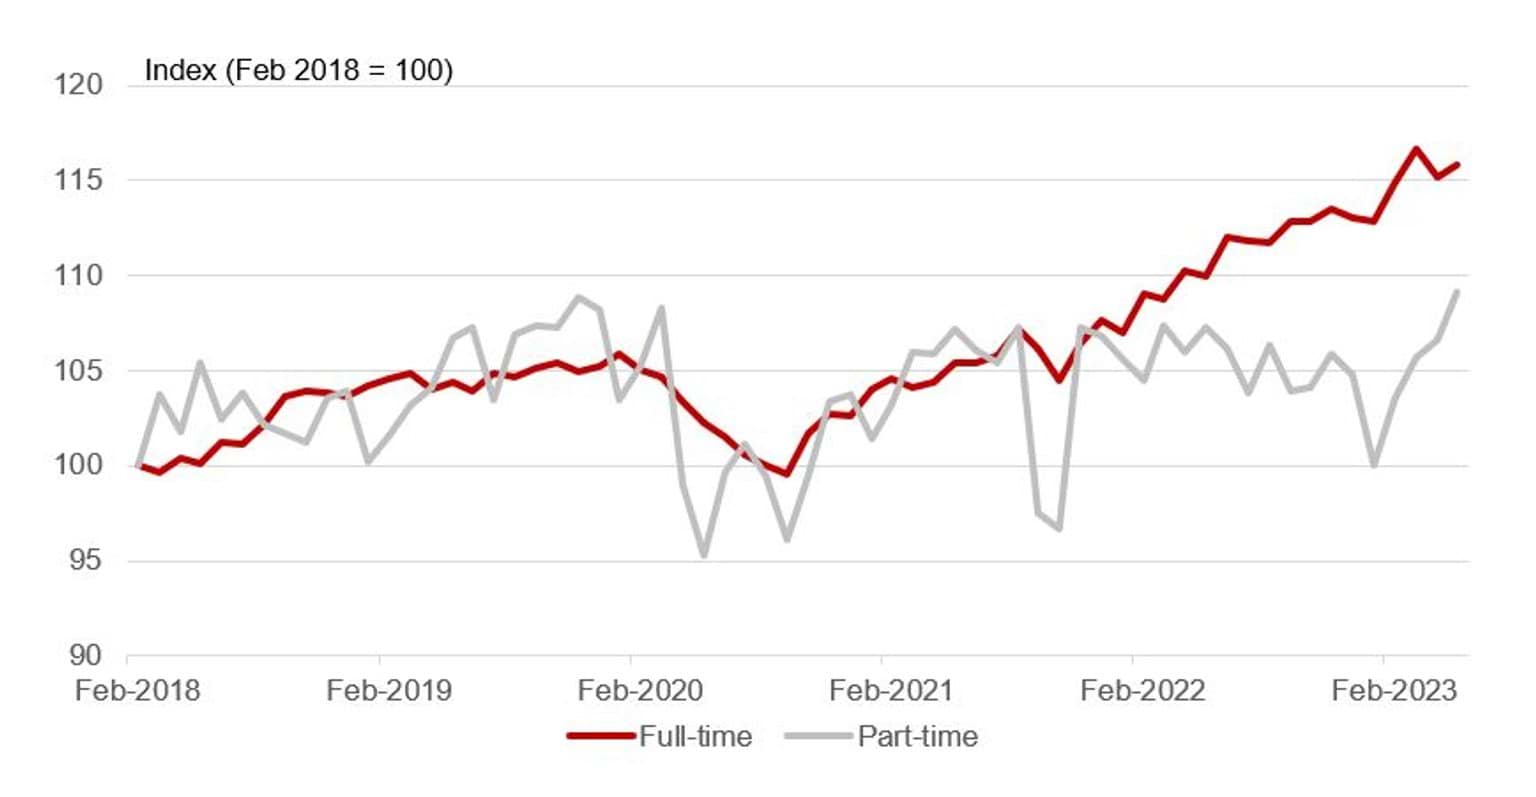
Strong employment growth since the COVID-19 pandemic has seen a significant shift towards full-time employment and permanent work.3
Currently, 69.0% of Victorian workers are engaged in full-time work, an increase of 2.0 percentage points since June 2019 (Figure 1.2).4 The proportion of employed individuals with paid leave entitlements has also increased since 2019, rising from 77.0% to 78.8%, indicating some growth in permanent employment.5
Figure 1.2: Full-time and part-time employment Victoria (February 2018 to May 2023)
Notes
1 Australian Bureau of Statistics, Labour Force, Australia, Detailed, May 2023.
2 Australian Bureau of Statistics Labour Force, Australia, May 2023.
3 Full-time employment and permanent employment are not necessarily the same, as there are people that are employed full-time on a casual basis.
4 Australian Bureau of Statistics Labour Force, Australia, May 2023.
5 Australian Bureau of Statistics, Working arrangements, August 2022.
Proportion of total employment by industry
Employment is concentrated in industries that service households, accounting for over one-third of total employment in Victoria.
Health care and social assistance, professional, scientific and technical services, retail trade, construction, and education and training were the largest industries, accounting for 53.9% of total employment (Table 1.1). This has remained relatively constant over the past two years.
Table 1.1: Proportion of total employment by industry Victoria (May 2023)
| Sector | Percentage | Industry | Percentage |
| Household services | 35.4% | Health care and social assistance | 15.4% |
| Household services | n/a | Education and training | 8.1% |
| Household services | n/a | Accommodation and food services | 6.4% |
| Household services | n/a | Other services | 3.6%
|
| Household services | n/a | Arts and recreation services | 2.0% |
| Business services | 20.7% | Professional, scientific and technical services | 10.9% |
| Business services | n/a | Financial and insurance services | 4.2% |
| Business services | n/a | Administrative and support services | 2.6% |
| Business services | n/a | Information media and telecommunications | 1.6% |
| Business services | n/a | Rental, hiring and real estate services | 1.4% |
| Goods production | 21.3% | Construction | 9.7% |
| Goods production | n/a | Manufacturing | 7.9% |
| Goods production | n/a | Agriculture, forestry and fishing | 2.2% |
| Goods production | n/a | Electricity, gas, water and waste services | 1.2% |
| Goods production | n/a | Mining | 0.3% |
| Other | 17.6% | Public administration and safety | 5.0% |
Note: the Victorian Skills Authority defined these sectors.
Source: Australian Bureau of Statistics (ABS), Labour Force, Australia, Detailed, May 2023.
Change in employment by industry
Since May 2013, employment increased the most in health care and social assistance (211,500 employed people), professional, scientific and technical services (153,700) and construction (117,800), both in absolute numbers and percentage growth. These industries also grew the most in Australia, although growth in percentage terms was higher in Victoria (Table 1.2).
Table 1.2: Change in employment by industry, Victoria and Australia (May 2013 to May 2023)
| Industry | Victoria change | Percentage | Australia change | Percentage |
| Health care and social assistance | 211,500 | 60.3% | 784,000 | 57.2% |
| Professional, scientific and technical services | 153,700 | 62.8% | 420,700 | 46.3% |
| Construction | 117,800 | 49.6% | 344,600 | 35.2% |
| Education and training | 61,200 | 26.1% | 276,800 | 30.8% |
| Retail trade | 56,700 | 18.8% | 65,500 | 5.3% |
| Transport, postal and warehousing | 41,700 | 29.0% | 129,800 | 22.1% |
| Accommodation and food services | 41,500 | 21.7% | 150,700 | 18.9% |
| Public administration and safety | 38,200 | 26.4% | 180,300 | 24.6% |
| Financial and insurance services | 32,600 | 27.0% | 121,600 | 29.0% |
| Other services | 23,000 | 21.5% | 72,900 | 16.1% |
| Electricity, gas, water and waste services | 9,900 | 28.9% | 7,600 | 5.2% |
| Agriculture, forestry and fishing | 9,400 | 13.0% | 10,500 | 3.6% |
| Arts and recreation services | 4,600 | 6.8% | 25,700 | 11.5% |
| Rental, hiring and real estate services | 4,400 | 9.4% | 20,100 | 10.5% |
| Manufacturing | 400 | 0.2% | -3,400 | -0.4% |
| Information media and telecommunications | -500 | -0.8% | -24,700 | -11.5% |
| Administrative and support services | -4,400 | -4.5% | 10,800 | 2.8% |
| Mining | -8,100 | -44.3% | 47,200 | 18.2% |
| Wholesale trade | -23,700 | -19.6% | -47,600 | -11.1% |
All industries | 770,000 | 26.7% | 2,598,000 | 22.7% |
Note: data are seasonally adjusted for Australia. As seasonally adjusted data are not available for Victoria, original data are presented.
Source: Australian Bureau of Statistics (ABS), Labour Force, Australia, Detailed, May 2023.
Workforce shortages
Workforce shortages in Victoria have eased slightly from their peak but remain elevated. In May 2023, the job vacancy rate in Victoria was 2.8% (or 105, 100 job vacancies). This is below the historical high of 3.5% in August 2022 but above the three-year pre-COVID-19 average of 1.7% (Figure 1.3).6
The increase in the job vacancy rate since mid-2020 coincided with a sharp increase in the proportion of employers who were seeking to fill jobs but faced recruitment difficulties, which increased from 33% to 65% between September 2020 and March 2023.7
Figure 1.3: Job vacancy rate, Victoria (May 2013 to May 2023)
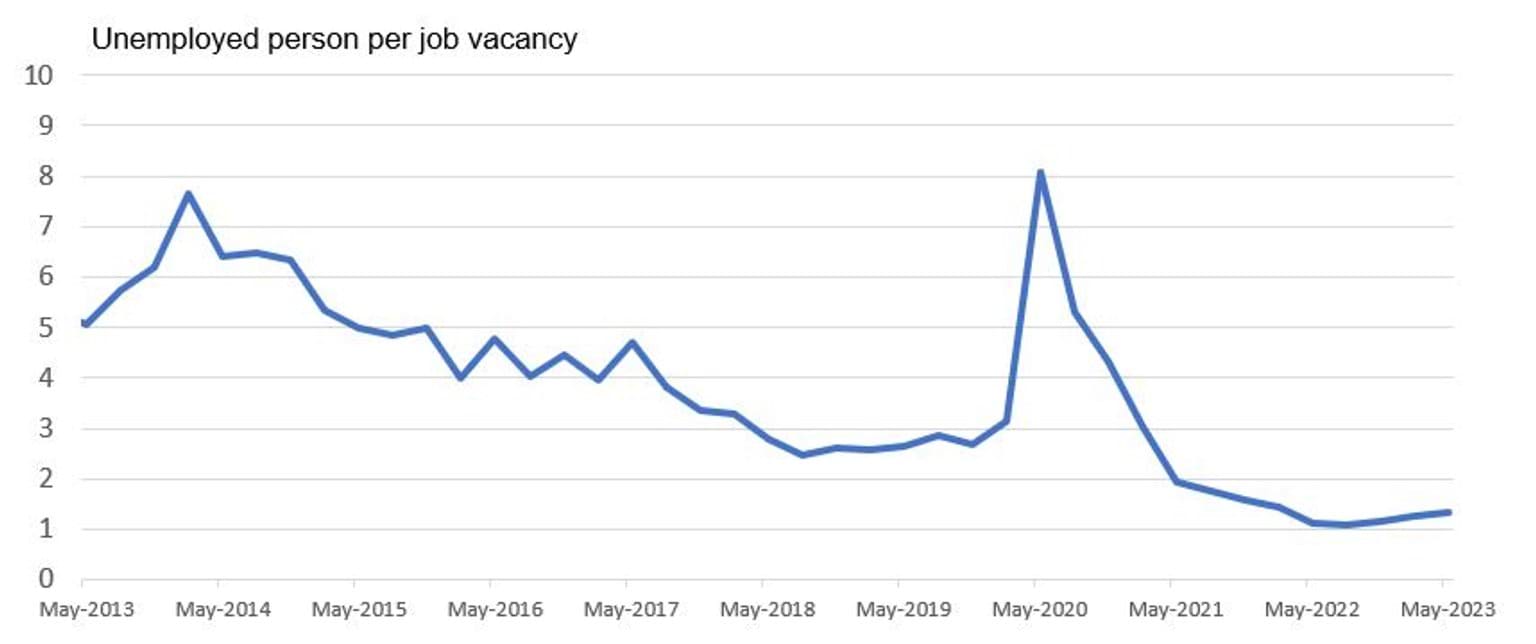
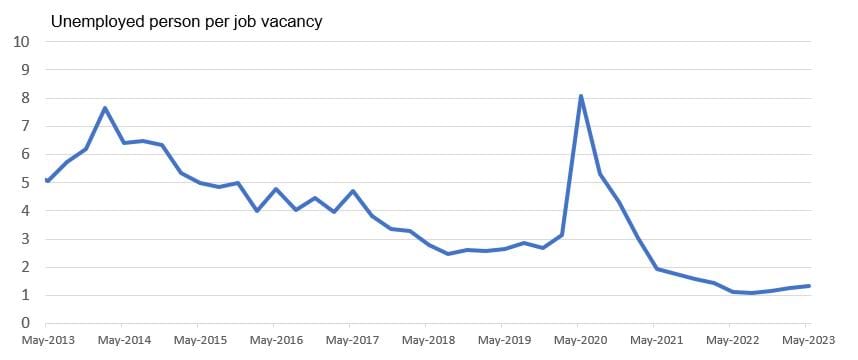
Tight labour market conditions are also illustrated by the falling ratio of unemployed persons (that is, labour supply) relative to job vacancies (that is, labour demand) in Victoria (Figure 1.4).8 This has been the case since May 2020, falling from a 24-year high of 8.1 (unemployed persons per vacancy) to a record low of 1.1 in May 2022. While it increased to 1.3 in May 2023, the number of unemployed persons remains close to the number of job vacancies.
Figure 1.4: Unemployed persons per job vacancy, Victoria (May 2013 to May 2023)
Data on occupational shortages presented in last year’s Victorian Skills Authority State of the Victorian Labour Market(opens in a new window) report (using data from the (former) National Skills Commission’s Skills Priority List) were the most recent estimates of occupational shortages at the time of preparing this report.9 The data showed that a total of 143 unique occupations were in shortage across Victoria, with the construction sector having the highest number of occupations in shortage. The updated Skills Priority List prepared by Jobs and Skills Australia was released on 4 October 2023, after the finalisation of this report.
Notes
6 Australian Bureau of Statistics, Job Vacancies, Australia, February 2023; Australian Bureau of Statistics, Labour Force, Australia, March 2023.
7 Jobs and Skills Australia, Recruitment Experiences and Outlook Survey, May 2023. Recruitment difficulty rate is defined as the proportion of recruiting employers who had recruitment difficulty.
8 While the number of unemployed is very close to the number of job vacancies, this does not necessarily mean that the unemployed can fill these vacancies due to skills gaps, lack of proximity to jobs, etcetera.
9 A shortage exists when employers are unable to fill or have considerable difficulty filling vacancies for an occupation at current levels of remuneration and conditions of employment, and in reasonably accessible locations.
Victoria is expecting over 350,000 new workers by 2026
Over 350,000 new workers by 2026
Around 352,000 new workers are expected to enter the labour market in Victoria by 2026. This includes 137,000 workers to fill new jobs and 215,000 workers to replace those retiring (this is an estimate of demand for workers and is not an indicator of workforce or skill shortage). Of these new workers, 277,000 (78.6%) are expected in metropolitan Melbourne and 75,000 (21.4%) in regional Victoria.10 The 352,000 new workers expected represents demand across industries, occupations and regions that is expected to be met by the supply of workers through various channels, including workers from overseas, new entrants to employment after school or post-secondary education, unemployment, people entering the labour market such as parents who previously had full-time care responsibilities, and job mobility.
These numbers are lower than the expected 373,000 new workers estimated in the 2022 State of the Victorian Labour Market report. This year’s lower forecasts account for the softer economic outlook in Australia which impacts the number of new workers needed in the near future – rising interest rates, higher cost of living, and a weaker global economic outlook. This year’s employment forecasts are based on a new model (see Appendix A(opens in a new window) for further details).
Victoria needs a skilled workforce to meet its future employment needs and an increasing proportion of this workforce will need to be highly skilled.
Under the Australian and New Zealand Standard Classification of Occupations (ANZSCO), each occupation is assigned a skill level between 1 and 5 which corresponds to a certain level of qualification attainment and, or experience.11
Qualifications required for each skill level
Higher order skills
Skill level 1
- A bachelor degree or higher.
Skill level 2
- An associate degree, advanced diploma or diploma.
Skill level 3
- Certificate III (including at least two years of on-the-job training) or Certificate IV.
Other skills
Skill level 4
- Certificate II or III.
Skill level 5
- Certificate I or compulsory secondary education.
Notes
10 Australian Bureau of Statistics, Labour Force, Australia, Detailed, May 2023.
11 Experience may substitute for formal qualification, or in other cases relevant experience may be required in addition to the formal qualification.
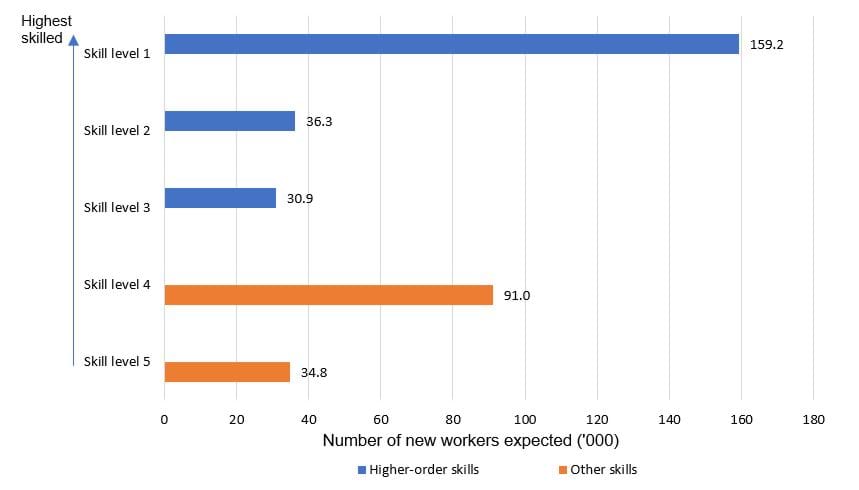
New workers by skill level
Over the next three years, Victoria is expecting 226,000 new workers in occupations with skill levels 1 to 3, which can be categorised as occupations requiring higher-order skills. These workers account for around 64% of new workers expected over the next three years (Figure 2.2). Higher-order skills, which align with qualifications from Certificate III (plus a minimum of two years of on-the-job experience) to a bachelor degree or higher are becoming more important.12 These capture occupations such as doctors, telecommunications technical specialists, plumbers, electricians, and aircraft maintenance engineers.13 Both universities and the TAFE Network will play a key role in delivering the pipeline of workers with higher-order skills.
Figure 2.2: New workers expected in Victoria by skill level (2023 to 2026)

Note: new workers expected by skill level are derived based on 4-digit ANZSCO occupation forecasts. For 22 of the 358 4-digit ANZSCO occupations that had more than one skill level, skill levels were assigned based on the predominate skill level of the occupation.
Notes
12 Experience may substitute for formal qualification, or in other cases relevant experience may be required in addition to the formal qualification.
13 Higher-order skills are defined using the occupations classified under the Australian and New Zealand Standard Classification of Occupations (ANZSCO) which does not contain new and emerging occupations such as data scientists, solar installers, or wind turbine technicians. For further details, see National Skills Commission (2021), Australian Jobs 2021 Emerging Occupations
An industry lens
All industries are expecting more new workers over the next three years (Figure 2.3).
While comprising 40% of current employment, health care and social assistance, education and training, professional, scientific and technical services, and accommodation and food services are expected to account for more than half of the 352,000 new workers expected over the next three years. The influences on employment growth vary by industry, with health care and social assistance and education and training spurred by government investments. This includes the National Disability Insurance Scheme, aged care services, and the Victorian Government’s Best Start, Best Life reforms to early childhood education. Changes to the professional, scientific and technical services industry are driven by advances in technology, while accommodation and food services are growing with visitor numbers. Further qualitative indicators into the influences on employment growth between 2023 and 2026 across each industry are provided in Appendix C(opens in a new window).
In professional, scientific and technical services, information, media and telecommunications, and financial and insurance services, more than 85% of new workers will need to have higher-order skills (Figure 2.3).
Figure 2.3: New workers expected in Victoria by industry (2023 to 2026)
| Industry | Higher-order skills | Other skills | Number of new workers expected |
| Health and community services | 60.7% | 39.3% | 83,300 |
| Education and training | 82.9% | 17.1% | 46,400 |
| Professional, scientific and technical services | 93.5% | 6.5% | 35,000 |
| Accommodation and food services | 38.7% | 61.3% | 32,300 |
| Manufacturing | 63.5% | 36.5% | 24,800 |
| Transport, postal and warehousing | 29.4% | 70.6% | 22,700 |
| Public administration and safety | 65.0% | 35.0% | 18,000 |
| Construction | 75.5% | 24.5% | 17,400 |
| Retail trade | 39.1% | 60.9% | 11,700 |
| Financial and insurance services | 85.1% | 14.9% | 10,500 |
| Administrative and support services | 39.4% | 60.6% | 10,000 |
| Wholesale trade | 53.2% | 46.8% | 8,300 |
| Other services | 65.5% | 34.5% | 6,500 |
| Rental, hiring and real estate services | 78.9% | 21.1% | 5,800 |
| Arts and recreation services | 63.1% | 36.9% | 5,700 |
| Agriculture, forestry and fishing | 73.3% | 26.7% | 5,600 |
| Information media and telecommunications | 88.1% | 11.9% | 4,000 |
| Electricity, gas, water and waste services | 70.7% | 29.3% | 3,600 |
| Mining | 67.1% | 32.9% | 700 |
Source: Victorian Skills Authority
Occupations in demand 2023 to 2026
Top three occupations in demand that require higher-order skills
Table 2.1 shows the top three occupations in demand that require higher-order skills and the number of new workers expected by 2026 within the 10 fastest growing industries.
These occupations vary significantly across each industry, though some appear in more than one, such as software and applications programmers.
Table 2.1: Occupations in demand that require higher-order skills in Victoria, new workers expected (2023 to 2026)
| Industry | Occupations in demand that require higher-order skills | Number |
| Health care and social assistance | Registered nurses | 9,900 |
| Health care and social assistance | Early childhood educators or child carers | 2,600 |
| Health care and social assistance | Welfare support workers | 2,600 |
| Education and training | University lecturers and tutors | 5,700 |
| Education and training | Primary school teachers | 5,100 |
| Education and training | Secondary school teachers | 4,800 |
| Professional, scientific and technical services | Software and applications programmers | 4,300 |
| Professional, scientific and technical services | Solicitors | 2,300 |
| Professional, scientific and technical services | Management and organisational analysts | 2,000 |
| Accommodation and food services | Chefs | 3,000 |
| Accommodation and food services | Cafe and restaurant managers | 1,700 |
| Accommodation and food services | Hotel and motel managers | 1,300 |
| Manufacturing | Production managers | 1,400 |
| Manufacturing | Manufacturers | 900 |
| Manufacturing | Metal fitters and machinists | 900 |
| Transport, postal and warehousing | Travel attendants | 600 |
| Transport, postal and warehousing | Supply, distribution and procurement managers | 500 |
| Transport, postal and warehousing | Air transport professionals | 500 |
| Public administration and safety | Police | 1,200 |
| Public administration and safety | Intelligence and policy analysts | 800 |
| Public administration and safety | Other information and organisation professionals | 500 |
| Construction | Construction managers | 2,400 |
| Construction | Electricians | 1,400 |
| Construction | Plumbers | 1,200 |
| Retail trade | Retail managers | 1,000 |
| Retail trade | Pharmacists | 500 |
| Retail trade | Advertising, public relations and sales managers | 300 |
| Financial and insurance services | Management and organisation analysts | 800 |
| Financial and insurance services | Financial investment advisers and managers | 800 |
| Financial and insurance services | Software and applications programmers | 500 |
Source: Victorian Skills Authority
Top 20 occupations
Occupations in demand 2023 to 2026
The top 20 occupations in demand (based on the number of new workers expected) is diverse.
Ageing and disability carers, general clerks, and registered nurses are expected to account for the highest number of new workers expected over the next three years (Figure 2.4). This corresponds with the strong growth expected across the industries that need these occupations such as health care and social assistance, and that these occupations are currently the second to fourth largest occupations. Nine out of the 20 occupations in demand will require higher-order skills.
Some of these top 20 occupations in demand will be spread across multiple industries, such as software and application programmers, sales assistants (general), truck drivers, and storepersons.
As stated in the 2022 State of the Victorian Labour Market report, some occupations are critical for the functioning of some industries and regions but require small numbers of workers. Examples are saw technicians, metal casters, specialist engineers, software architects and harbour pilots. These critical occupations can affect the viability of some industries and jobs in local communities that rely on them.
Figure 2.4: Top 20 occupations in demand, new workers expected in Victoria (2023 to 2026)
| Occupation | Number of new workers expected |
| Ageing and disability carers | 17,600 |
| General clerks | 13,700 |
| Registered nurses | 10,200 |
| Sales assistants (general) | 7,000 |
| Software and applications programmers | 6,400 |
| University lecturers and tutors | 5,700 |
| Storepersons | 5,400 |
| Primary school teachers | 5,300 |
| Management and organisation analysts | 5,000 |
| Secondary school teachers | 4,900 |
| Human resource managers | 4,600 |
| Accountants | 4,600 |
| Delivery drivers | 4,500 |
| Commercial cleaners | 4,400 |
| Nursing support and personal care workers | 4,200 |
| Kitchenhands | 4,000 |
| Waiters | 4,000 |
| Advertising, public relations and sales managers | 4,000 |
| Truck drivers | 3,700 |
| Receptionists | 3,600 |
Source: Victorian Skills Authority
Regional and Specialist Training Fund
The Regional and Specialist Training Fund aims to remove barriers that prevent a local response to local skilling challenges.
Targeted funding stream initiative
To support local communities, the Victorian Government, through the Regional and Specialist Training Fund (RSTF) aims to remove barriers that prevent a local response to local skilling challenges. The RSTF is a targeted funding stream that supports training for specific skills in regional areas of Victoria and specialist areas of industry need, as well as for priority cohorts whose needs are not being met by the training market (see Box 2.1 for an example of a RSTF initiative).14
Box 2.1: Wind turbine blade repair technicians
Federation University has developed and delivered the Certificate III Engineering (Composites) contextualised to the role of a wind turbine blade repair technician for commencement of enrolments in July 2022 from a dedicated training facility. The project includes development of all learner resources and embedding of visual microlearning tools that support 12 apprentices undertaking this qualification.
Grant funding of $1.35 million was approved for training delivery, development of 30 units of competency contextualised to a blade repair technician role, and air-conditioning or ventilation in the training space.
Notes
14 Victorian Government (2023) Regional and Specialist Training Fund, March.
Metropolitan labour market needs
Labour market needs of metropolitan Melbourne (2023 to 2026)
The strong demand for workers in metropolitan Melbourne continues
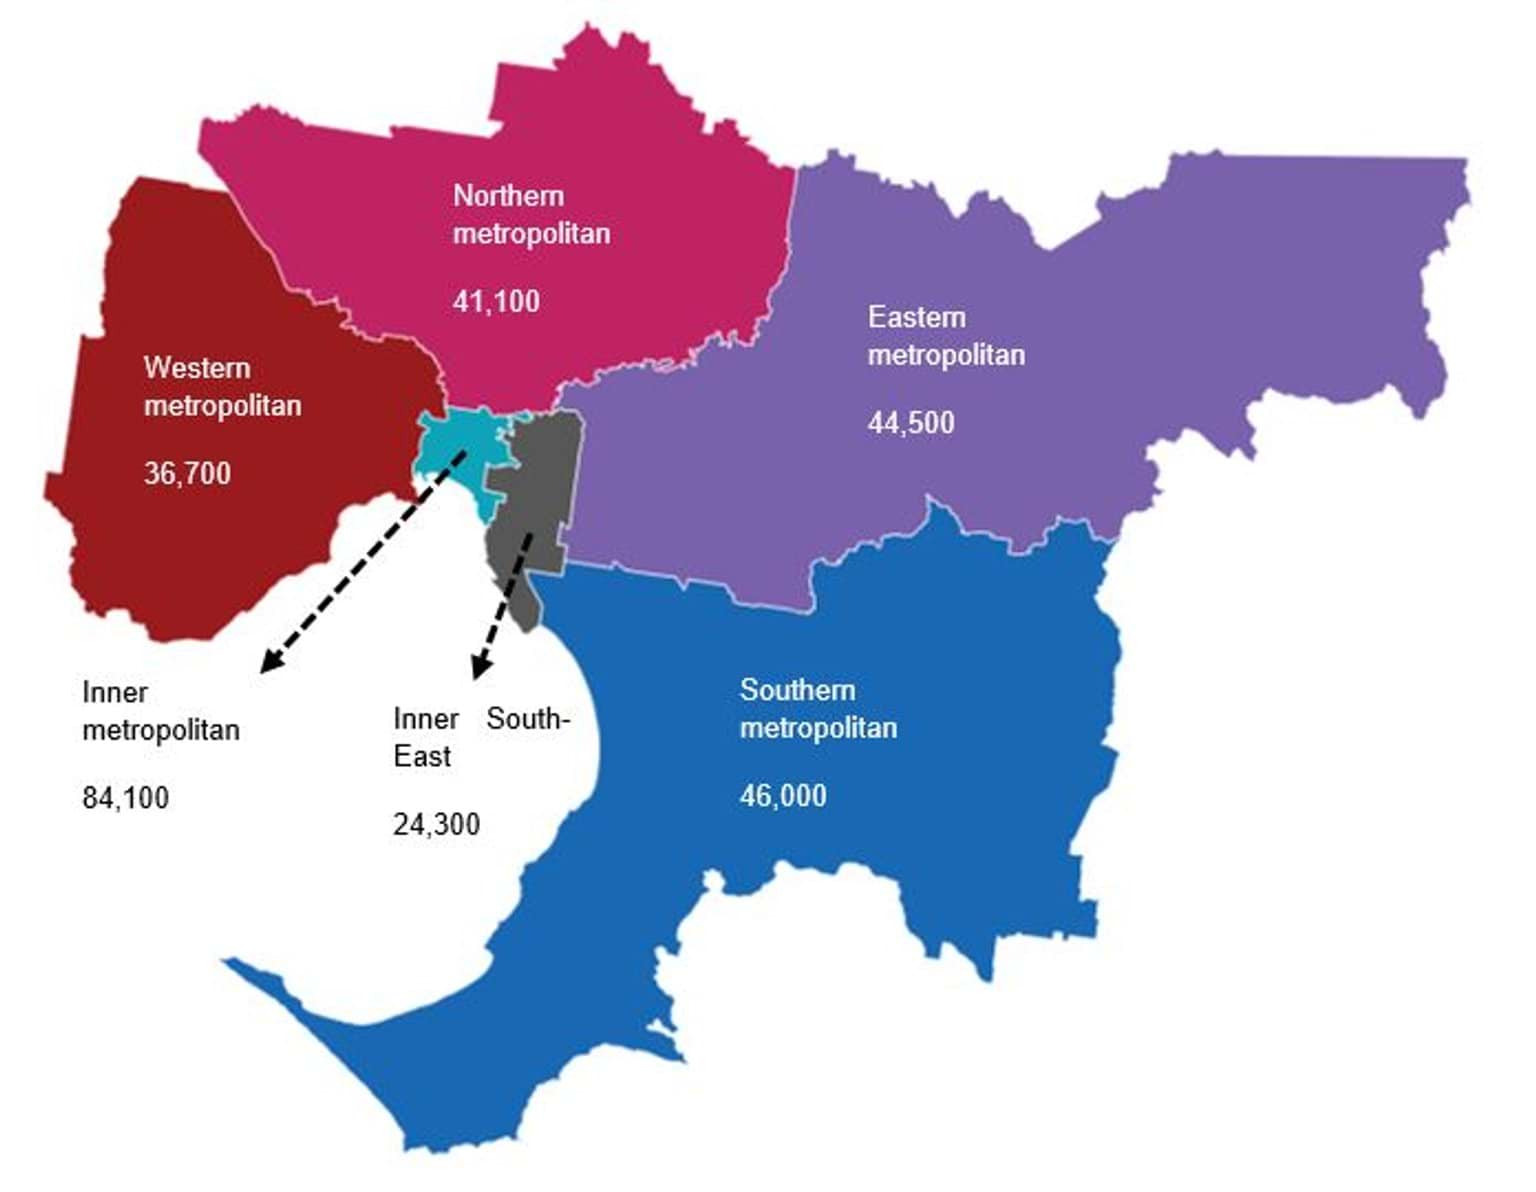
For the first time, the number of new workers expected for metropolitan Melbourne is segmented into six sub-regions. Metropolitan Melbourne is expected to account for 78.6% of new workers (or 277,000) in Victoria by 2026. Relative to its share of current employment (77.9%), metropolitan Melbourne is expected to account for a slightly higher proportion of new workers.
Around two-thirds (65.3%) of new workers expected (or 180,500) will require higher-order skills.
The inner metropolitan (30.4%), southern metropolitan (16.6%), and eastern metropolitan (16.1%) regions will account for the highest proportion of new workers expected in metropolitan Melbourne over the next three years (Figure 2.5).
Figure 2.5: New workers expected across metropolitan Melbourne (2023 to 2026)
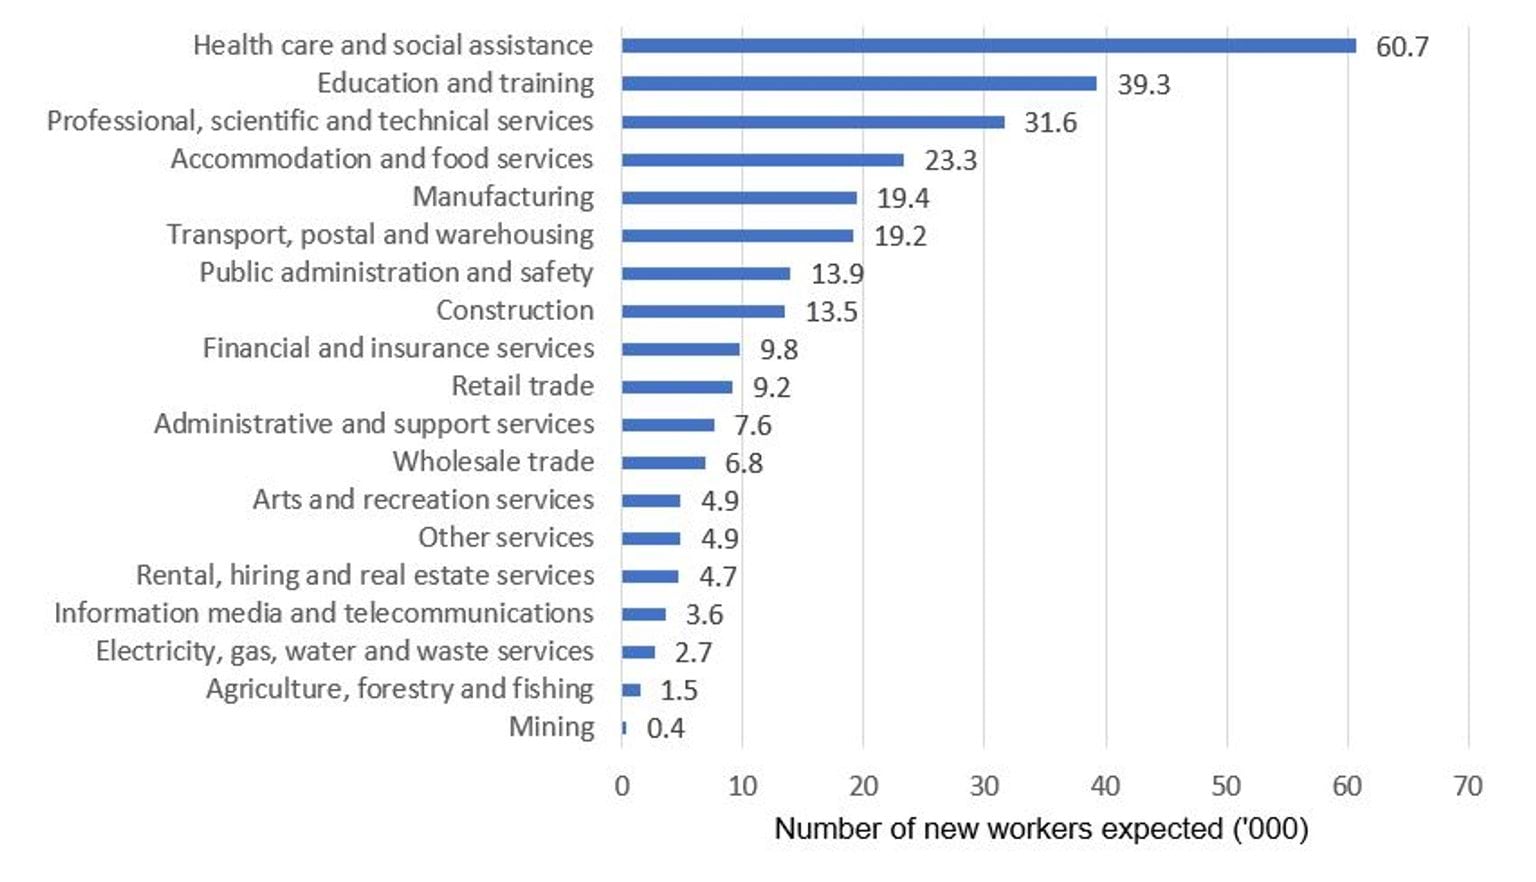
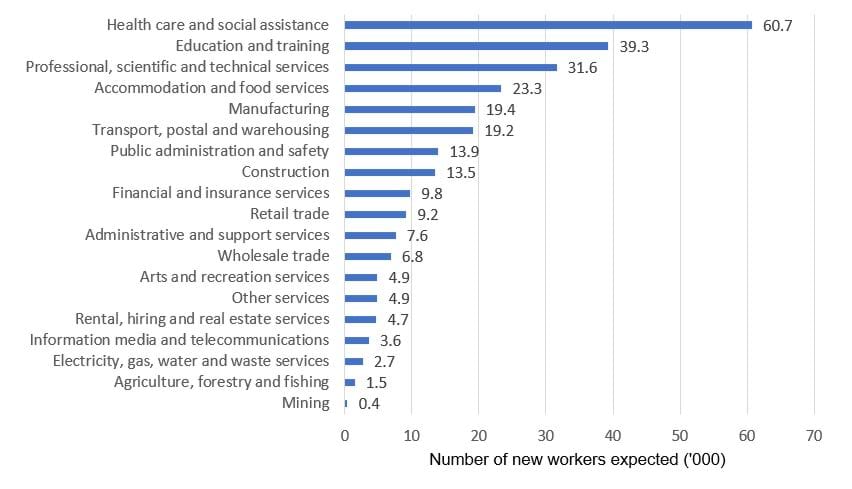
Across metropolitan Melbourne, health care and social assistance (60,700), education and training (39,300), and professional, scientific and technical services (31,600) expect the highest number of new workers by 2026 (Figure 2.6).
Figure 2.6: New workers expected in metropolitan Melbourne by industry (2023 to 2026)
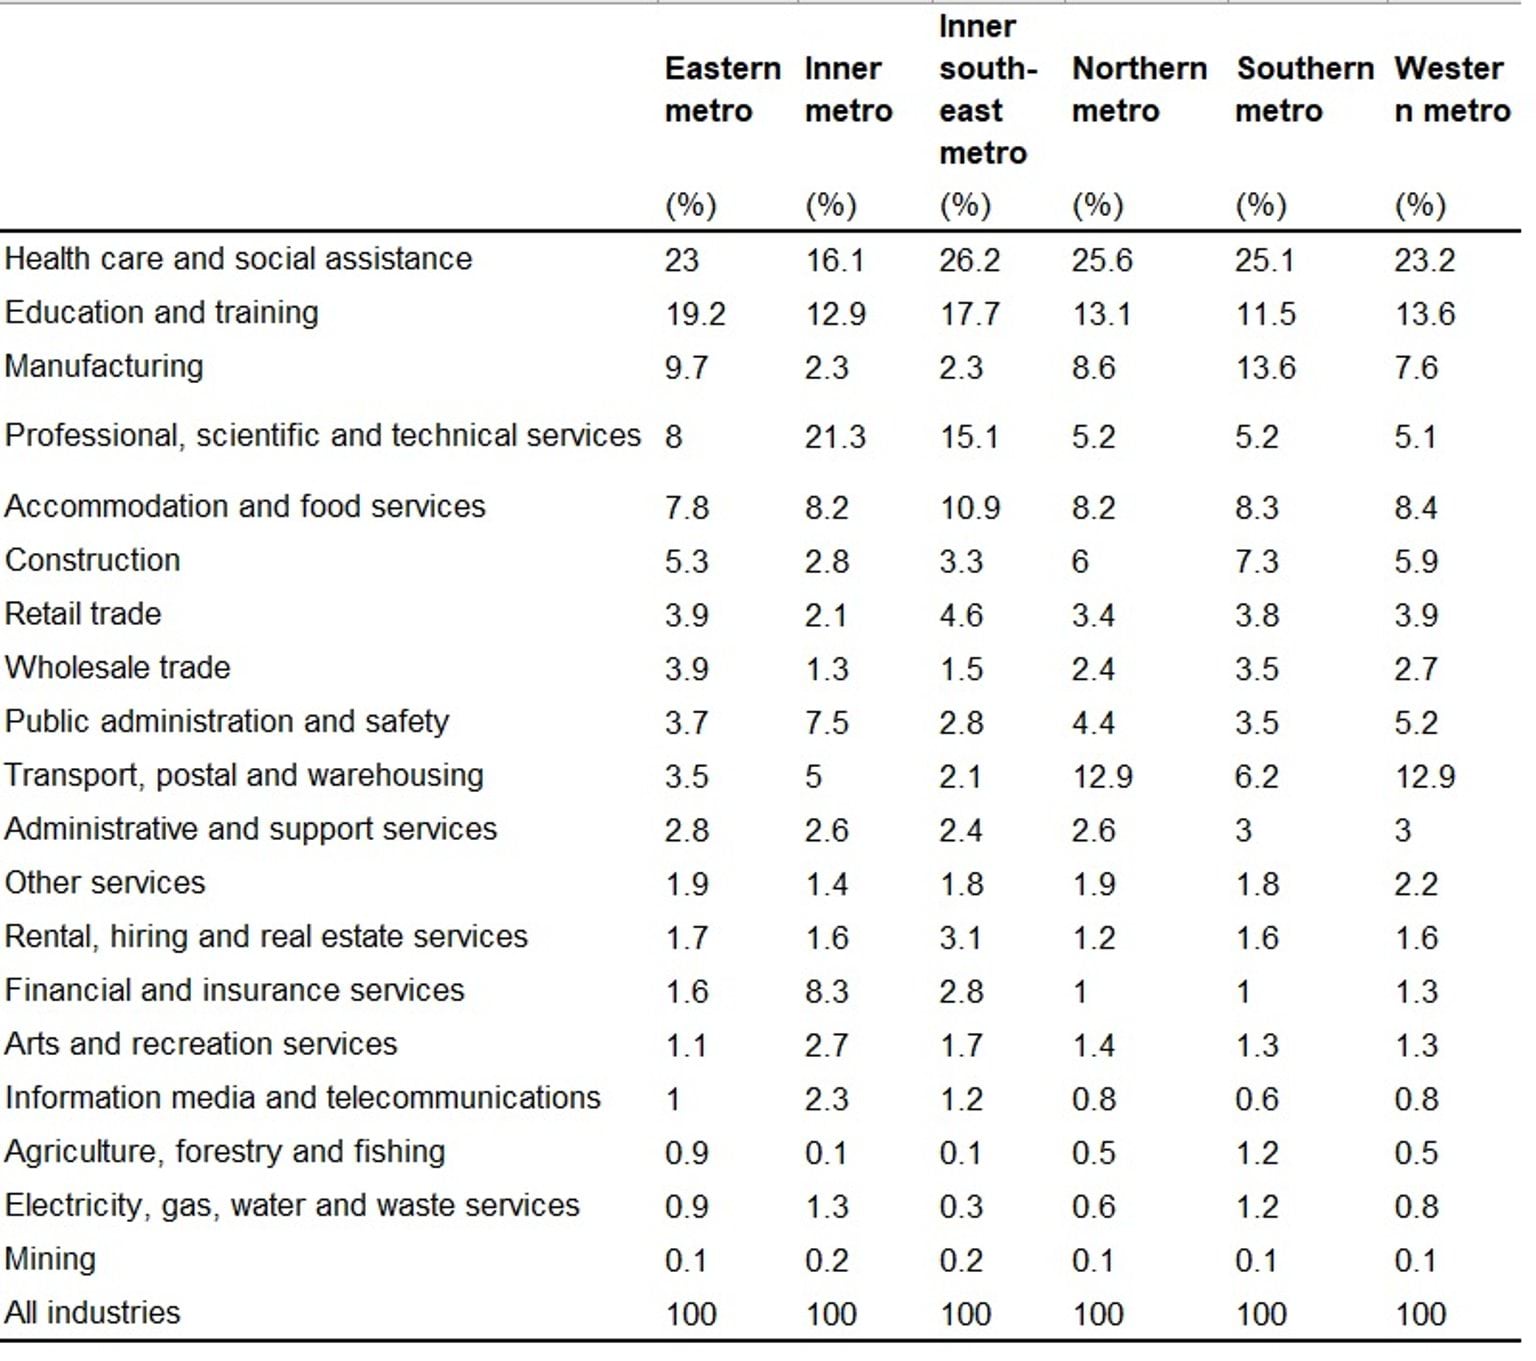
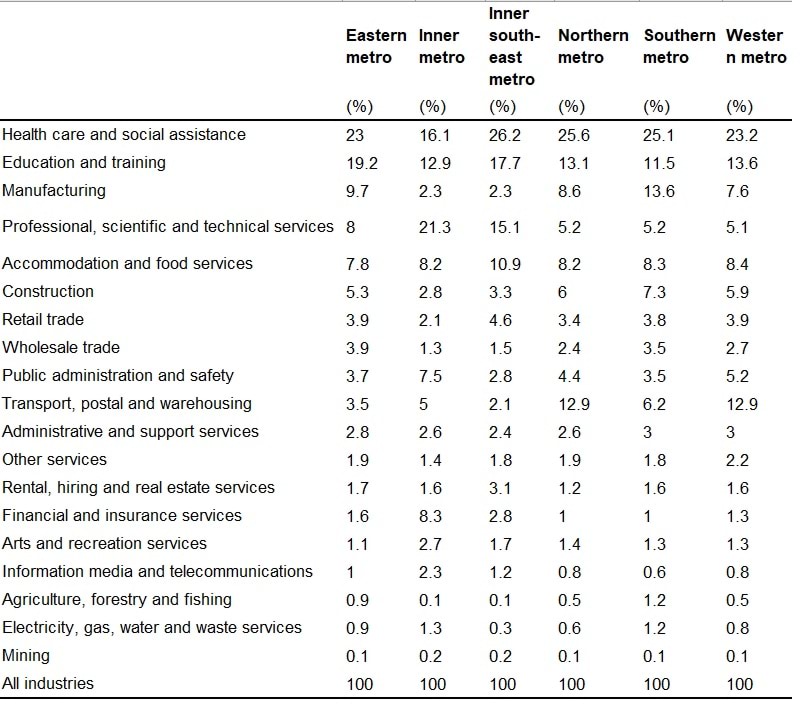
These trends are broadly similar across most of the metropolitan regions, with health care and social assistance accounting for the highest proportion of new workers expected by 2026. The exception is inner metropolitan Melbourne, where professional, scientific and technical services had the highest proportion of new workers expected. In general, this is a relatively higher proportion of new workers expected in professional, scientific and technical services in the inner metropolitan regions due to businesses preferring locations with access to a broad and highly-skilled labour force and opportunities for business-to-business interactions. In contrast, the other metropolitan regions expect relatively higher proportions in construction, due to these businesses preferring lower value employment lands that are closer to their residential customer base, and manufacturing, due to cheaper industrial land for space and access to transport links for trade (Table B1 in Appendix B).
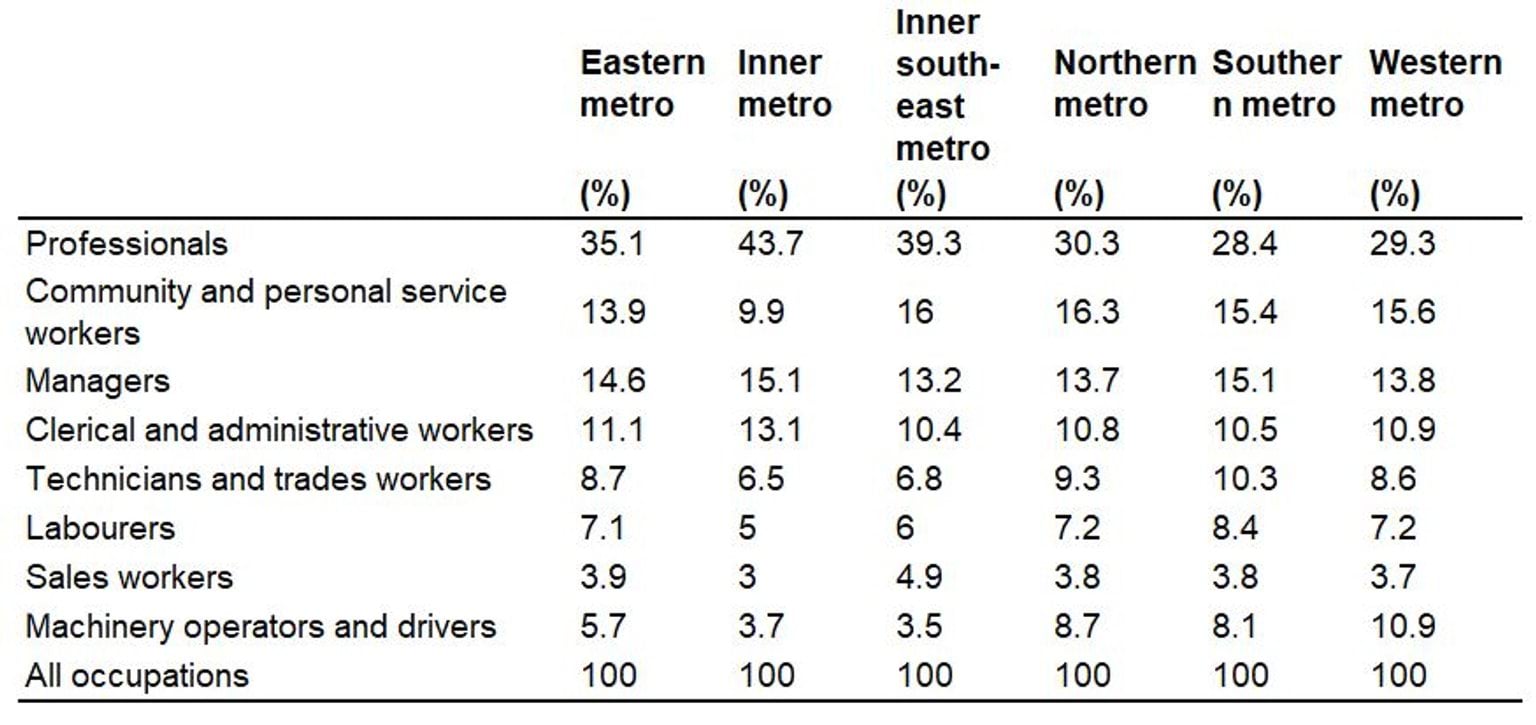
The occupational profile for new workers expected is also broadly similar across each of the metropolitan regions, with professionals being the most common occupation at the broad ANZSCO 1-digit level. This is particularly the case for the inner metropolitan regions, where there is an even higher proportion of professionals (around four in 10 new workers expected) compared to the other metropolitan regions (around three in 10). Further, non-inner metropolitan regions have a relatively higher proportion of machinery operators and drivers, particularly in the western metropolitan region (Table B2 in Appendix B).
At a more detailed occupational level, ageing and disability carers, general clerks, and registered nurses will be among the top five occupations in demand across all metropolitan regions.
Regional labour market needs
Labour market needs of regional Victoria (2023 to 2026)
Regional Victoria will be home to many more workers
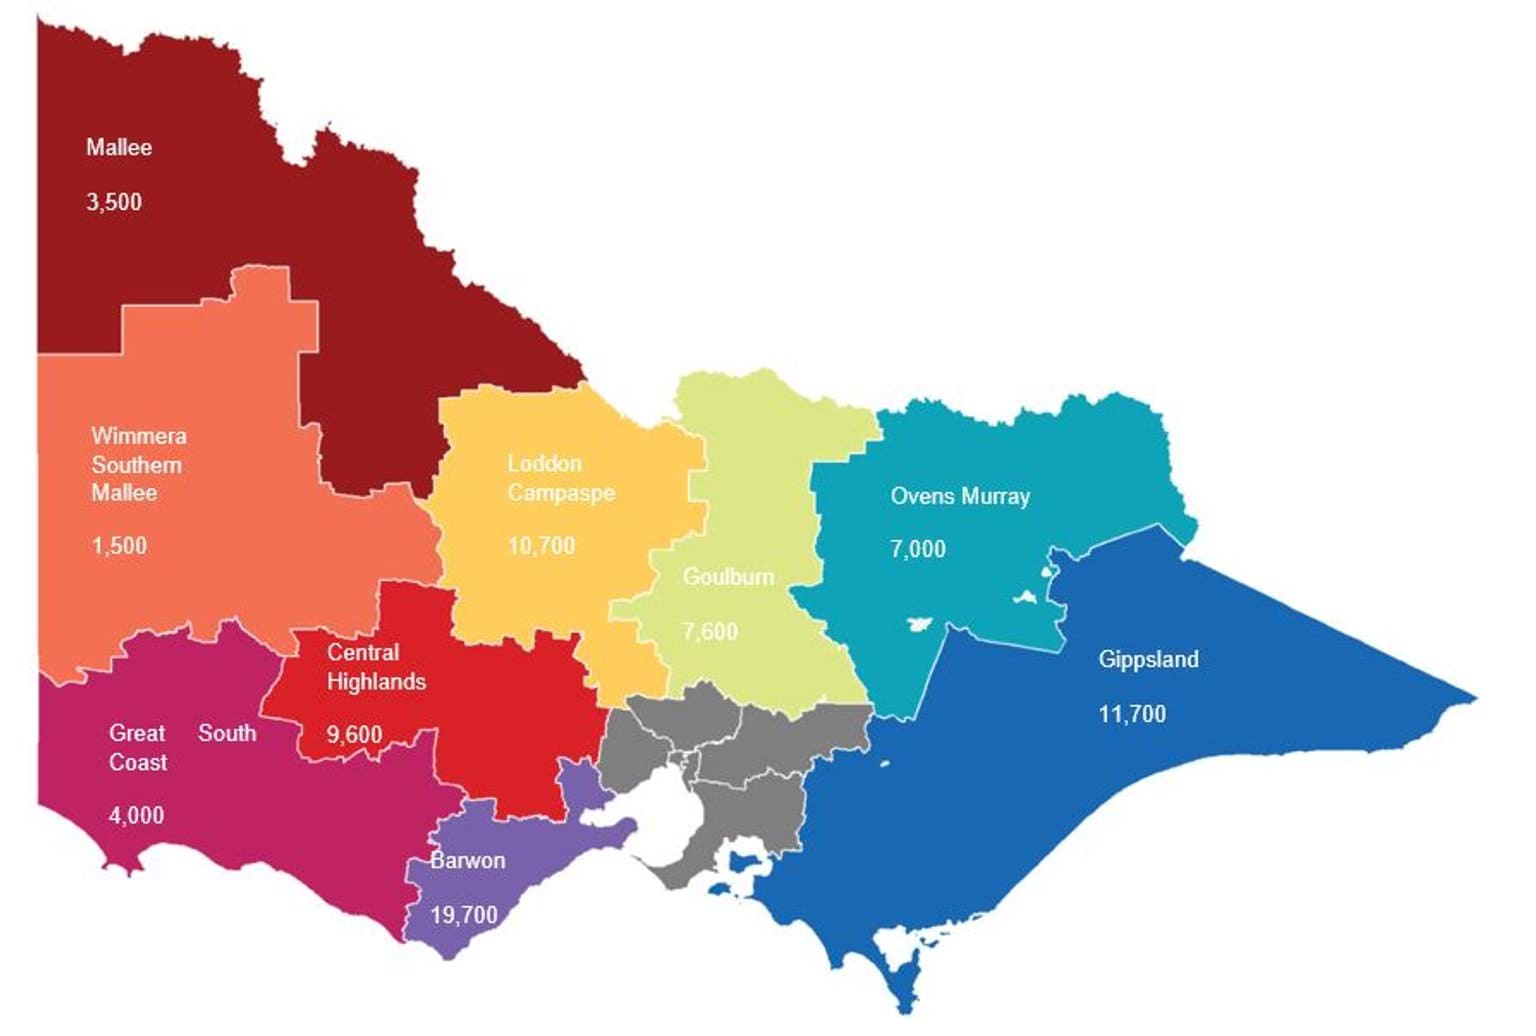
Regional Victoria will account for 21.4% of new workers expected (or 75,000) by 2026. Barwon, Gippsland, Loddon Campaspe, and Central Highlands regions will account for around two-thirds of these new workers (Figure 2.7).
Around 61% of new workers expected (or 45,700) in regional Victoria will require higher-order skills.
Figure 2.7: New workers expected across regional Victoria (2023 to 2026)
The number of new workers expected in the short-term for regional Victoria is lower than what was expected in the Victorian Skills Plan for 2022 into 2023(opens in a new window). The relatively weaker trajectory for new workers expected in regional Victoria is due to factors related to labour supply. The surge in internal migration to regional Victoria in recent years increased demand for services and in turn, the demand for workers. However, this is likely a temporary shock as regional areas are unlikely to sustain the same rate of growth in the future. Lack of available housing in regional Victoria accompanied by an expected slowdown in housing construction will contribute to softening of new workers expected. Further, the ageing population, more concentrated in regional Victoria, is expected to reduce labour supply more than in metropolitan Melbourne. Finally, there is a lower proportion of people of working age in regional Victoria, which is also expected to decline faster than for metropolitan Melbourne.15
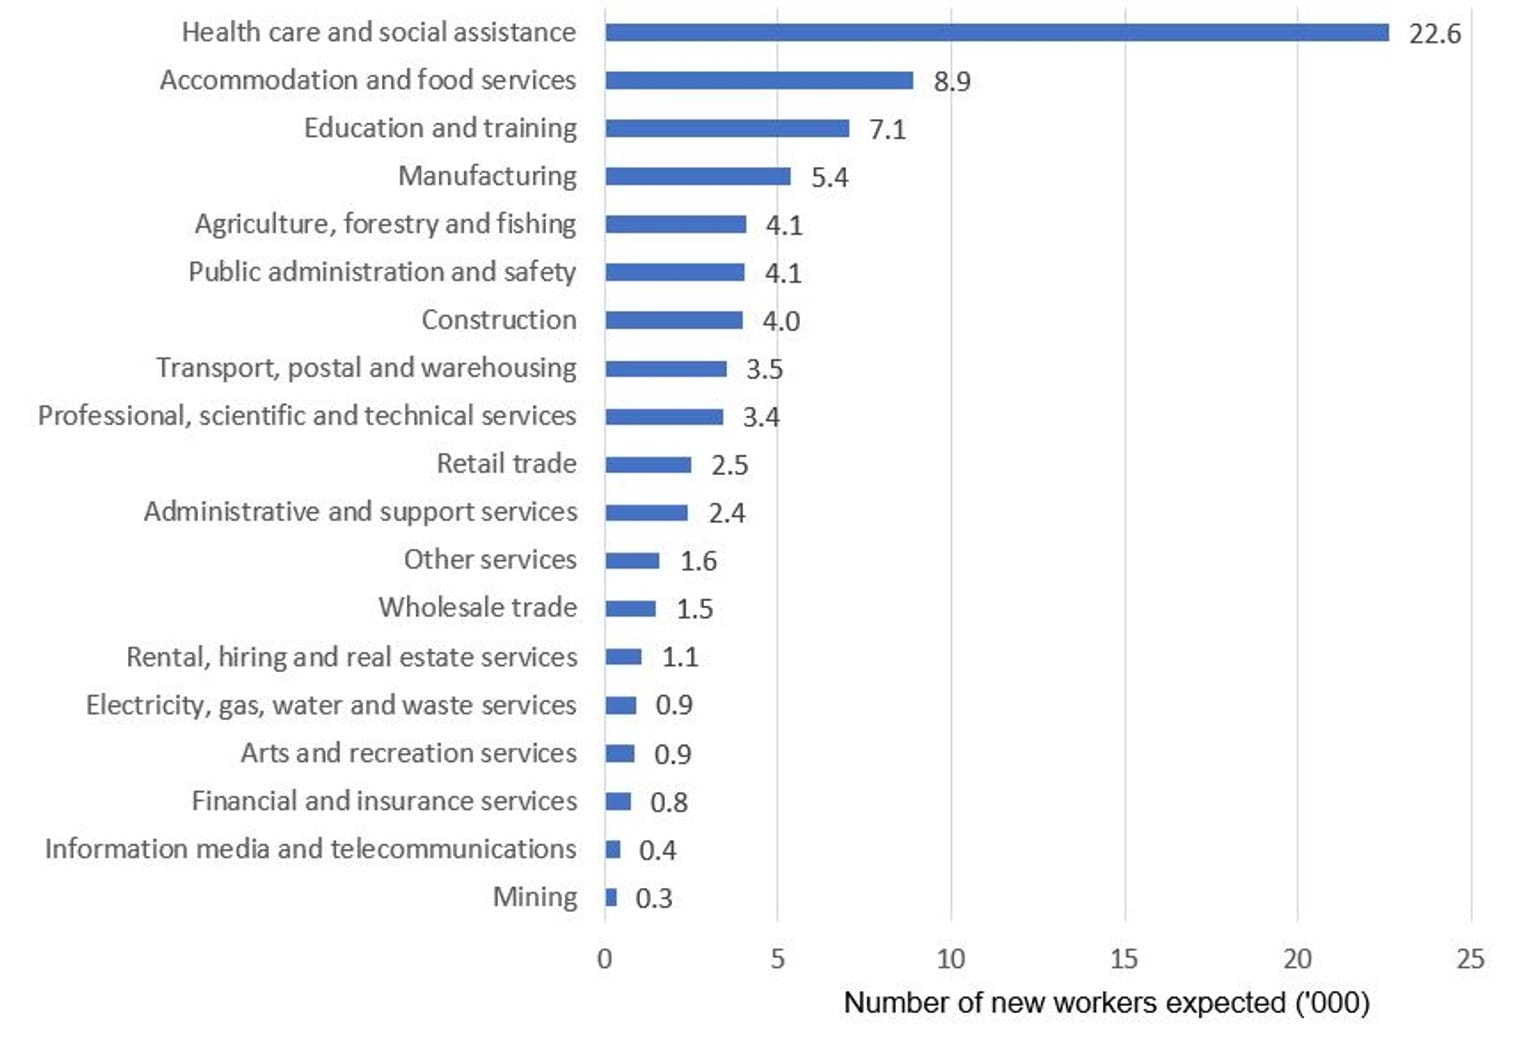
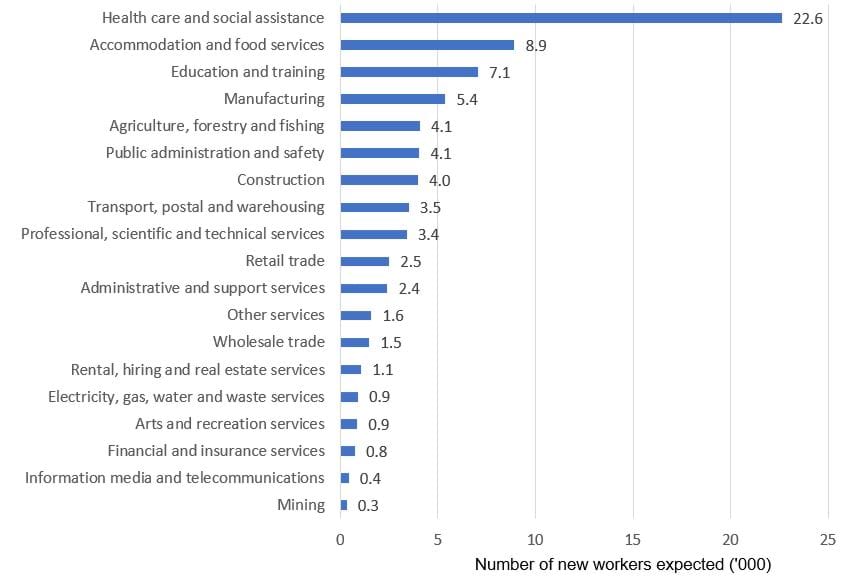
Across industries in regional Victoria, health care and social assistance (22,600 new workers), accommodation and food services (8,900), and education and training (7,100) are expecting the highest number of new workers by 2026 (Figure 2.8).
Figure 2.8: New workers expected in regional Victoria by industry (2023 to 2026)
Similar trends are observed across each of the nine regions, with health care and social assistance accounting for the highest proportion of new workers expected by 2026. There are some differences though. For example, there is a relatively higher proportion of new workers expected:
- in agriculture, forestry and fishing for Great South Coast, Wimmera Southern Mallee and Mallee
- in education and training for Barwon and Central Highlands
- in accommodation and food services for Ovens Murray
- in construction for Barwon, Central Highlands, and Goulburn.
These trends are primarily driven by a higher share of current employment for these industries in the respective regions.
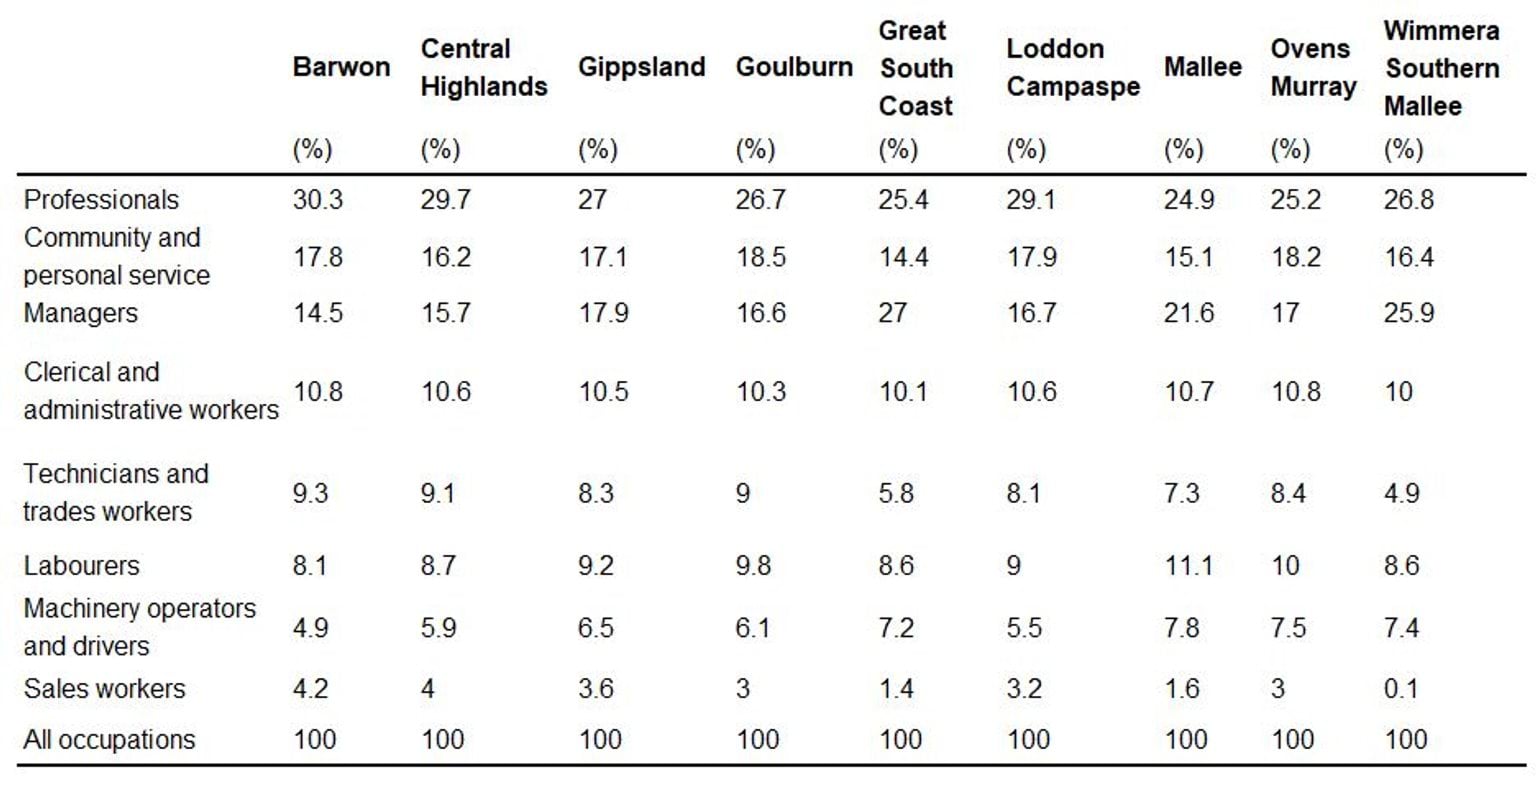
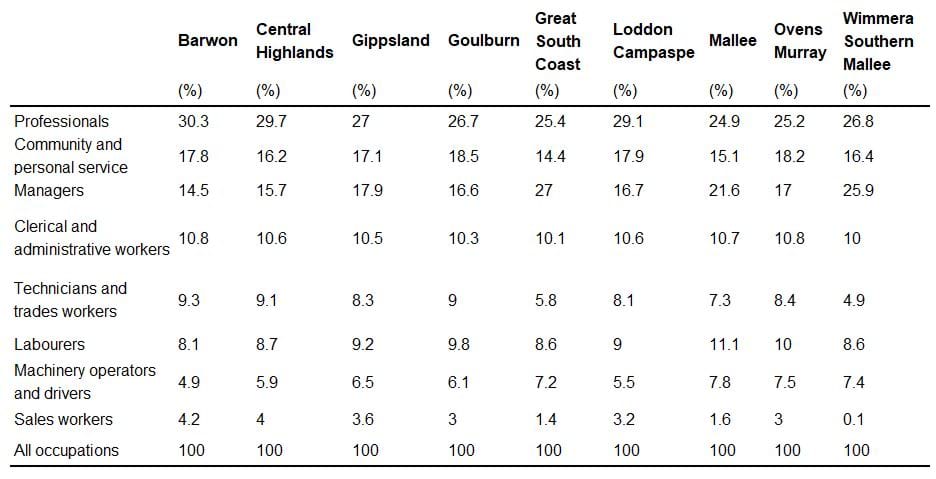
Similar to the metropolitan Melbourne, professionals will drive the new workers expected over the next three years across all regions in regional Victoria, except for the Great South Coast, where managers are expected to be in more demand.
At a more detailed occupational level, the trends in regional Victoria are similar to the metropolitan sub-regions, with ageing and disability carers, registered nurses and general clerks being in the top five occupations in demand across all regional areas. Livestock farmers are in the top five occupations in demand for five of the nine regions (Gippsland, Great South Coast, Loddon Campaspe, Mallee and Wimmera Southern Mallee).
Notes
15 Australian Bureau of Statistics, National, state and territory population (June 2022); Department of Transport and Planning, Victoria in Future, 2019.
Influences on the Victorian labour market
Economic conditions
The Australian economy is forecast to grow more slowly than previously expected.16 In August 2023, the RBA forecasted gross domestic product (GDP) growth to fall to 0.9% over the year to December 2023 before recovering afterwards, which is well below forecasts at the same time last year.17 Slower economic growth is driven by a significantly weaker household consumption outlook (that is, weaker consumer spending), which is expected to reach a trough of 1.3% over the year to December 2023 – around half of the growth expected by the RBA in the previous year.18 It is also driven by the sharp and unexpected rise in inflation, with global economic circumstances and strong consumer demand being the main drivers. High inflation and rising interest rates are weighing on household disposable income and in turn, household spending.
The Victorian economy is also expected to grow more slowly than previously expected, due to the same factors weighing on the Australian economy. Forecasts from the Victorian Budget 2023/24 in May 2023 show that real gross state product is expected to rise by 2.75% in 2022 to 2023 (lower than the 3.25% expected in May 2022) and 1.5% in 2023 to 2024 (lower than the 2.25% expected in May 2022).
While economic conditions remain favourable, rising interest rates and cost of living pressures have also dented business and consumer confidence in Victoria.19 Further, economic activity, consumer spending and demand for labour are likely to soften throughout 2023.
Overseas migration
Between the June quarter 2020 and September quarter 2021, Victoria experienced net overseas departures of 60,500 people (or an average of 40,300 per year). However, since the staged reopening of international borders on 1 November 2021, overseas migration has rapidly rebounded, boosting labour supply.20 Net overseas migration exceeded the pre-COVID-19 three-year average of 87,100, with 120,500 net overseas migration over the year to the December quarter 2022.21
Net overseas migration is expected to increase in Victoria over the next two financial years, with the Australian Treasury forecasting that 715,000 migrants will arrive in the country over this period.22
Based on industry-level historical patterns, the increase in current and future labour supply due to the rebound in overseas migration and arrivals may be more pronounced in administrative and support services and accommodation and food services, where the proportion of workers who are recent migrants in 2021 are more than double the Victorian average of 5.2% (Figure 3.1).23
Figure 3.1: Proportion of workers in Victoria who are recent migrants by industry (2021)

Occupations that are currently most reliant on recent migrants may experience a higher increase in labour supply. The top five occupations (4-digit ANZSCO) in 2021 that are the most reliant on recent migrants include meat boners, crop farm workers, software and application programmers, commercial cleaners, and chefs.
Metropolitan Melbourne will benefit most from the rebound in overseas entrants as recent arrivals account for a much higher proportion of the labour force in metropolitan Victoria (6.5%) compared with regional Victoria (2.2%). Metropolitan local government areas (LGAs) tend to have higher proportions of the labour force being recent migrants compared with LGAs in regional Victoria.
Recovery from the COVID-19 pandemic
With COVID-19 transitioning from pandemic to endemic, workforce absenteeism is easing though future impacts are still uncertain.24 Both the number of people in Victoria working fewer hours or no hours due to illness or injury or sick leave has declined significantly over the last year to be near or below pre-pandemic levels.25 However, the changes in behaviour and preferences arising from the pandemic remain, with many workplaces adopting a hybrid model of working from home and in the office. This has implications for workforce supply for particular occupations.
There has also been a change in behaviour where more people are changing jobs. This is discussed further in chapter four.
Notes
16 Reserve Bank of Australia (2023) Statement on Monetary Policy February, p. 69; Department of Treasury and Finance (2022) Victorian Pre-Election Budget Update November, p. 3.
17 Reserve Bank of Australia (2023) Statement on Monetary Policy August; Reserve Bank of Australia (2022) Statement on Monetary Policy August.
18 Reserve Bank of Australia (2023) Statement on Monetary Policy August; Reserve Bank of Australia (2022) Statement on Monetary Policy August.
19 National Australia Bank (2023) Monthly Business Survey: June 2023; Westpac-Melbourne Institute (2023) Consumer Sentiment 11 July.
20 The Hon Karen Andrews MP Reopening to tourists and other international travellers to secure our economic recovery joint media release with the Hon Scott Morrison MP, the Hon Greg Hunt MP and the Hon Dan Tehan MP, 7 February 2022.
21 Australian Bureau of Statistics, National, state and territory population, December 2022.
22 Treasury (2023) Budget Strategy and Outlook: budget paper no. 1, 9 May, p. 58.
23 Recent migrants are those from the Australian Bureau of Statistics (ABS) Census 2021 that arrived in Australia since 2017.
24 Department of Health and Aged Care (2022) ATAGI statement on recommendations on a winter booster dose of COVID-19 vaccine, 25 March.
25 Australian Bureau of Statistics, Labour Force, Australia, April 2023, Data Cube EM2b.
More influences
More young people entering the labour market
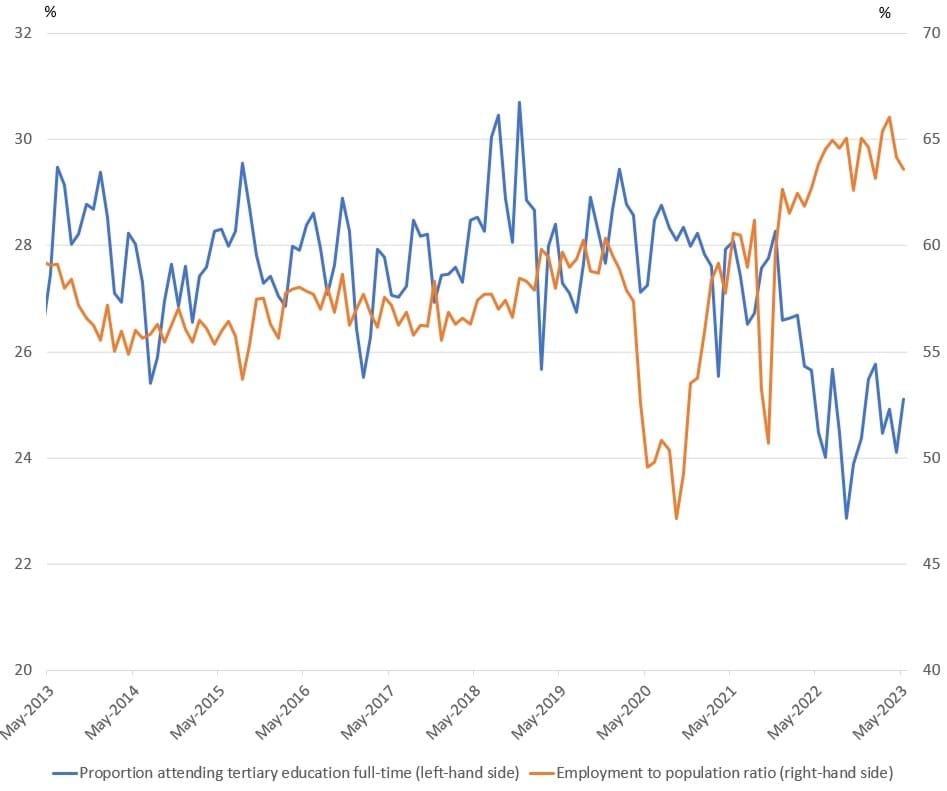
More young people are entering the labour market. As at May 2023, the employment to population ratio for people aged 15 to 24 years is 63.6%, which is well above the three year pre-COVID-19 average.
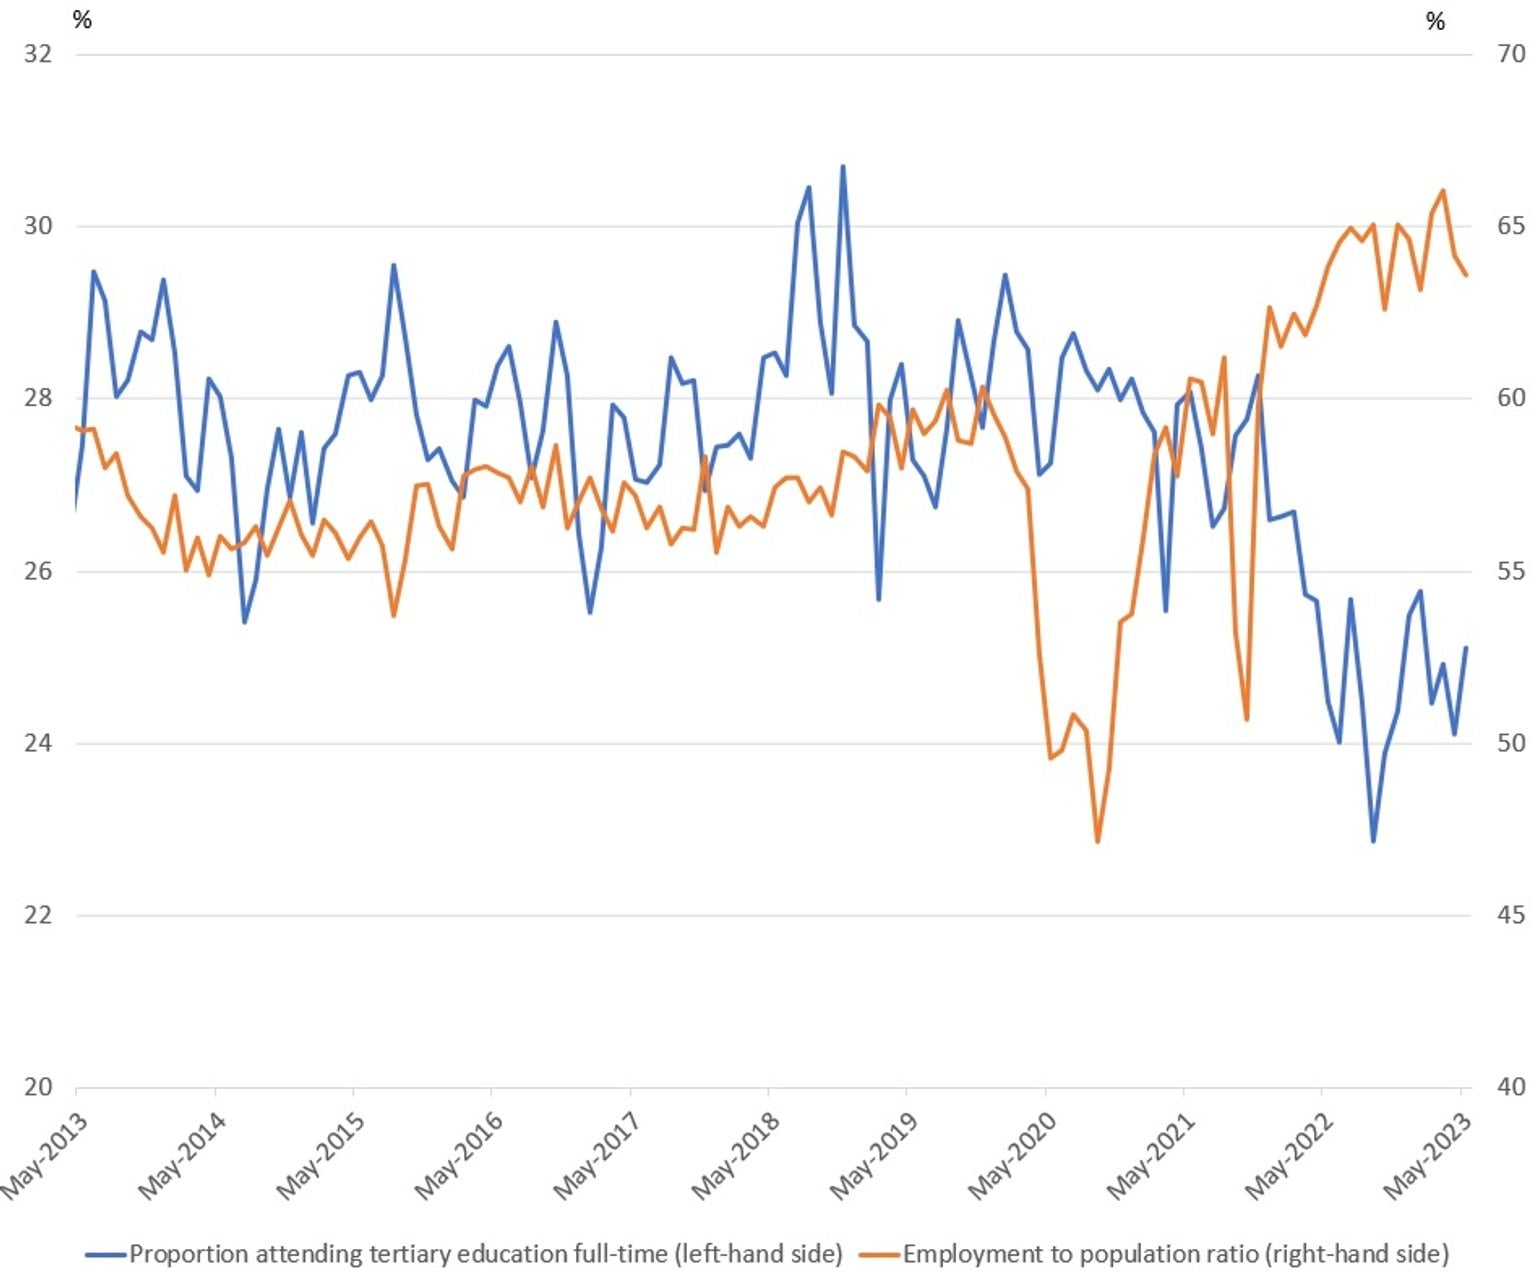
Strong employment growth for young people aged 15 to 24 years has been associated with a fall in the proportion of full-time tertiary education attendance in Victoria (Figure 3.2). The strong labour market is encouraging more young people to forego tertiary education for employment. In addition, the rising inflation further increases the incentive to forego tertiary education for employment. These trends are also observed across Australia, as noted by Borland (2023).26
Figure 3.2: Proportion attending tertiary education full-time and employment to population ratio, 15 to 24 year olds, Victoria (May 2013 to May 2023)
Higher youth labour supply today could come at the cost of higher-order skills in the future. Young people are potentially foregoing their tertiary education and the knowledge and skills they would acquire through formal education. This may have longer-term consequences as the lifetime earnings of these individuals may be lower due to their lower level of formally recognised skills, as well as a higher likelihood of ending up in precarious employment.27
Ageing population
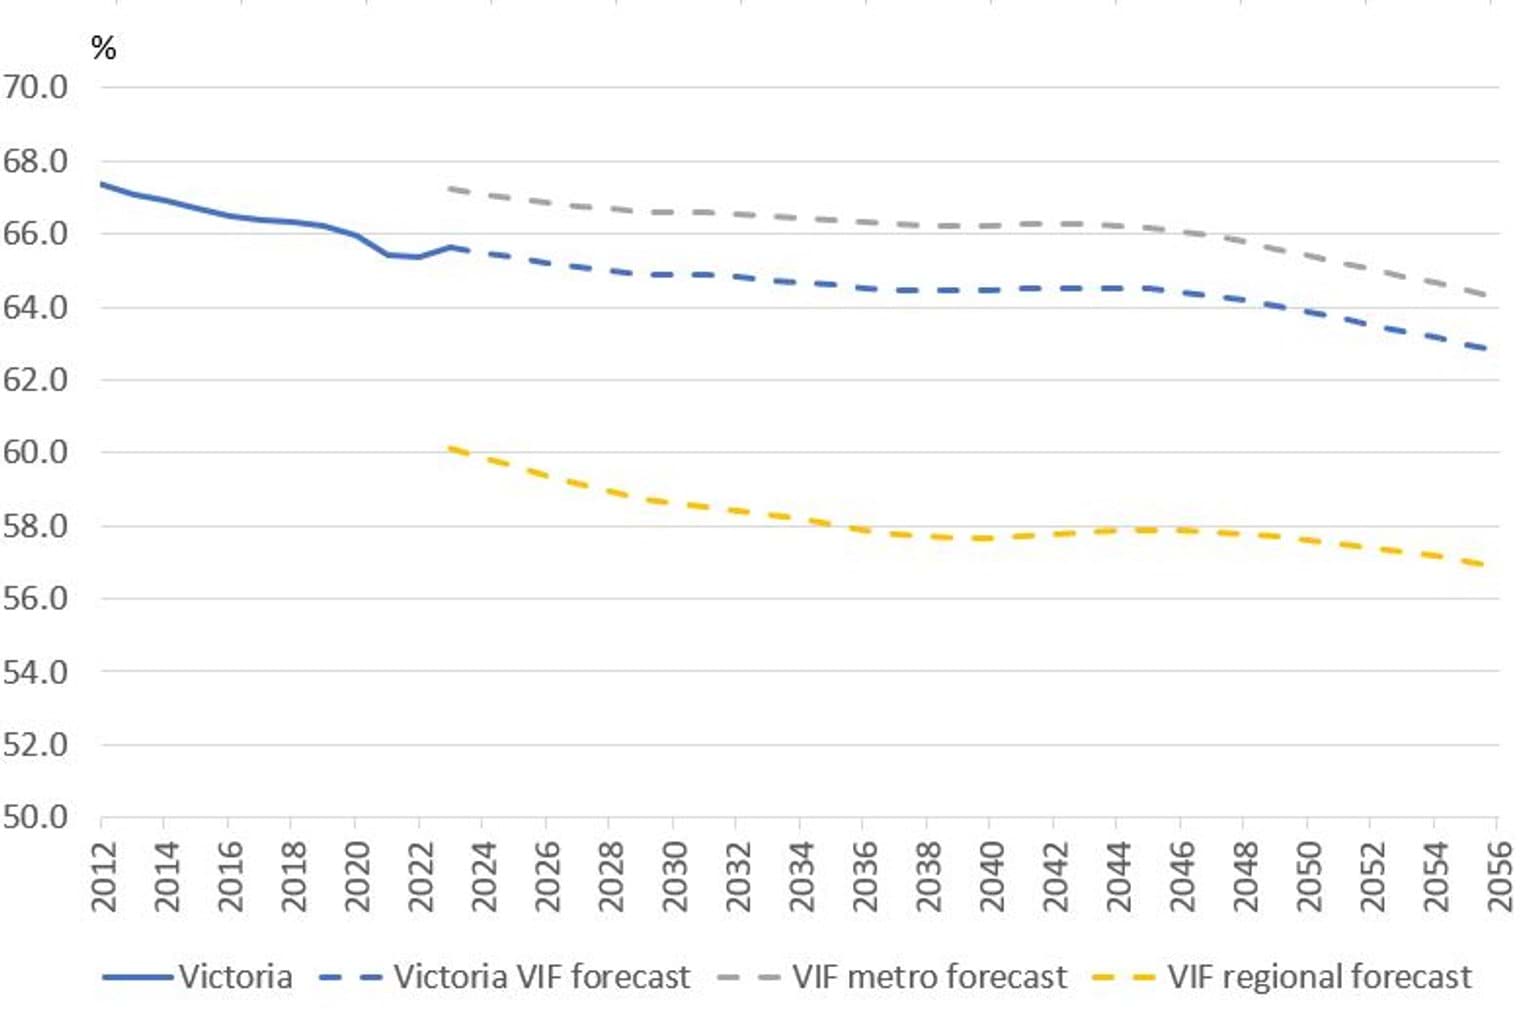
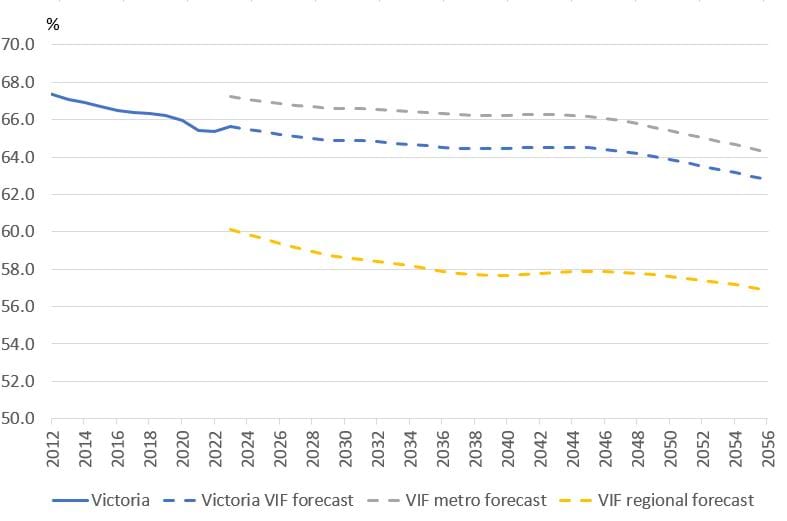
The proportion of working-age Victorians (defined as those aged between 15 and 64 years) is not keeping pace with the overall population as the population ages. In June 2022, around two-thirds (65.4%) of the population were of working age. This is expected to decrease to 63.9% in 2050. In regional areas, this proportion is expected to fall even more to 57.6% in 2050 (Figure 3.3).
This will result in fewer workers available to meet the employment demand triggered by overall population growth. Further, those outside of the working age population, such as children and retirees, generally need higher levels of support in terms of education, health, and aged care.
Figure 3.3: Proportion of population that is of working age, Victoria (2012 to 2056)
Notes
26 Borland (2023) Employment up, education down, Labour market snapshot #96.
27 For example, see Wilson J, Bryson F, Campi C, Batten N and Tuan Anh Ly I (2020) Research Paper for the NSW Council of Social Service: Measurements of Precarious Employment in NSW and Australia, University of Sydney Policy Reform Project.
A few ideas to help meet the demand for new workers
A few ideas to help meet the demand for new workers
The education, training, and government response needed to help meet Victoria’s demand for new workers over the next few years is discussed in the Victorian Skills Plan for 2023 into 2024(opens in a new window). Further to what is covered in the plan, improved productivity, participation in education and employment and labour mobility will help Victoria meet its employment needs.
Improving labour productivity
Productivity is key to Victoria’s long-term prosperity. Productivity growth can be driven by strengthening education and training, which will also alleviate skills shortages in the labour market.
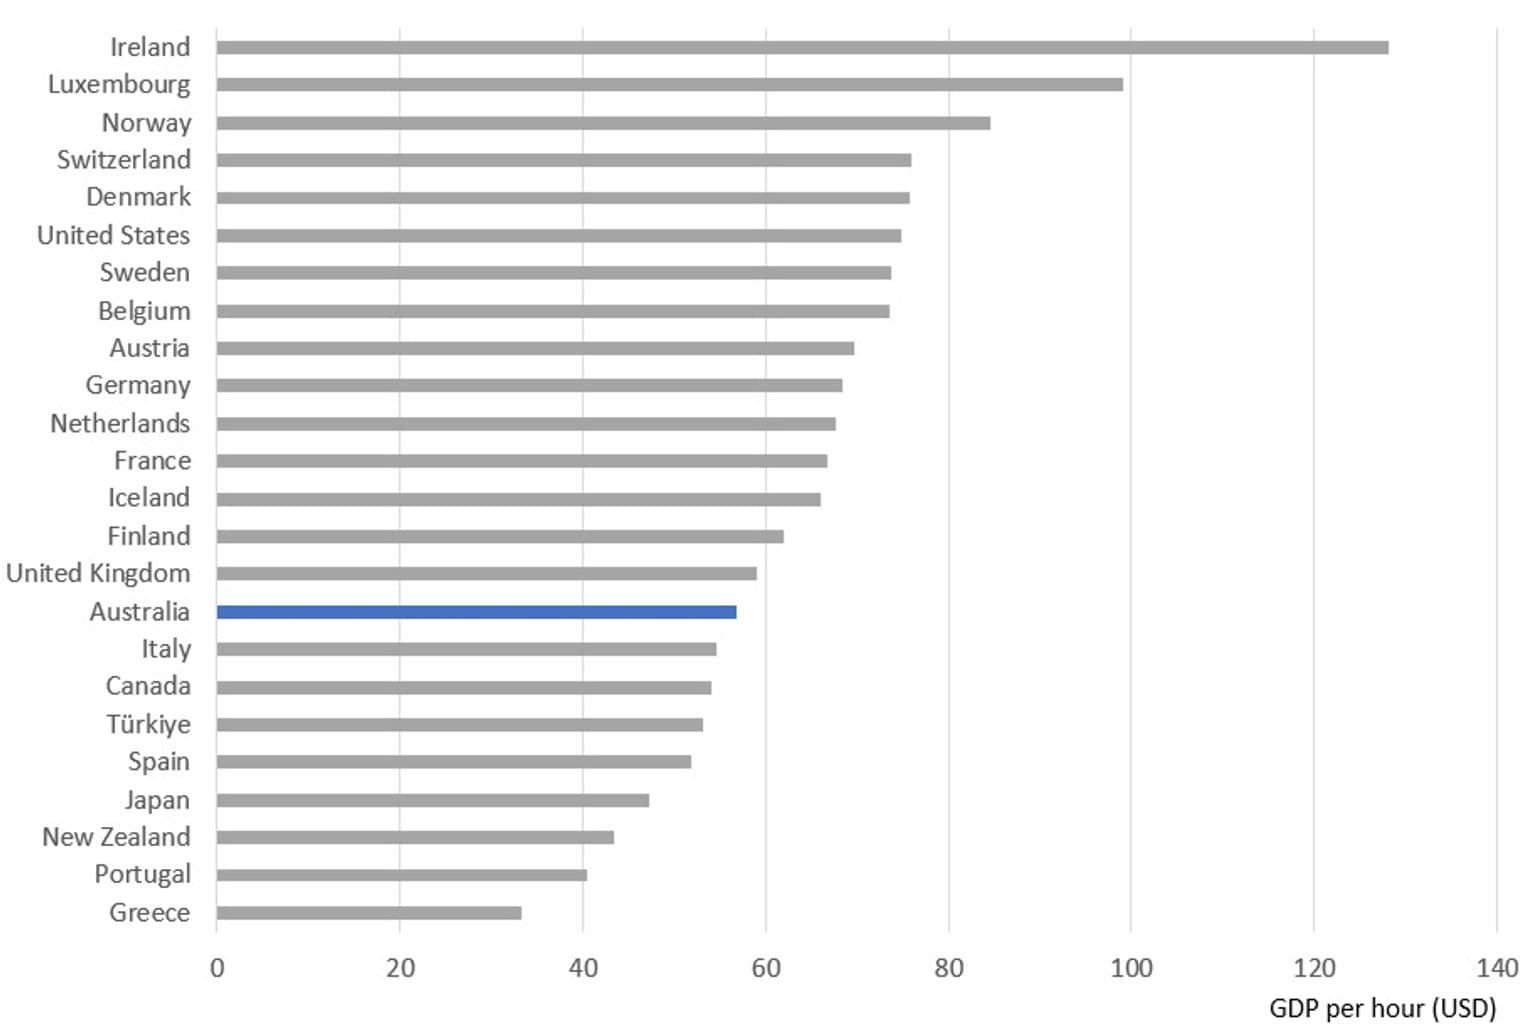
Australia’s productivity must improve. In 2021, Australia’s labour productivity levels were near the middle of the Organisation for Economic Cooperation and Development (OECD) rankings, placing 16th out of the 24 OECD countries (Figure 4.1).
Figure 4.1: Labour productivity across OECD countries US dollars (2021)
In recent years, labour productivity growth in Victoria is well above the previous labour productivity cycle, and is also slightly above the national average, with growth between 2017–18 and 2021–22 at 1.3% compared to the national average of 1.2%. In contrast, labour productivity growth in the previous labour productivity cycle for Victoria was below the national average (Table 4.1).28
Table 4.1: Labour productivity cycles, annualised growth
| State or territory | 2009–10 to 2017–18 | 2017–18 to 2021–22 (incomplete) |
| Northern Territory | 2.6% | 6.8% |
| Australian Capital Territory | 1.8% | 4.7% |
| South Australia | 0.3% | 1.6% |
| New South Wales | 1.5% | 1.5% |
| Victoria | 0.8% | 1.3% |
| Tasmania | 1.2% | 1.3% |
| Australia | 1.7% | 1.2% |
| Queensland | 1.8% | 0.6% |
| Western Australia | 3.3% | 0.5% |
Source: Australian Bureau of Statistics (ABS) Estimates of Industry Multifactor Productivity 2021–22.
While some factors may be structural, opportunities exist to further increase productivity in Victoria by supporting businesses to innovate through adopting new business models, practices, and technologies. As stated by the Productivity Commission, there is a large number of Australian businesses whose management practices, adoption of technology and productivity are below their best practice peers, with many undertaking little to no assessment of their performance. Therefore, much productivity improvement will involve the wider adoption of established technologies and practices among the 98% of businesses that are not directly creating new-to-the-world innovation.29
Innovation will also drive new business activity and create new demand for different and higher-order skills due to the rapid technological change. Skill requirements increase as technology can replace more routine tasks, freeing up workers to focus on higher-skill activities.30
New occupations will emerge, and in many existing occupations, the skills required for success will change. The idea of a job-for-life and a linear career path is becoming less relevant. This also means that most workers will need a basic skill level to adapt to the changing nature of work. Many will need some form of additional education and training (or up-skilling) for their knowledge and skills to be contemporary for advancement in their career.
Notes
28 Labour productivity growth is best measured over the business cycle (identified by the Australian Bureau of Statistics) as it can minimise the effects of some temporary influences (such as variations in capitalisation).
29 Productivity Commission (2023) Inquiry report, volume 5: Innovation for the 98%, Inquiry report – volume 5, p. iv.
30 Productivity Commission (2023) 5-year Productivity Inquiry: Advancing Prosperity, inquiry report – volume 1, p. 13.
Higher participation in education and employment
Many Victorians face challenges to participate in secure work
The Victorian labour market is characterised by near record-high labour force participation rates and very low unemployment rates. The strong labour market conditions are encouraging more Victorians into work or to actively look for work, with stronger chances of success compared to pre-pandemic levels.
Since 2019, regional Victoria has had even lower unemployment rates (3.1% compared with 3.7% in Victoria as at May 2023). However, the participation rate is also consistently lower (63.1% compared with 67.6% in Victoria).31 While this trend is consistent across most regional areas, there are disparities across the regions reflecting different levels of disadvantage across regions.
There has also been a shift in the duration of unemployment, with the proportion of long-term unemployed (defined as a duration of unemployment of 12 months or more)32 trending downwards since mid-2021.33
Despite the strong labour market, not all Victorians have been able to share the benefits that come with secure employment. Many Victorians face challenges to participate in secure work, which are often complex and multi-faceted. These barriers may include lack of appropriate skills, especially the lack of exposure to digital tools common in many workplaces, the risk of foregoing income support in return for work which may be insecure, the confidence to engage in work, lack of transport to access work, lack of housing, and ongoing caring responsibilities (or lack of flexibility in work to cater for such circumstances).
First Nations peoples as well as Victorians with disability face high unemployment rates in Victoria. First Nations peoples have an unemployment rate of 9.6%, while it is 12.2% for Victorians with disability – two to three times higher than the Victorian average (Figure 4.2). More detailed discussion on these cohorts is provided in the Victorian Skills Plan for 2023 into 2024(opens in a new window)
Figure 4.2: Unemployment and participation rates by demographic group, Victoria (May 2023) unless otherwise stated
| Category | Unemployment rate | Participation rate |
| Victoria | 4% | 68% |
| Women | 4% | 63% |
| Age 25–44 | 3% | 88% |
| Mature aged (45+) | 3% | 52% |
| Women (45+) | 2% | 47% |
| Postgraduate education | 2% | 88% |
| Completed Year 12 | 5% | 69% |
| Certificate III or IV | 3% | 73% |
| Bachelor's degree | 3% | 83% |
| Did not complete Year 12 | 7% | 39% |
| Diploma or advanced diploma | 3% | 75% |
| Graduate diploma or graduate certificate | 2% | 76% |
| Lone parents (children under 15) | 7% | 71% |
| Regional VIC (rest of VIC SA4) | 3% | 63% |
| Recent migrants (English speaking countries) | 7% | 91% |
| Recent migrants (other than English speaking countries) | 8% | 66% |
| Youth (15–24) | 8% | 70% |
| First Nations (2021) | 9.6% | 58.5% |
| Disability (2018) | 12.2% | 51.9% |
Note: where seasonally adjusted data are not reported by the Australian Bureau of Statistics (ABS) a three month average is calculated. However, a 12 month average is applied for the youth (15–24 years) cohort. A six month average is applied for recent migrants (arrived in Australia within the last five years). First Nations peoples are based on data from the ABS Census 2021. Disability is for people aged 15 to 64 years that reported a disability based on ABS, Disability, Ageing and Carers, 2018. Highest level of education attainment is based on quarterly data reported by the ABS as at May 2023.
Source: ABS, Labour Force, Australia, May 2023; ABS, Labour Force, Detailed, Australia, May 2023; ABS, Disability, Ageing and Carers, Australia: Summary of Findings, 2018; ABS, Census Tablebuilder, 2021.
Women face barriers entering work as they often carry a greater share of caring and domestic responsibilities, and face a gender pay gap, lack of workplace flexibility and industrial and occupational gender segregation.
Notes
31 Australian Bureau of Statistics, Labour Force, Australia, Detailed, May 2023.
32 The Organization for Economic Cooperation and Development (OECD) Long-term unemployment rate
33 The proportion of long-term unemployed is the number of long-term unemployed divided by the total unemployed. The sharp decline in the proportion of long-term unemployed in late 2020 was due to the increase in total unemployed, rather than a decline in long-term unemployed.
There are many potential workers in Victoria
Potential workers
Against the backdrop of a tight labour market with a strong trajectory for demand over the coming years, there is an imperative to work towards engaging individuals who face structural barriers to getting a job. The increasingly uncertain economic conditions, driven by cost of living pressures are likely to have a greater impact on individuals and communities who are already facing significant challenges. For many, participating and securing sustainable employment is one of the solutions that can help to alleviate and address some of these challenges.
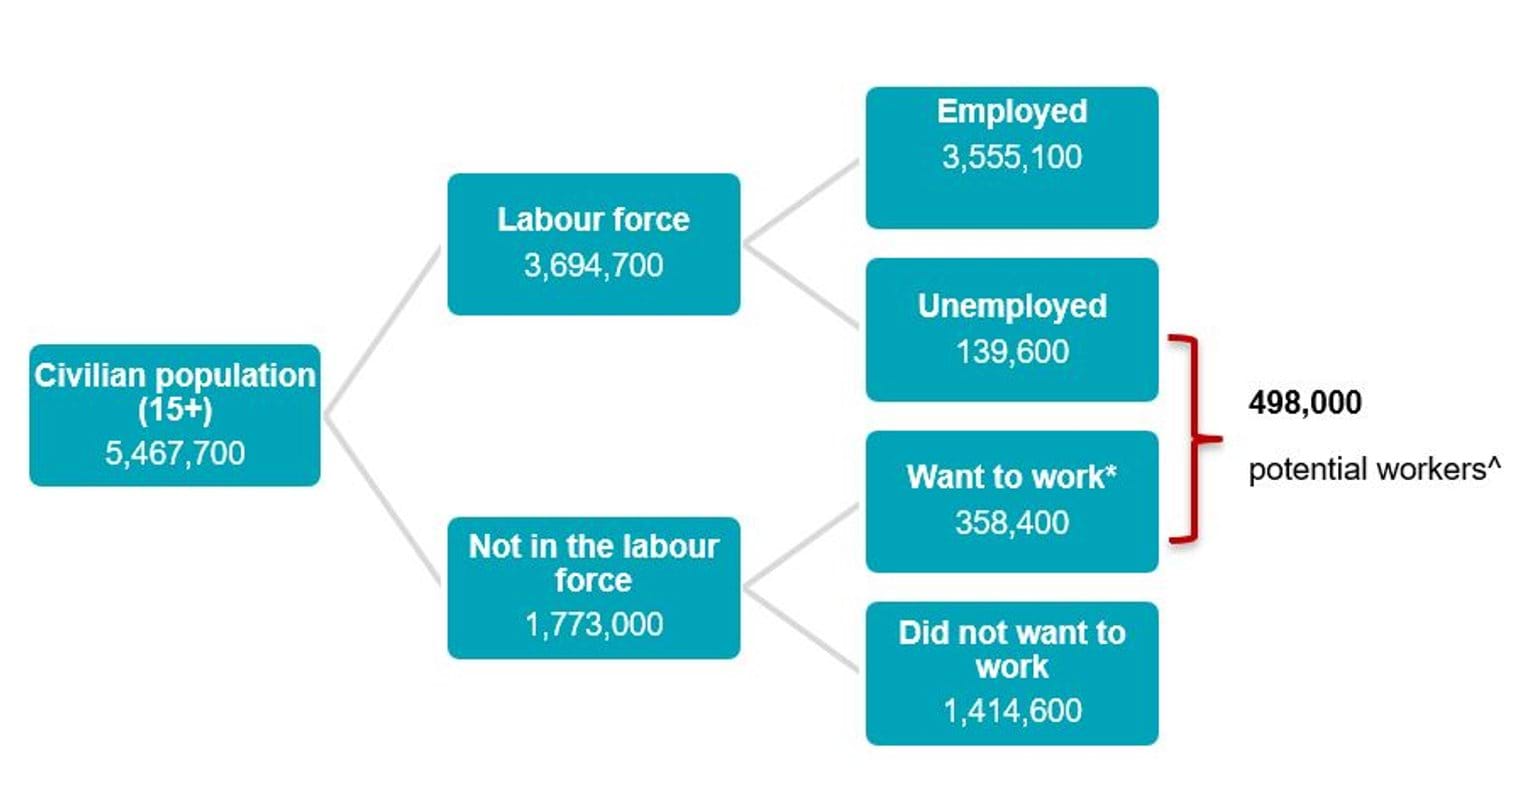
The tight labour market, characterised by worker and skills shortages, highlights the need to look beyond the formal workforce to increase the pipeline of workers. Many Victorians could work but are outside of the labour market for a variety of reasons and are not seeking work. There are currently around 498,000 potential workers in Victoria. In addition to the 139,600 potential workers who are defined as unemployed,34 there are 358,400 individuals who want to work, though they may not be available to start immediately (Figure 4.3).35 From these individuals, 204,100 could start work within four weeks. The most common reasons why these individuals are not actively looking for work is due to studying commitments (22.6%), caring for children (12.2%), had no need to work (11.0%), and long-term health issues (9.7%).36
While this number of potential workers has declined from a peak of 594,400 in 2021, most of the decline has been in the number of unemployed rather than the individuals outside of the labour market who want to work.
Figure 4.3: Victorian population’s interaction with the labour force (February 2023)
New Victorian Government initiatives relating to skills
The Victorian Government has made several new commitments relating to skills which aim to boost participation in training in Victoria and support worker supply. Through changes in eligibility criteria, the Victorian Government is expanding access to government-subsidised training through Skills First and Free TAFE to support re-skilling and upskilling. Skills First subsidised courses are now available to people with higher-level qualifications, allowing Victorians to re-skill in areas of skilling priority. Additionally, individuals who have already completed a Free TAFE course may also be able to access additional Free TAFE places if they are continuing a selected training pathway.
The Victorian Government’s work to achieve net-zero emissions by 2045 will create new demand for jobs and enormous reskilling opportunities. The Victorian Government is also bringing back the State Electricity Commission (SEC), which will drive down cheaper power bills, and create government-owned renewable energy.
Projections from the Clean Economy Workforce Development Strategy show that around 10,000 additional jobs per year will be required for renewable energy transition from now until 2030. Growth of new sectors and development of emerging technologies will deliver new jobs and up-skilling of almost 500,000 workers.37
These projections have a longer time period than the forecasts in this report, which are for new workers expected between 2023 and 2026. Further, these projections are dispersed across multiple industries, including electricity, gas, water and waste services, construction (for new renewable energy generation for example) and manufacturing (for manufacturing electric vehicles for example).
As stated in Victoria’s Housing Statement, the Victorian Government has set a target to build 800,000 homes in Victoria over the next decade, supporting 16,000 jobs.38 Developing the workforce is key to supporting the housing target and Victoria’s vocational and education training system plays a critical role in preparing the workers for the range of jobs that will be in demand, such as through Free TAFE.
Notes
34 Australian Bureau of Statistics, Potential workers, February 2023.
35 This includes individuals who wanted to work but did not fall into the category of unemployed as they were either not actively looking or were not available to work in the last week. It also includes those who had a job to go to but were not available to work within one to four weeks.
36 Australian Bureau of Statistics, Potential workers, February 2023.
37 Victorian Government (2023) Clean Economy Workforce Development Strategy 2023 to 2033(opens in a new window)
38 Victorian Government (2023) Victoria’s Housing Statement – the decade ahead 2024 to 2034(opens in a new window), 20 September.
The critical role of labour mobility
Labour market mobility
Dynamism within and across industries due to a range of global factors (such as restructuring post-COVID-19 and building new sovereign capabilities) and local factors (new industries such as clean economy) will require workers to develop and upgrade skills so they can move to fill new opportunities.
Labour market mobility helps workers move to where new jobs are available and helps the economy adjust to economic shocks and structural change. In particular, it gives workers the freedom to move into jobs that provide better pay and working conditions (for example, more suitable hours of work and better workplace flexibility, job satisfaction or job security). It also underpins the efficient operation of the labour market and improves productivity by allowing for better job matching to fit the preferences and skills of workers, as well as increased labour reallocation to more productive firms.39
Labour market mobility is linked to the business cycle. In a weak labour market, a person may move for more stable employment, while in a strong labour market employers may use incentives (such as better pay and conditions) to influence labour mobility. Changes across industries and regions push individuals and businesses to look for new opportunities in new areas. Individuals may also change jobs for personal reasons.40
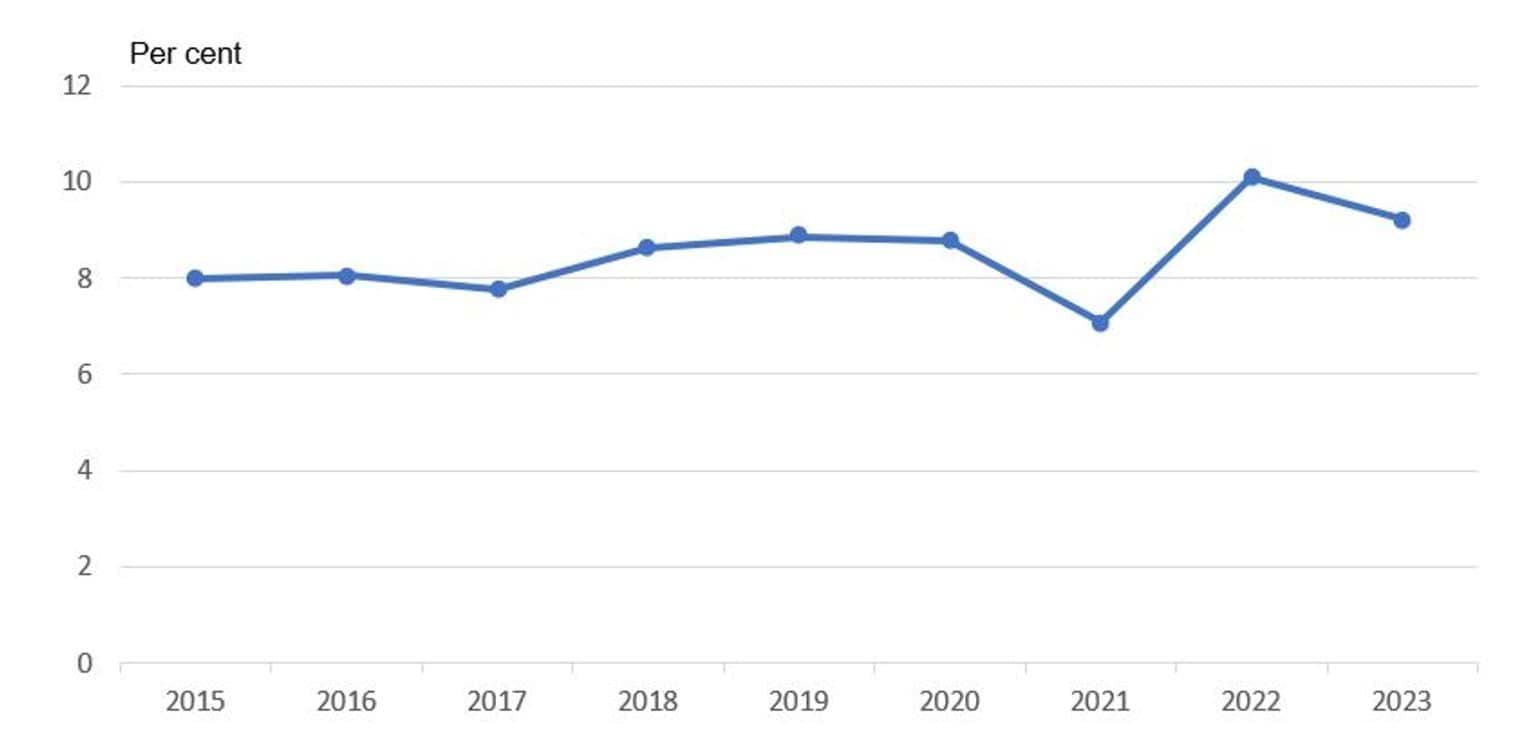
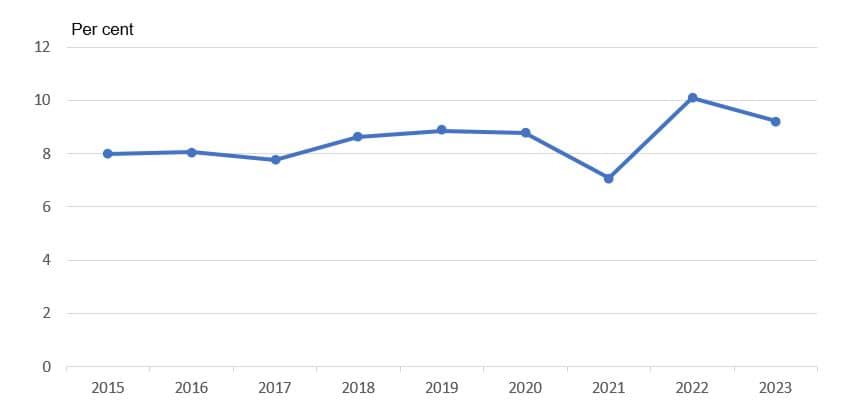
Over the year to February 2023, 327,800 people changed jobs in Victoria, accounting for 9.2% of employed Victorians. While this rate has declined from 10.1% in 2022, job mobility remains elevated compared with rates since 2015. This has coincided with the strong labour market conditions and relatively weak wages growth, which encourages employees to look for other jobs in pursuit of better wages and conditions (Figure 4.4).
Figure 4.4: Proportion of employed Victorians who change jobs over the past 12 months (2015 to 2023)
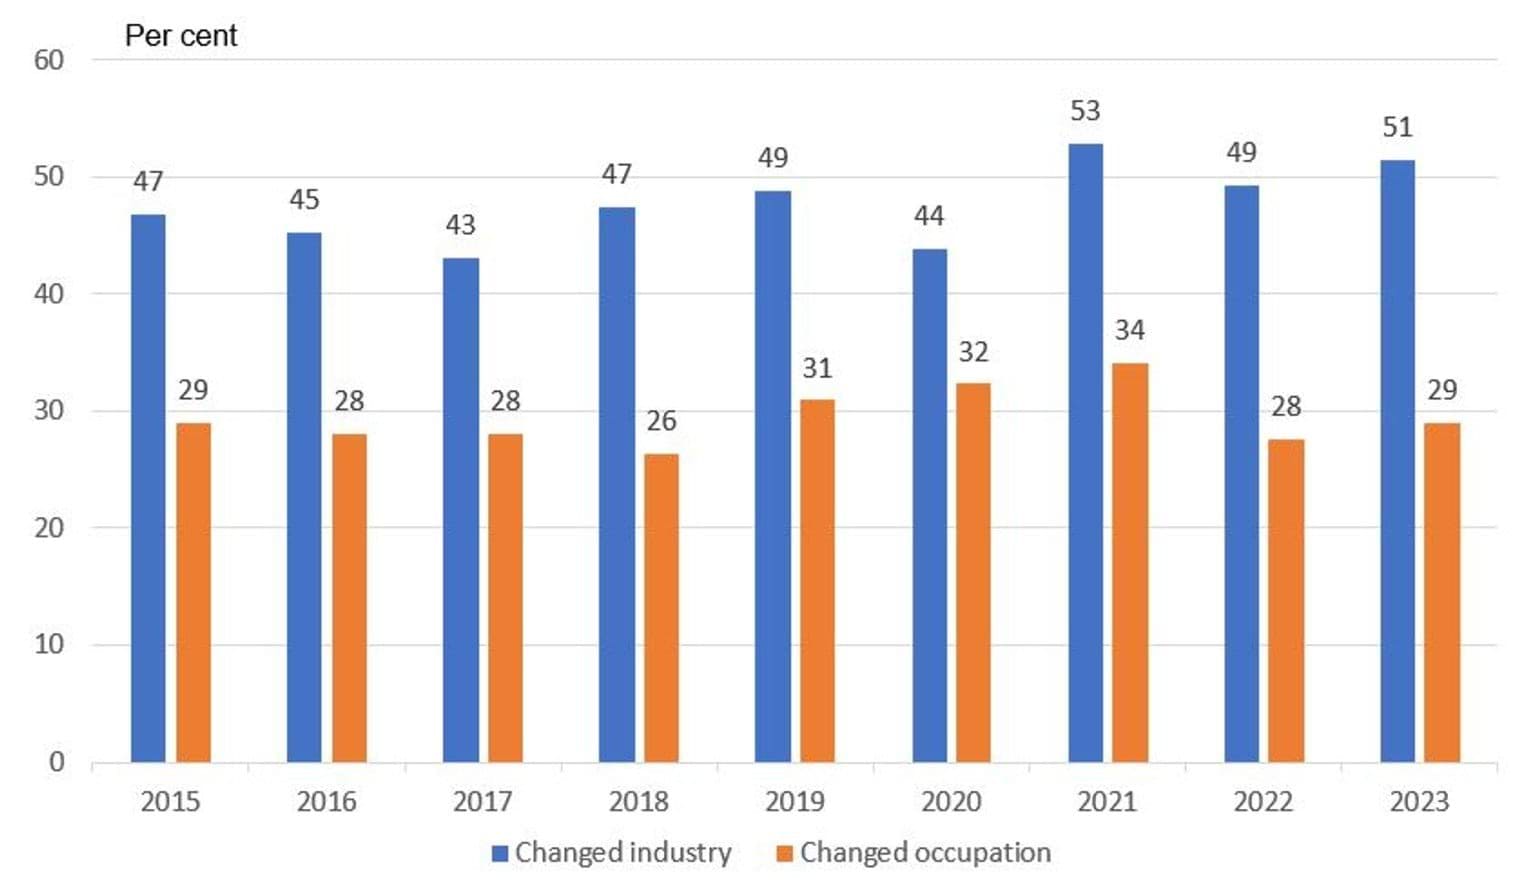
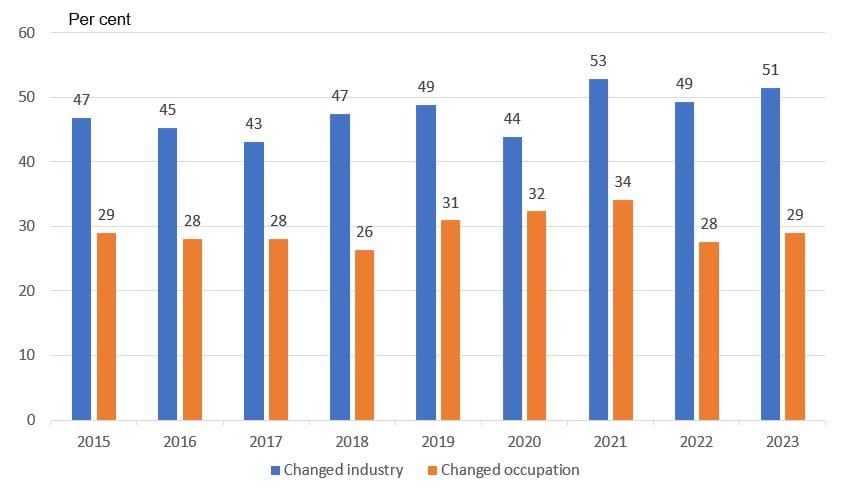
Of the Victorians who changed jobs over the year to February 2023, around half changed industry and around three in 10 changed occupation. This characteristic of worker mobility has been broadly consistent since 2015 (Figure 4.5).
Figure 4.5: Proportion who changed industry or occupation for Victorians who changed jobs over the past 12 months (2015 to 2023)
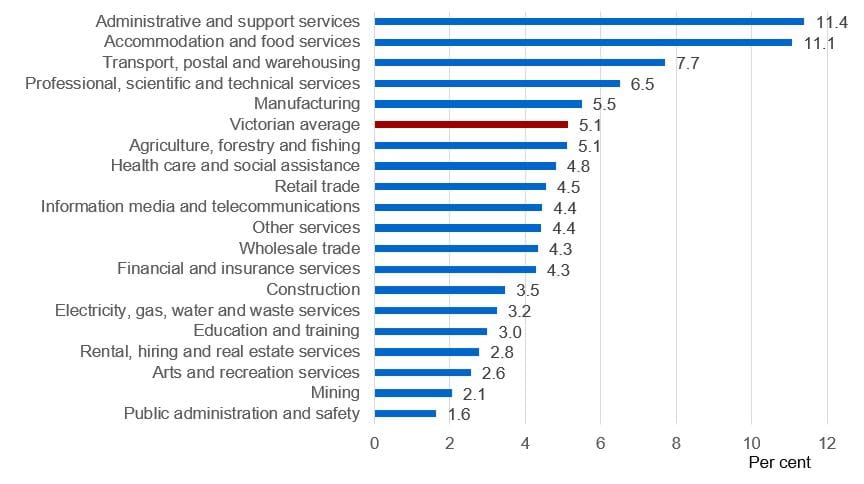
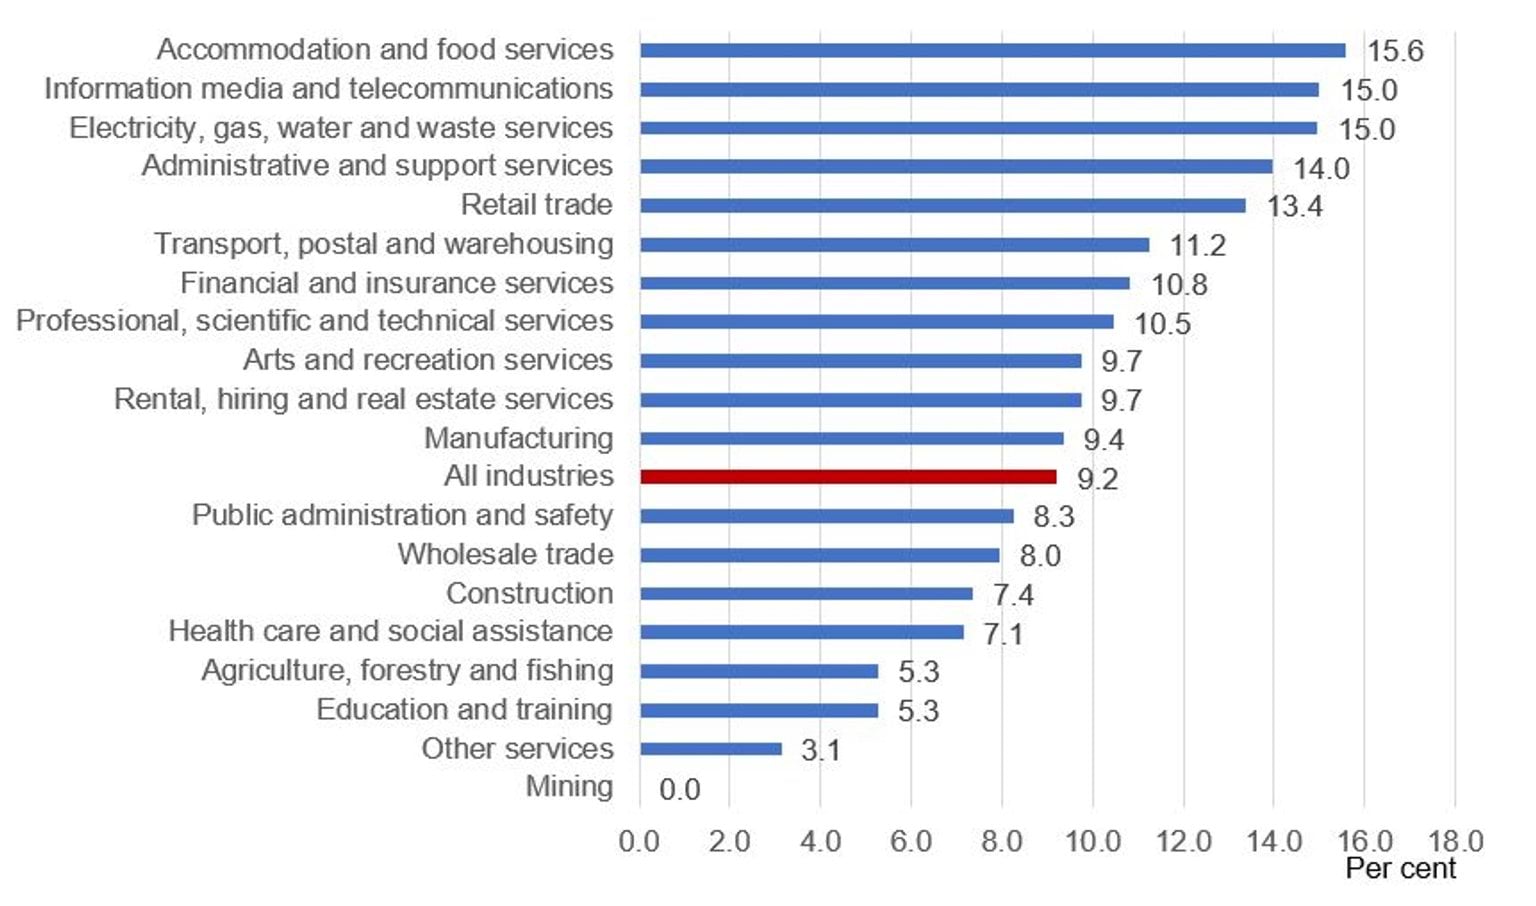
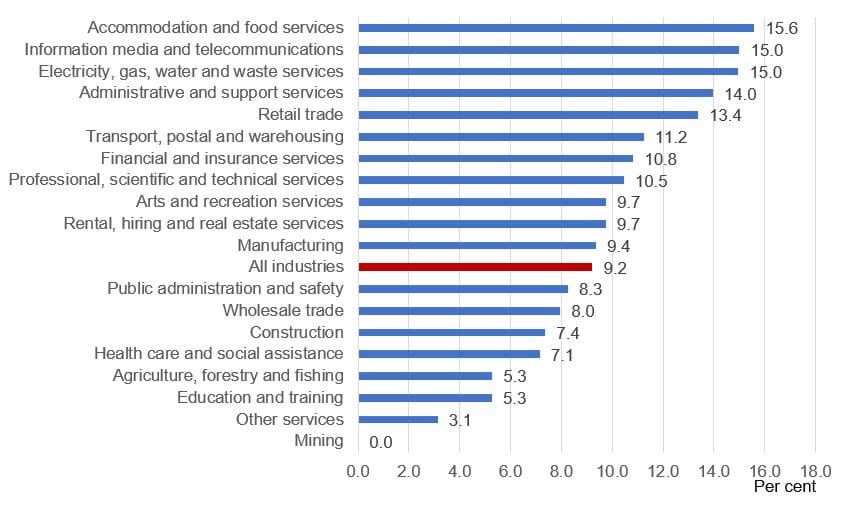
Accommodation and food services, information media and telecommunications, electricity, gas, water and waste services, administrative and support services, and retail trade had the highest proportion of employed Victorians who changed jobs over the year to February 2023 (Figure 4.6). For most industries (13 out of 19 industries), the proportion of employed Victorians who changed jobs is above their 3 year pre-COVID-19 average.
Figure 4.6: Proportion of employed Victorians who changed jobs over the past 12 months by industry (2023)
Notes
39 Black S and Chow E (2022), Job mobility in Australia during the COVID-19 pandemic(opens in a new window), Reserve Bank of Australia, Bulletin, June.
40 Atkinson G and Hargreaves J (2014), An exploration of labour mobility in mining and construction: who moves and why(opens in a new window), National Centre for Vocational Education Research (NCVER) occasional paper.
Job mobility analysis
Net movement of workers by industry
An analysis of job mobility by industry considers the proportion of employed Victorians in each industry who changed jobs. Another aspect of job mobility per industry is the proportion of workers entering and leaving that industry over a 12 month period. The difference in these proportions is the net movement of workers, which represents whether an industry is a net importer of workers (that is, they are gaining workers due to job mobility) or net exporter of workers (that is, they are losing workers due to job mobility).
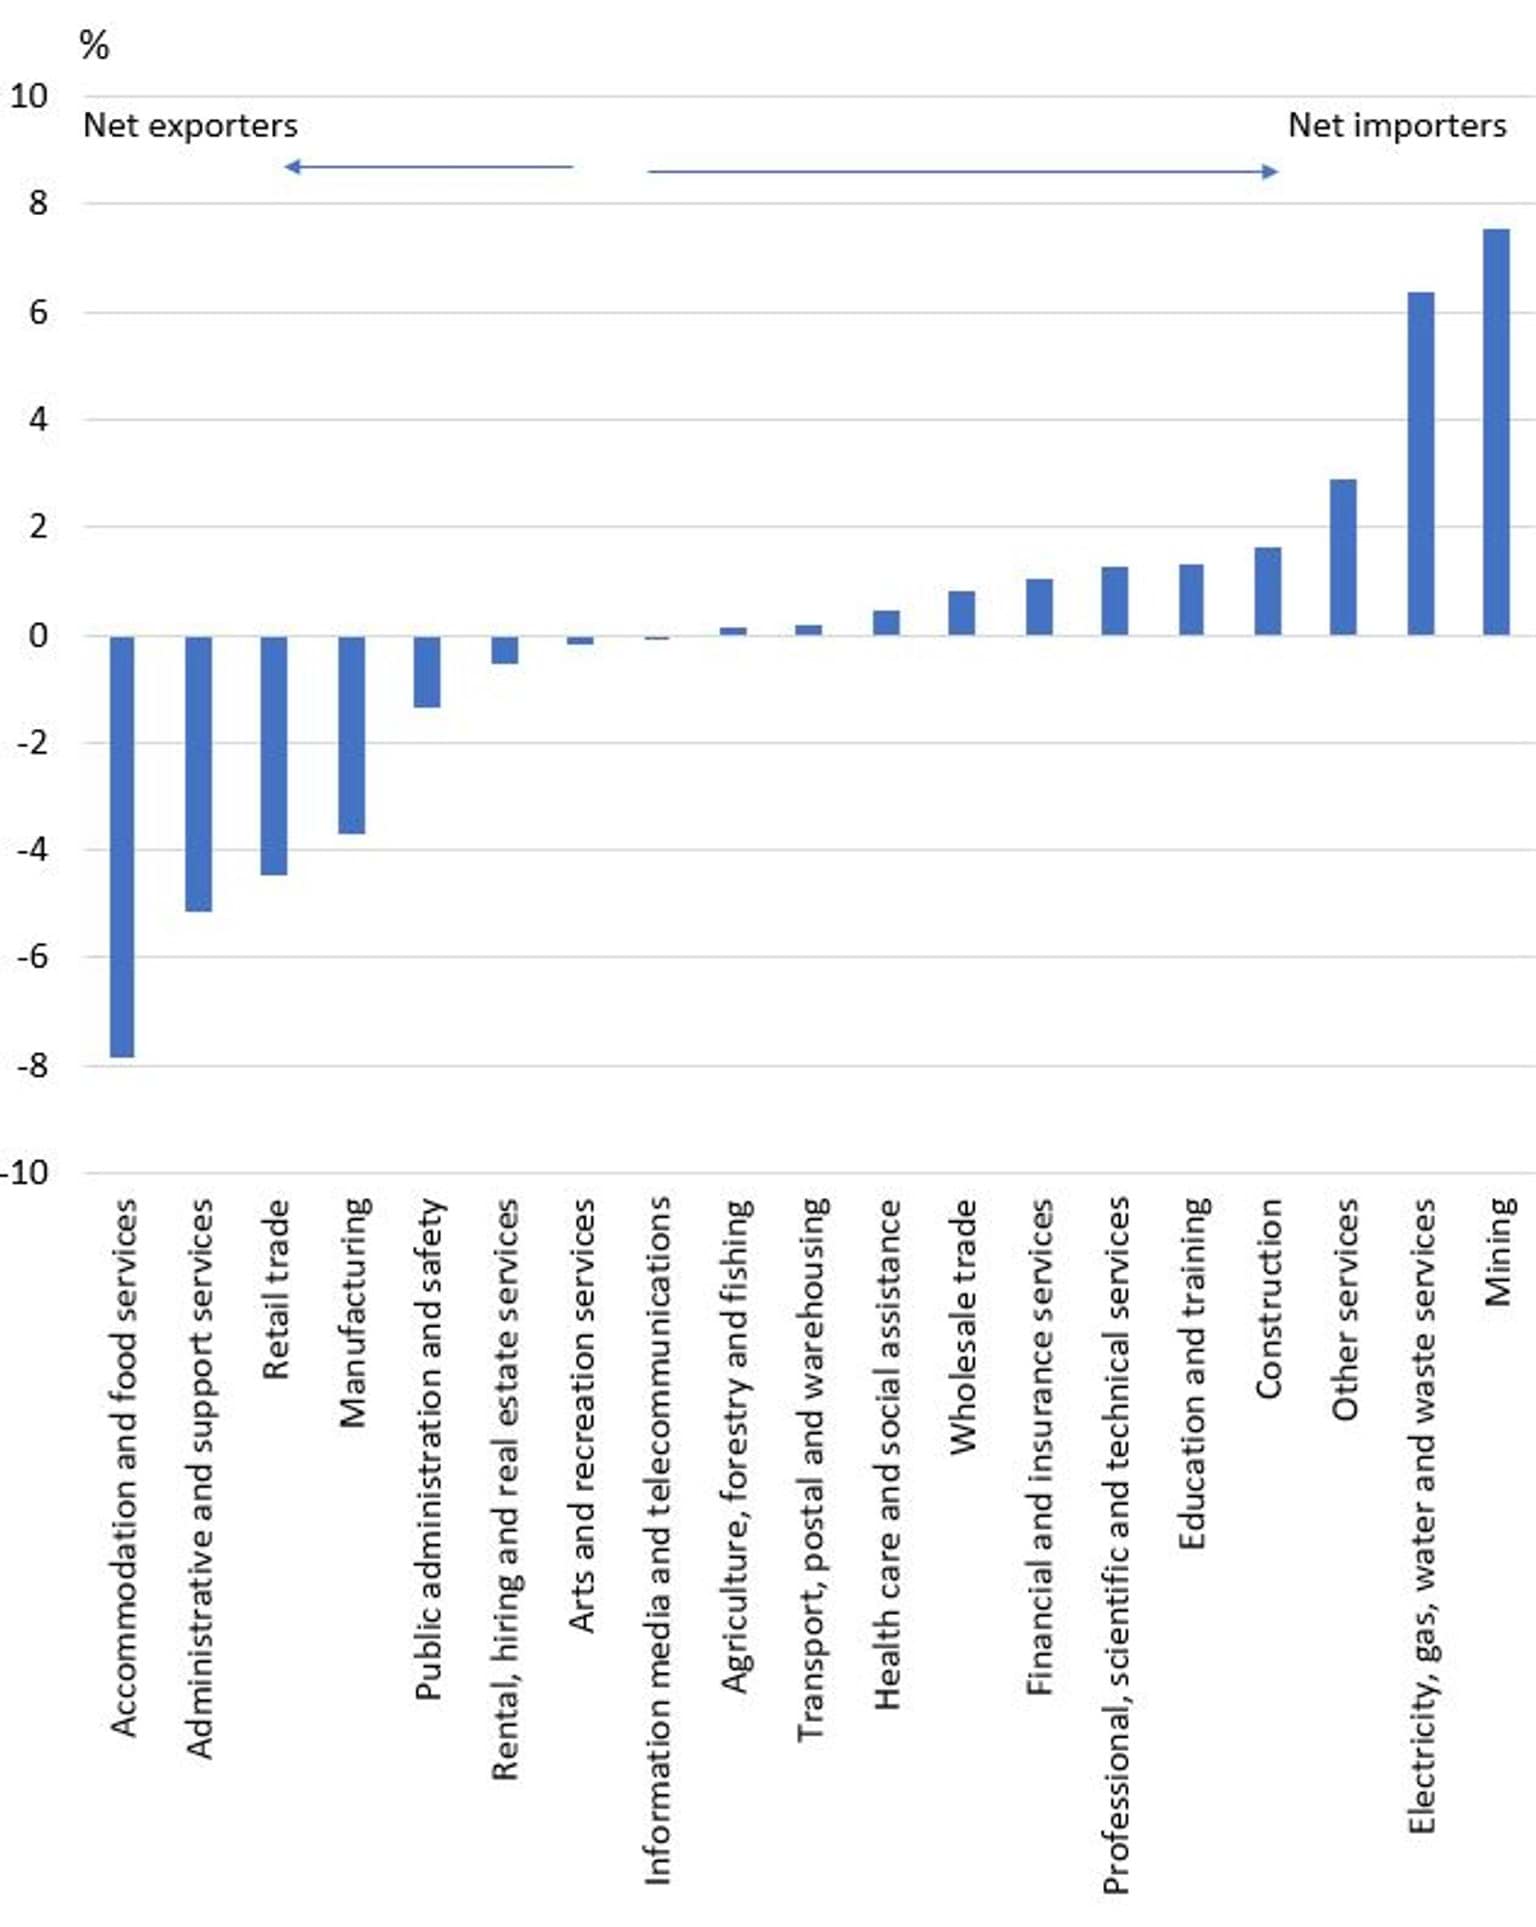
Mining and electricity, gas, water and waste services were the largest net importers of workers. In contrast, accommodation and food services, administrative and support services, and retail trade were the largest net exporters of workers (Figure 4.7).
Figure 4.7: Net movement of workers by industry, Victoria (over the year to February 2023)
Net importers and exporters by industry and years
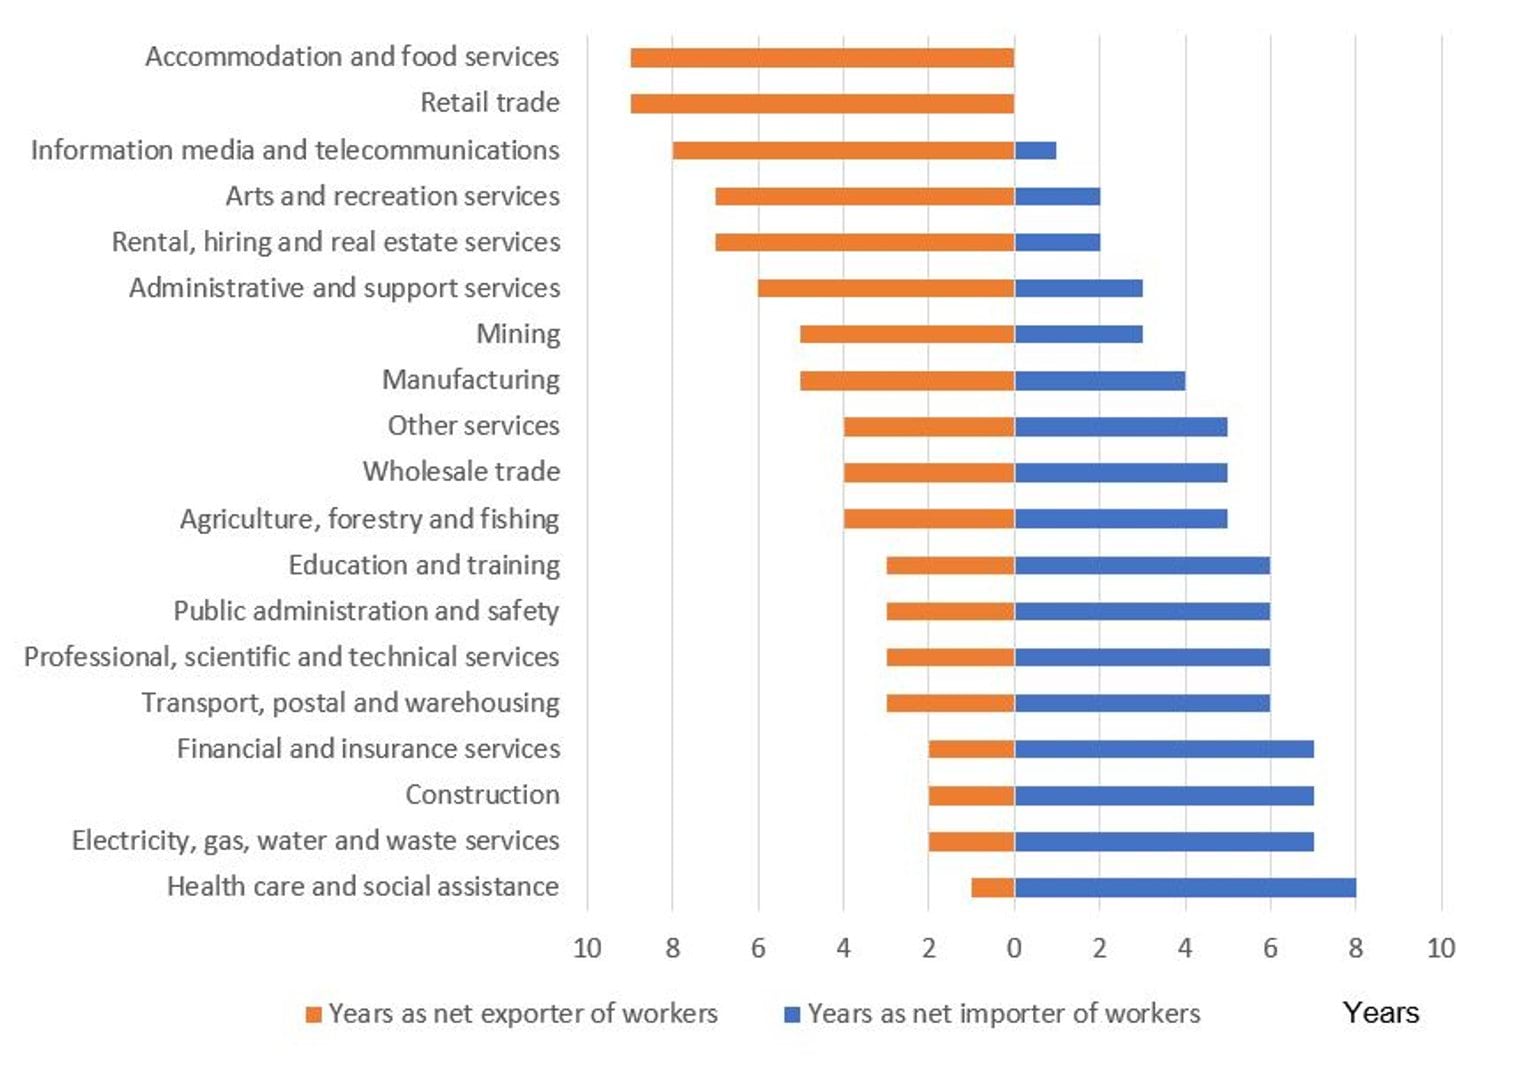
As these trends can be volatile, Figure 4.8 shows the number of years that an industry was a net importer and net exporter since 2015. Health care and social assistance, electricity, gas, water and waste services, construction, and financial and insurance services had the highest number of years as a net importer of workers. These industries benefited the most from workers changing jobs over the period.
In contrast, accommodation and food services and retail trade were net exporters of workers for the whole period. These industries lost workers due to job mobility every year since 2015, and acted as a stepping stone for workers to transition to jobs in other industries.
Figure 4.8: Number of years an industry was a net importer or exporter of workers (since 2015) Victoria
Appendix A: Employment forecast methodology
Methodology
The Victorian Skills Plan for 2023 into 2024(opens in a new window) forecasts of employment growth, retirements and new workers expected come from the Victorian Skills Authority Employment Model 2023.
It is a ‘stock and flow’ model, comprising:
- the total number of workers in employment – the stock – across Victoria’s industries, occupations and regions from 2023 to 2026
- the entry and separation of workers to and from occupations – the flow – over the same period for the same breakdowns.
Regions in metropolitan Melbourne and regional Victoria reflects the place of work of the employee, rather than the place of residence.41
The stock estimates were developed by the Centre of Policy Studies with its Victoria University Employment Forecasting (VUEF) model of the Australian economy. The VUEF uses a dynamic computable general equilibrium framework in which linkages between all major sectors of the economy are represented. It incorporates a large body of macroeconomic, employment and demographic data and is calibrated to key forecasts and projections, including:
- Department of Treasury and Finance – total employment and dwelling investment forecasts
- Department of Transport and Planning – Victoria in Future population projections forecasts
- Reserve Bank of Australia – GDP, household consumption, terms of trade and other forecasts.
The Victorian Skills Authority (VSA) consulted widely across the Victorian Government to refine the forecasts. The final results reflect advice from the extensive workforce modelling and sectoral experience across infrastructure, social services, education, early education, clean economy, regional economic development and other areas. Where possible, the forecasts reflect known government policy and investments, for example, implementation of the Best Start, Best Life early childhood education reforms across the state.
The flows were developed by the VSA and they include the number of retirements each year. The VSA estimates retirements by applying occupation specific retirement rates to the stock employment forecasts. Retirement rates were derived from the Australian Census Longitudinal Dataset by identifying the share of workers over 50 years who leave the labour force each year.
New workers expected is an estimate of demand for workers to join an industry, occupation or region. In this analysis, demand comes from growth in employment (as business, government and other employers expand their operations) and the need to replace retirees who leave the workforce.
The number of new workers expected between 2023 and 2026 is calculated as the simple sum of employment growth (the change in stock of employment) and retirements. Employment for 2023 and 2026 is the estimated stock of employment at the commencement of the calendar year. Employment growth, retirements and new workers expected represent changes in employment over the calendar years.
This year’s employment model makes substantial improvements on last year’s model. Previously, the VSA benchmarked its forecasts to the National Skills Commission employment projections, and broke down national data to detailed occupations, industries and regions using ABS Census and other data. The VUEF significantly improves the disaggregation process, particularly by incorporating Victoria in Future population projections, which gives a more robust spatial picture of growth across the regions. Calibration to Victorian Treasury forecasts also ensures quality and consistency across the Victorian Government.
Notes
41 For information on how these regions are defined, see Department of Jobs, Skills, Industry and Regions (2023), Metropolitan Partnerships(opens in a new window); Regional Development Victoria, Regional Partnerships(opens in a new window).
Appendix B: Metropolitan and regional summaries
Metropolitan and regional summaries
Table B1: Proportion of new workers expected by industry across each region in metropolitan Melbourne (2023 and 2026)
Table B2: Proportion of new workers expected by occupation across each region in metropolitan Melbourne (2023 and 2026)
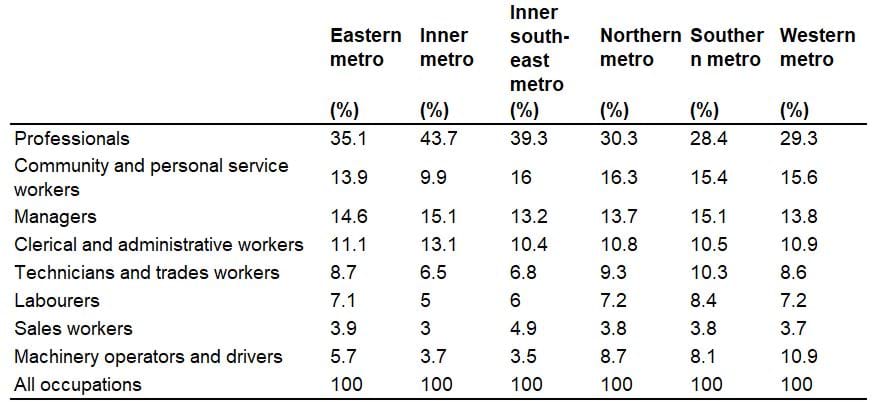
Table B3: Proportion of new workers expected by industry across each region in regional Victoria (2023 and 2026)
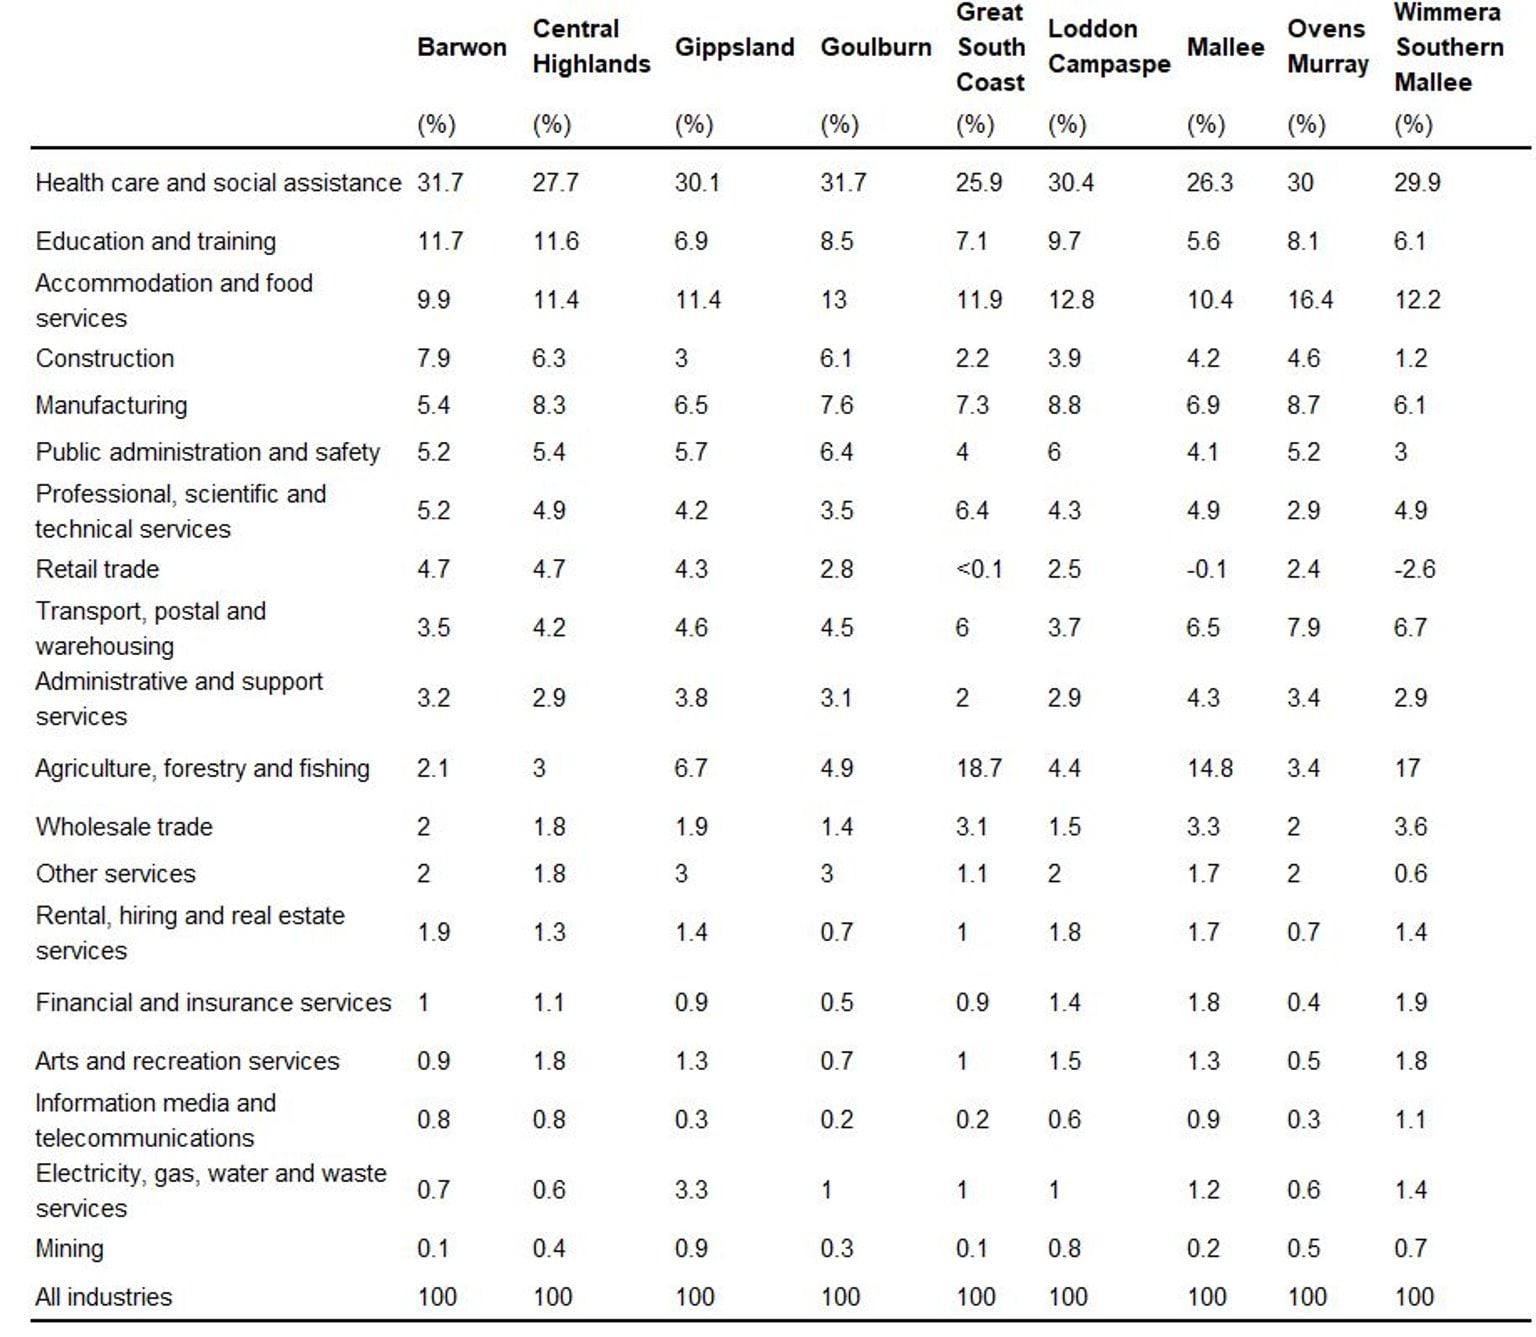
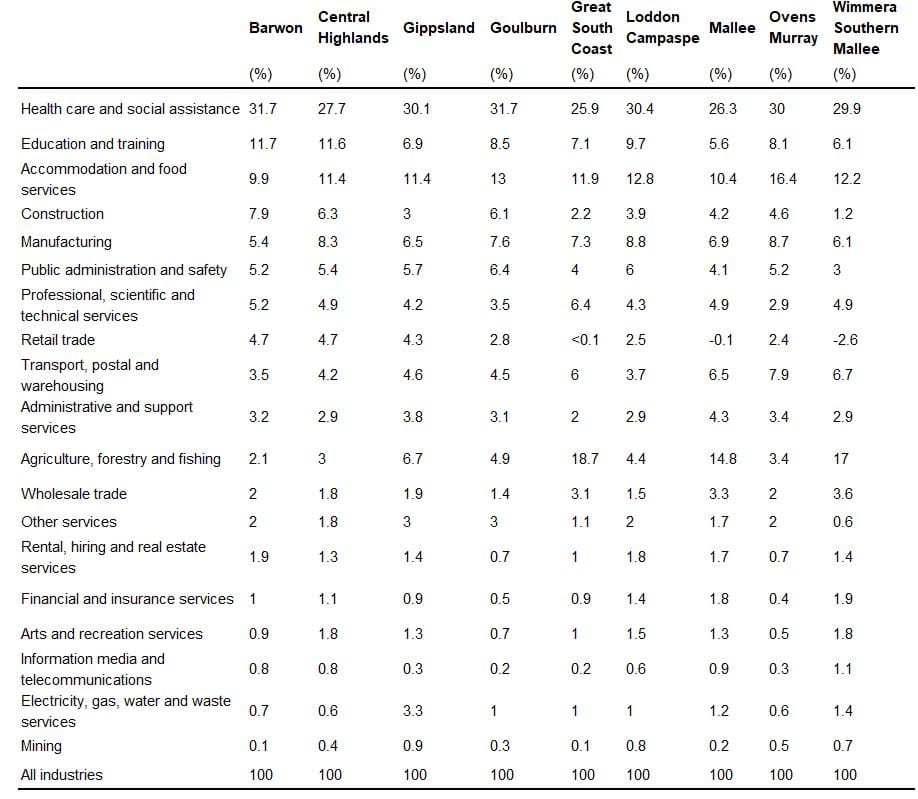
Table B4: Proportion of new workers expected by occupation across each region in regional Victoria (2023 and 2026)
Appendix C: Qualitative evidence on the influences on employment growth by industry
Qualitative evidence
In addition to the influences on employment growth across the whole labour market, there are specific demand and supply factors for each industry, some of which are discussed below. Insights discussed come from the modelling commissioned by the Victorian Skills Authority as well as information from the 10 Industry Advisory Groups (IAGs) who provide critical on-the-ground insights and intelligence for Victorian industries.
This appendix focuses on employment growth forecasts between 2023 and 2026, which is not the same as new workers expected presented throughout the report. This is because employment growth does not include workers retiring over the period.
Employment growth in some industries will grow much faster than the Victorian average of 1.3%, such as health care and social assistance (3.1%) accommodation and food services (3.1%), and education and training (2.5%).
However, some industries are facing a decline in employment, such as agriculture, forestry and fishing (-0.8%), retail trade (-0.6%), other services (-0.2%), and construction (-0.1%).