This report is informed by the Country Fire Authority’s (CFA) and Fire Rescue Victoria’s (FRV) respective outcomes framework progress updates for the quarter 2 (Q2) 2023-24 reporting period (1 October to 30 December 2023).
In this quarter, FRV reported on 19 measures against 12 quarterly indicators in its outcomes framework and CFA reported on all quarterly indicators in its 2022-23 outcomes framework.
The December 2022 cyber-attack continues to impact on FRV's data availability and its ability to fulsomely report against all the indicators in its outcomes framework. FSIM understands that FRV continues to work to restore its IT systems (AIRS and FireCode) for future reporting and advises that FireCode will be restored by June 2024 and AIRS will be restored for reporting from 1 August 2024.
Industrial action continues to impact data quality for some FRV indicators. False alarm data (captured in three of FRV’s indicators - 1.2.3, 1.3.3 and 3.4.1b) is not being recorded correctly, and the reported result for this quarter may be comparatively lower than Q2 FY2022-23. Separately, FRV has not been able to access total fleet availability data (measure 2.1.3b) in the regions for formal reporting against their outcomes indicator due to protected industrial action by some CFA staff.
Agencies’ results have been reported by exception under FSIM’s reporting criteria:
Demonstrates a notable achievement:
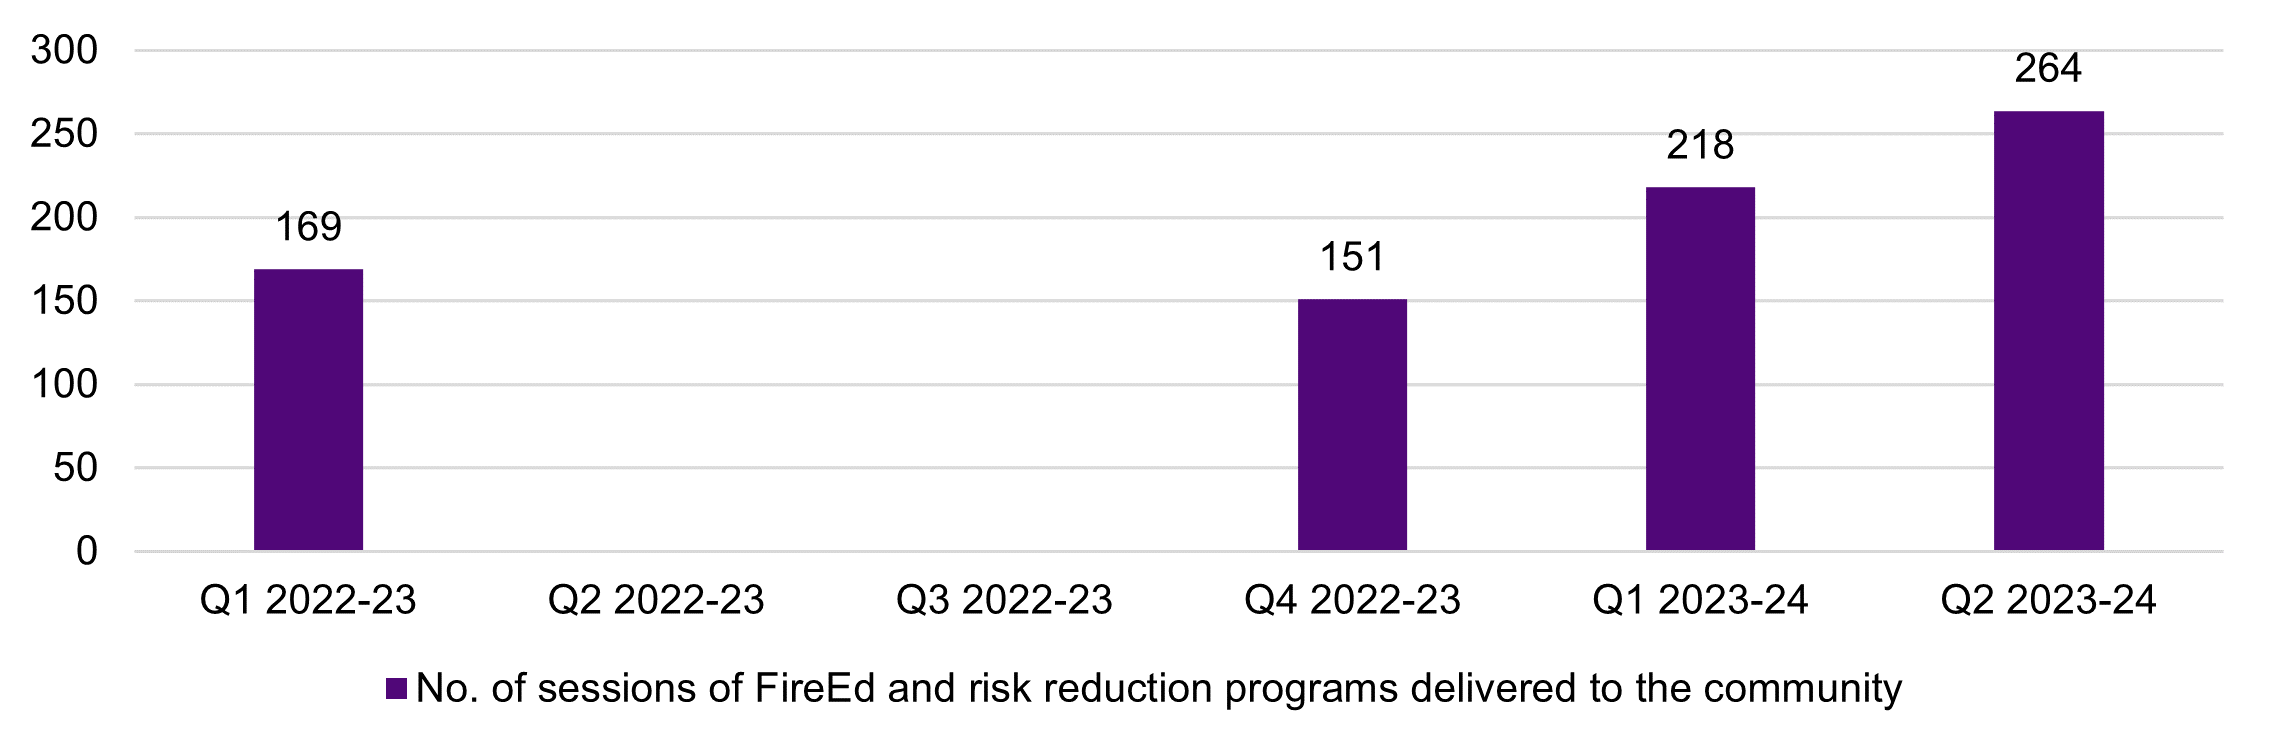
- FRV had a 21 per cent increase (since the last quarter) in its delivery of fire education and risk reduction programs, with 264 programs delivered this quarter.
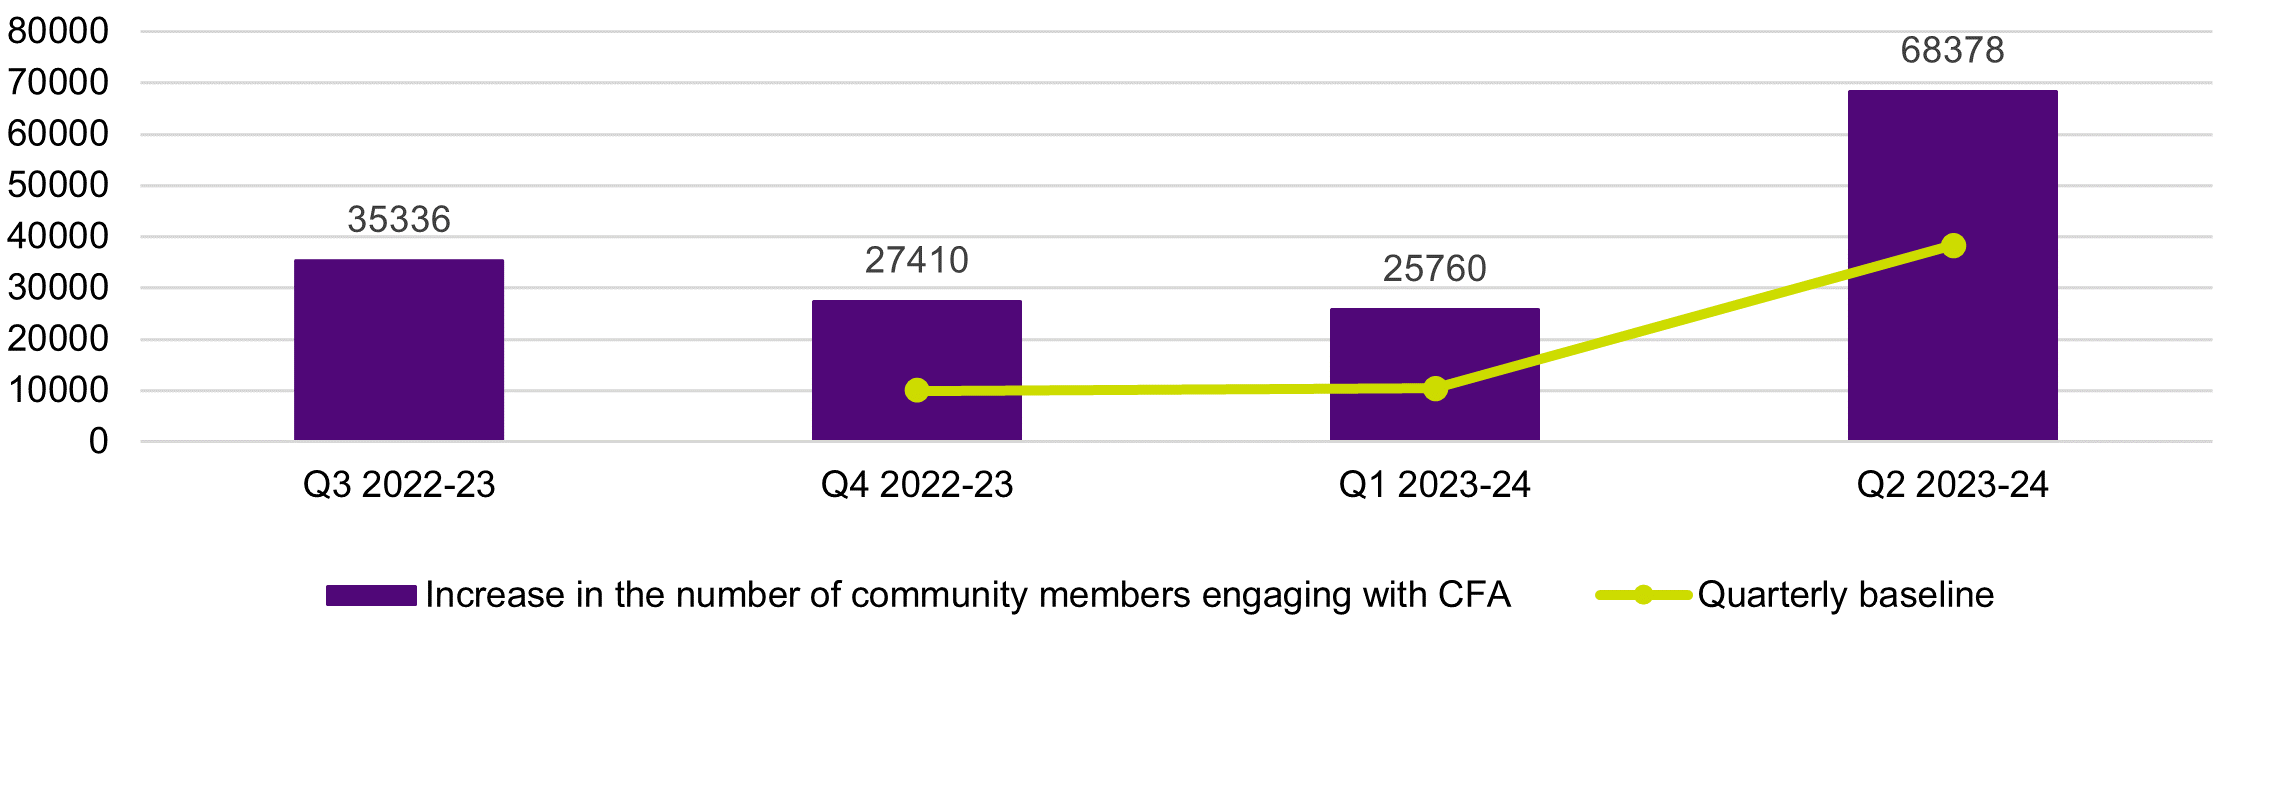
- CFA increased its community engagement by 165 per cent since last quarter, engaging with 68,378 community members through a range of forums including fire safety planning workshops, community events and school education programs.
Continuing off-track trend over repeated quarter:
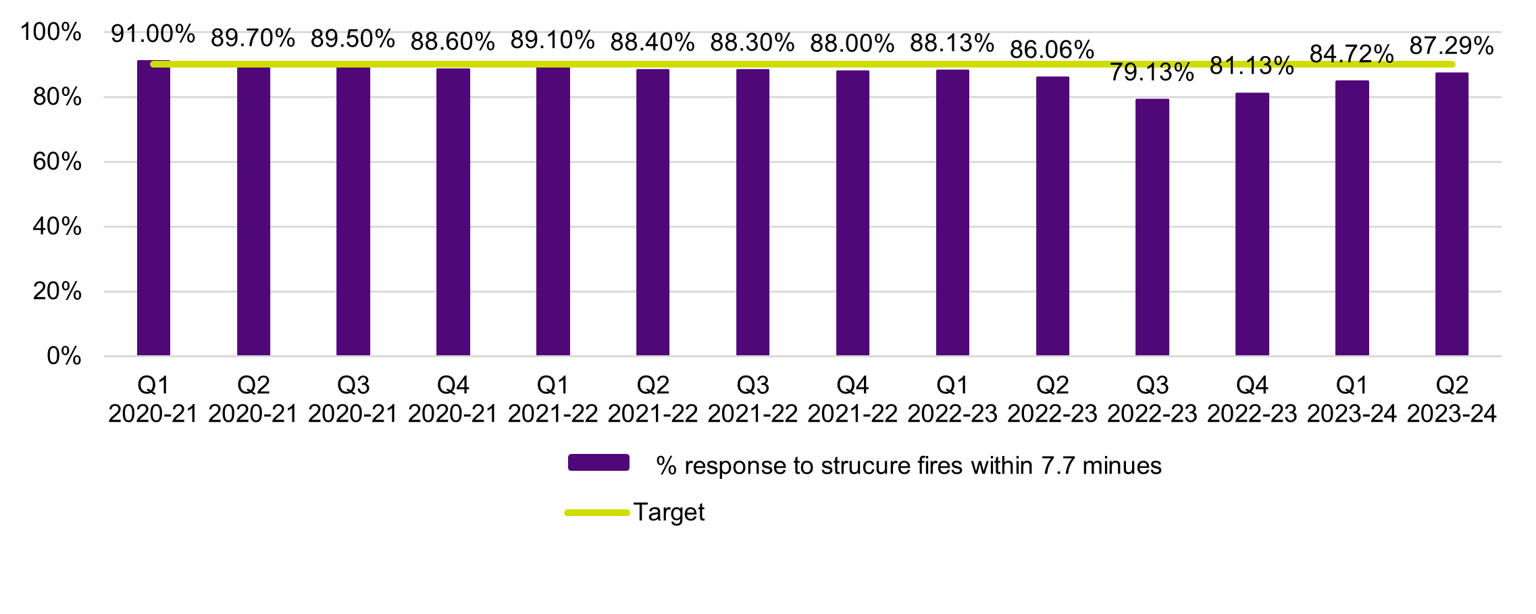
- FRV did not meet their 90 per cent target for the measure ‘percentage of response to structure fire incidents within 7.7 minutes’ for the thirteenth consecutive quarter (i.e. since Q2 2020-21). This quarter, FRV recorded a result of 87.29 per cent for response times to structure fire incidents within 7.7 minutes.
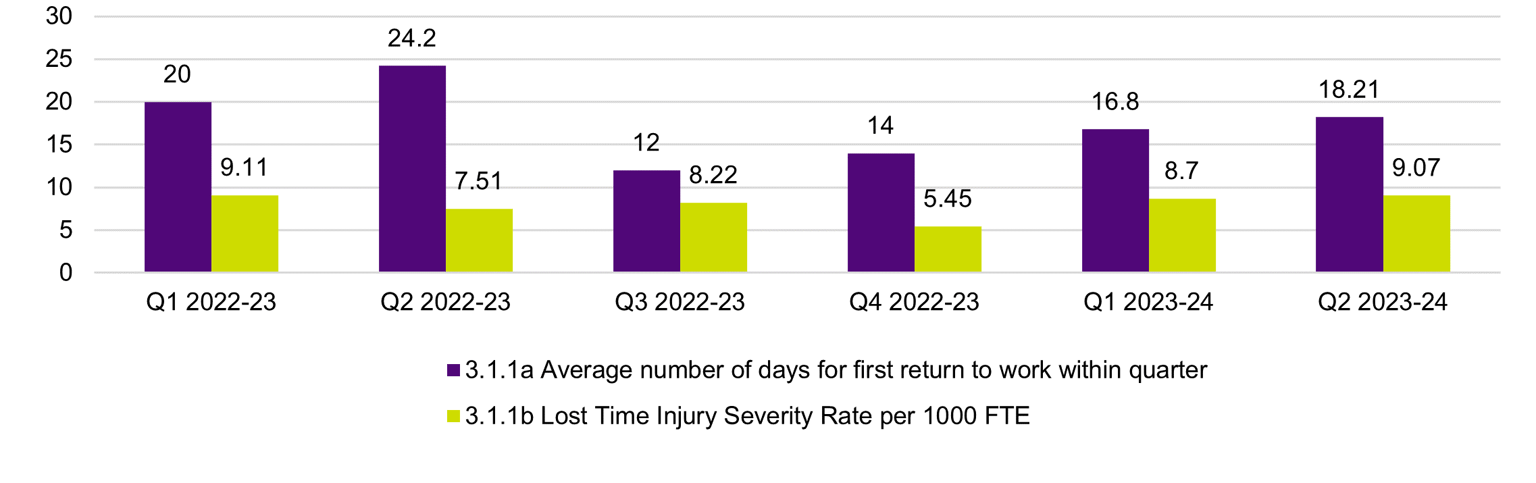
- FRV has reported reduced performance in all measures under the indicator ‘increase support and maintenance of firefighters’ physical and psychological health’ since Q4 2022-23.
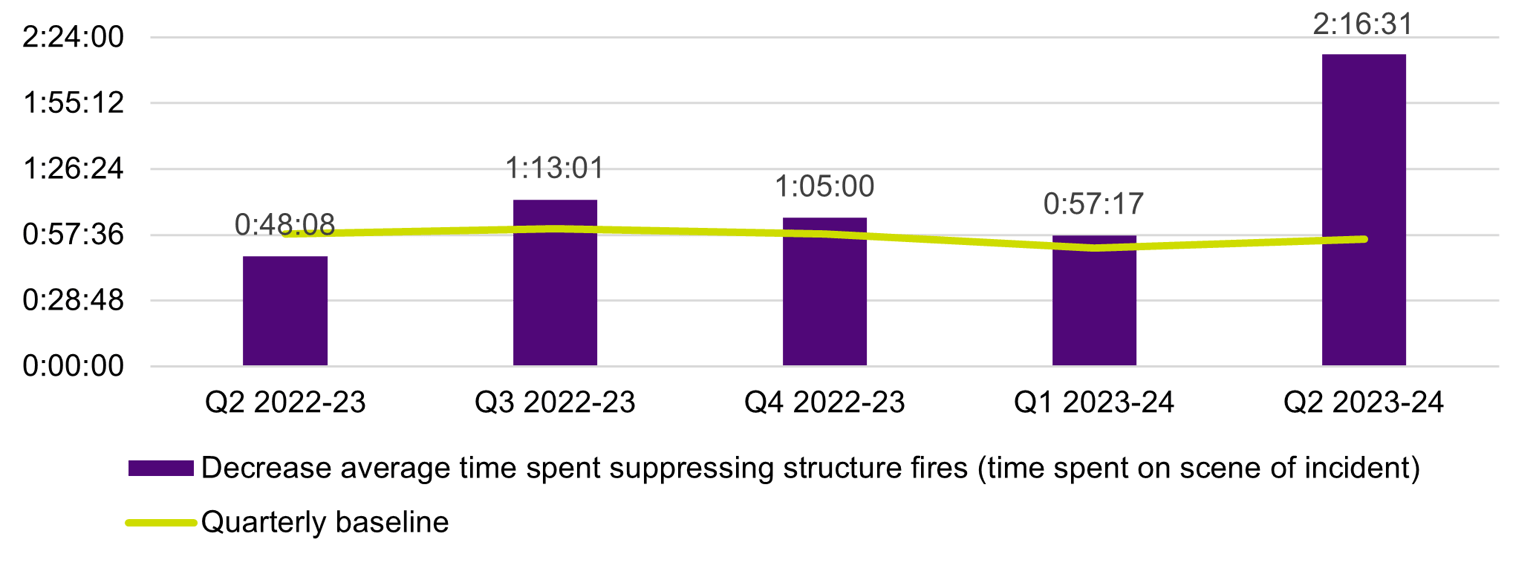
- CFA did not meet their quarterly baseline of 55 minutes and thirty-five seconds for the indicator ‘decrease average time spent suppressing structure fires’, recording a result of 136 minutes and 31 seconds this quarter.
Significant change from the previous quarter (positive or negative):
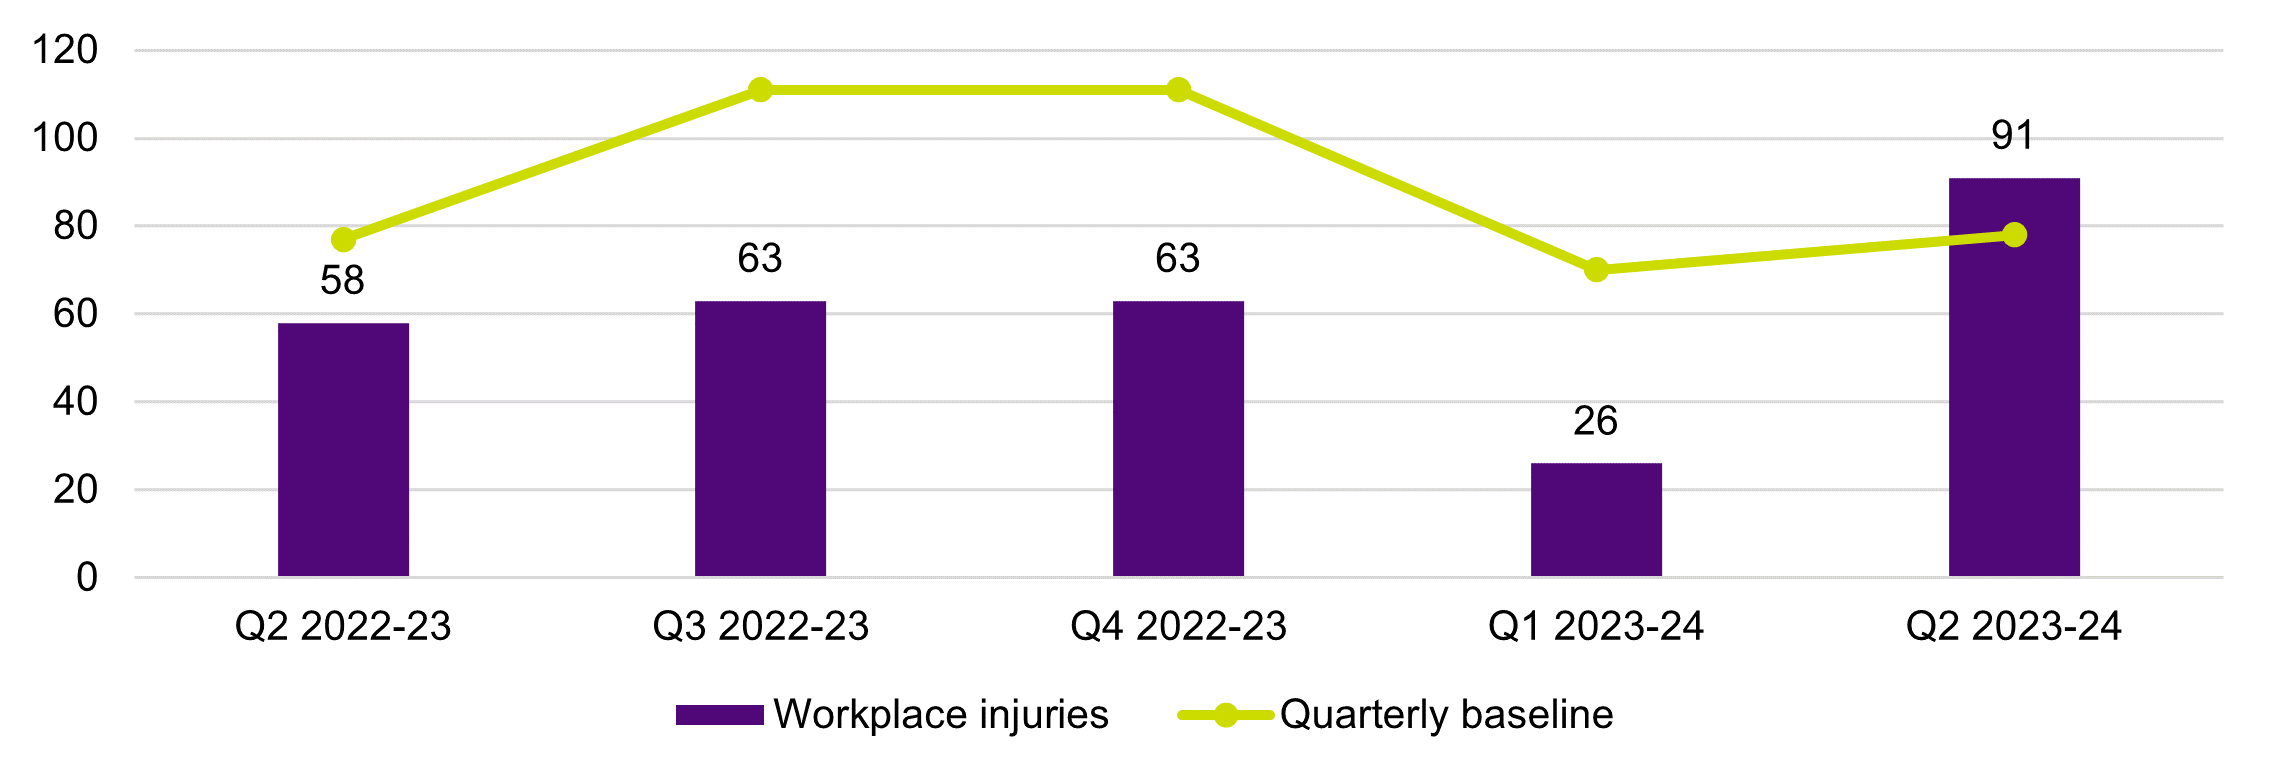
- CFA reported 91 workplace injuries this quarter, representing a 16.7 per cent increase on the quarterly baseline.
Varies more than 5 per cent from the agency’s baseline or average over time:
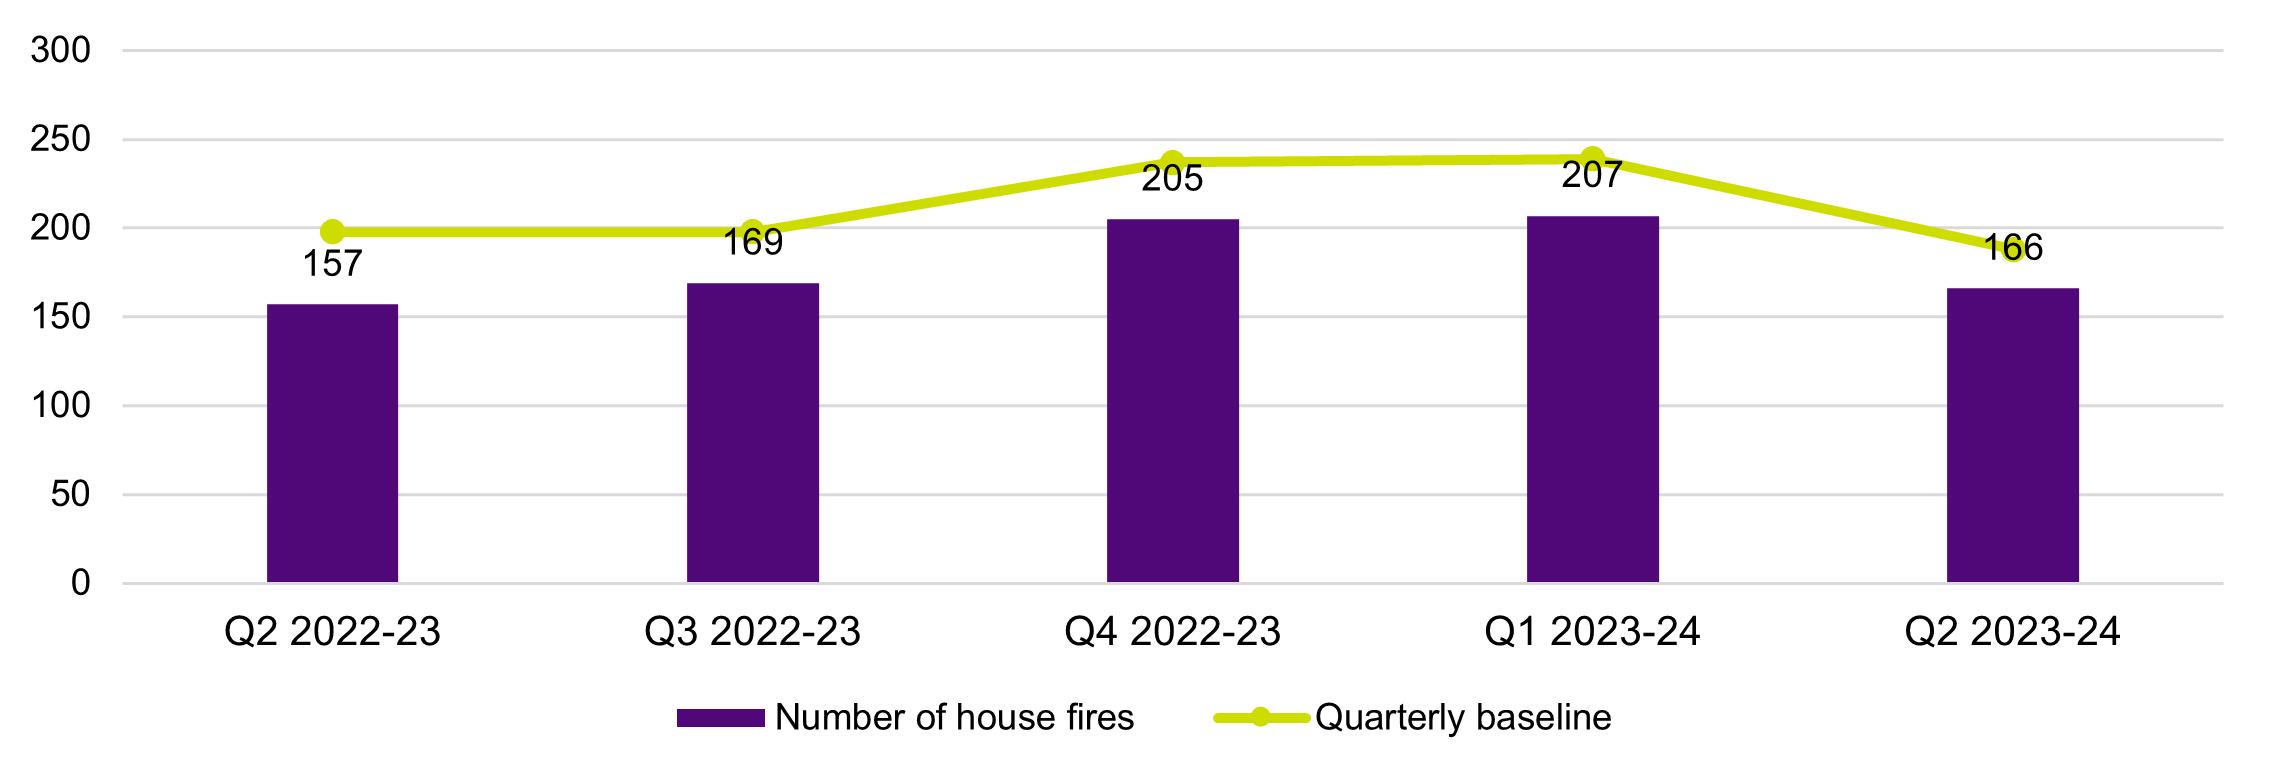
- CFA reported a total of 166 house fires this quarter. This is a reduction of 41 house fires compared to the previous quarter (19.8 per cent decrease) and is 22 house fires below the quarterly baseline.
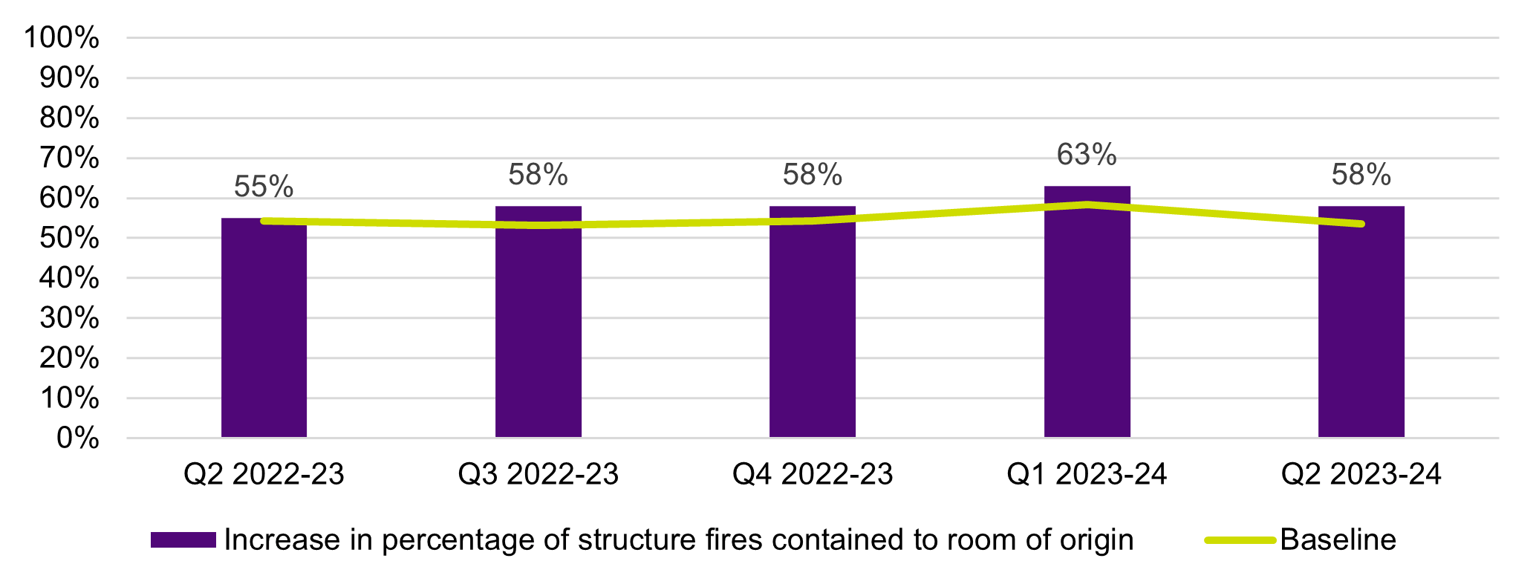
- CFA recorded a positive result for 'Increase in percentage of structure fires contained to room of origin’ with a result of 58 per cent. This is a 53.6 per cent increase from the quarterly baseline and the fifth consecutive quarter since Q2 2022-23 that CFA have met the baseline for this indicator.
FSIM acknowledges CFA and FRV for their ongoing cooperation and active contribution to FSIM’s monitoring and reporting activities.
1. Summary
This report is prepared and published in accordance with the Fire Services Implementation Monitor’s (FSIM) requirements under section 141 of the Fire Rescue Victoria Act 1958 (FRV Act). It provides commentary and analysis on the Country Fire Authority’s (CFA) and Fire Rescue Victoria’s (FRV) respective outcomes frameworks for quarter 2 (Q2) of the 2023-24 financial year (FY).
FSIM publishes these quarterly reports at Fire Services Implementation Monitor publications.
Reporting on outcomes
CFA and FRV have each developed an outcomes framework that sets out their respective outcomes-based fire services performance measures, in accordance with section 140(1) of the FRV Act.
For this quarter, CFA have reported on 29 indicators and FRV have reported on 19 measures (against 12 indicators). Reports on CFA and FRV progress against their respective outcomes frameworks for Q2 FY 2023-24 are provided in the appendices.
In this report, FSIM has provided commentary on indicators and measures that meet the below criteria:
- demonstrates a notable achievement:
- FRV: Number of sessions of FireEd and risk reduction programs delivered to the community.
- CFA: Increase in the number of community members engaging with CFA.
- continuing off-track trend over repeated quarter:
- FRV: Percentage of response to structure fire incidents within 7.7 minutes (target 90 per cent).
- FRV: Increase in support and maintenance of firefighters’ physical and psychological health.
- CFA: Decrease average time spent suppressing structure fires (time spent on scene of incident).
- significant change from the previous quarter (positive or negative):
- CFA: Decrease in workplace injuries (significantly changes from quarter to quarter).
- varies more than 5 per cent from the agency’s baseline or average over time:
- CFA: Decrease in the number of house fires.
FSIM observations
In this quarter, FSIM continues to observe the trends highlighted in the last fire services outcomes framework progress report. For example, trends of agencies not meeting targets (e.g. FRV structure fire response times), agencies reporting on indicators which are heavily influenced by factors outside of their control (e.g. CFA number of house fires and number of grass and scrub fires and FRV number of preventable non-structure fire incidents), and a significant lack of data (and therefore fulsome reporting) by FRV.
As FSIM has previously noted, FRV continues to work to restore systems impacted by the December 2022 cyber-attack and are using interim approaches to address the lack of data (for example, from the Australian Incident Reporting System (AIRS)).
FSIM appreciates that it takes dedicated time, effort and resources for agencies to be able to fulsomely report on and use their outcomes frameworks to drive meaningful change. FSIM looks forward to the agencies’ continued work on outcomes reporting that demonstrates how factors within their control are contributing to these results.
Maturing outcomes frameworks
CFA and FRV regularly review their respective outcomes frameworks to ensure the outcomes, indicators and measures continue to align with their strategic priorities and remain fit-for-purpose.
CFA’s outcomes framework
CFA advised that they are finalising the annual review of their outcomes framework, with changes expected to be applied in the Q3 2023-24 report.
FRV’s outcomes framework
FRV advised that their outcomes framework review is likely to commence in March or April 2024 and will take 12 months to complete.
FRV also advised that this process will include a review of their Health, Safety and Wellbeing Framework. This review will inform FRV’s outcomes framework measures under indicator 3.1.1 ‘Increase in support and maintenance of firefighters’ physical and psychological health’ to enable meaningful reporting on occupational health and safety.
Industrial action impacting data quality
FSIM observed that data quality for some indicators continues to be impacted by industrial action.
FRV advised that the (rolling) false alarm data reported in the below indicators was impacted by the United Firefighters Union’s industrial action during 27 October 2022 to 20 April 2023 and 12 August to 13 October 2023 and the industrial action affecting Triple Zero Victoria (TZV) (formerly Emergency Services Telecommunications Authority) from 18 December 2023 to date:
- 1.2.3: Decrease in unwanted false alarms to reduce unnecessary emergency responses.
- 1.3.3: Decrease in preventable non-structure fires and other hazard related incidents.
- 3.4.1b: No. of incidents outside FRV district.
For measure ‘2.1.3b: Total operational fleet availability’, FRV report that protected industrial action being taken by some CFA staff has meant that FRV cannot access total fleet availability data in the regions for formal reporting. CFA advise that, via agreement, this industrial action did not impact on appliance-related emergency response or related activities.
FRV cyber-attack impacts on outcomes framework reporting
As previously reported, the December 2022 cyber-attack continues to impact FRV’s information and computer technology systems and FRV’s access to the Australian Incident Reporting System (AIRS). As such, FRV are unable to provide the results on several operational measures as they are dependent on fields captured by the AIRS system.
In the interim, FRV report on the below five operational measures impacted by AIRS using data obtained from the TZV Computer Aided Dispatch (CAD) system:
- No. of properties with six or more false alarms on different days (rolling 12 months).
- No. of structure fire incidents within FRV districts.
- No. of incidents other than structure fires and other non-fire related incidents.
- Percentage of response to structure fire incidents within 7.7 minutes.
- Percentage of response to EMR (emergency medical response) within 9.2 minutes.
FRV report the TZV CAD data has been validated to ensure its integrity and comparability with AIRS.
FRV advised that work continues to be undertaken to restore AIRS for reporting from 1 August 2024
(i.e. data will be entered into AIRS from the beginning of the 2024-25 financial year).
FRV also advised that recovery of FireCode, which was also impacted by the cyber-attack, is expected to be completed by June 2024.
2. Outcomes framework Q2 results
2.1 Demonstrates a notable achievement
There was a notable increase in: the number of FireEd and risk reduction programs delivered by FRV and the number of community members engaged by CFA.
2.2 Continuing off-track trend over repeated quarters
Indicators with a continuing off-track trend over repeated quarters are: FRV response to structure fire incidents, FRV support of firefighters’ physical and psychological health and average time spent suppressing structure fires by CFA.
2.3 Significant change from the previous quarter (positive or negative)
The indicator that significantly changed from the previous quarter (negative) was: CFA decrease in workplace injuries.
2.4 Varies more than 5 per cent from the agency’s baseline or average over time
Indicator results that varied more than 5 per cent from the agency’s baseline or average over time were: CFA decrease in the number of house fires and CFA increase in percentage of structure fires contained to room of origin.
2.1 Demonstrates a notable achievement
2.1.1 FRV: Number of sessions of FireEd and risk reduction programs delivered to the community
The FRV FireEd program provides home fire safety education to primary school children in order to embed lifelong practices that reduce fire risks in the home.
FRV delivered 264 FireEd and risk reduction programs in Q2. This is a 21.1 per cent increase compared to the previous quarter Q1 2023-24 (218) and demonstrates a notable achievement (Figure 1). FRV advised a combination of factors contributed to this result, including improvements to internal risk reduction program reporting and an increase in the delivery of risk reduction programs scheduled towards the end of the 2023 calendar year.
FRV expects a year-on-year increase in the number of FireEd sessions delivered as schools become more familiar with the program.
FRV report anecdotal evidence suggests children have used lessons learned from FireEd programs when a fire has occurred in the home. FRV note that an increase in sessions delivered may correlate to a decrease in some house fires, property damage and loss of life. FRV also notes that these reported impacts are not measurable in the short-term but over a longer period of time.
Data note
Q2 2022-23 and Q3 2022-23 data is unavailable due the impact of the December 2022 cyber-attacks on reporting.
Figure 1: 1.1.2a No. of sessions of FireEd and risk reduction programs delivered to the community.

2.1.2 CFA: increase in the number of community members engaging with CFA
CFA reported engaging with a total of 68,378 community members in Q2. This result demonstrates a notable achievement considering the significant increase against CFA’s quarterly baseline of more than 30,000 community members engaged this quarter (Figure 2). This result includes the total number of community members engaging with the CFA through the CFA Fire Safety Essentials Program, CFA Fire Safety Planning Workshops, visits to properties in high-fire risk areas, CFA representation at community events, CFA care-sector engagement and CFA school education and fire drill programs. CFA also attributes this higher level of engagement partly to CFA Brigade engagement activities returning to pre-COVID levels, such as through CFA Open Days.
CFA reported they are unable to show a causal relationship between the increased levels of community engagement and changes to performance indicators on fire prevention and community impact. CFA report that an evaluation of their community engagement activities shows that each activity is effective in increasing awareness of fire risk and assisting communities to plan for survival in both home fire and bushfire. CFA also note there is an international body of evidence that shows the benefits to community safety (e.g. reduced risk of dying from house fires and reduced frequency and severity of residential structure fires) from home smoke alarm installation and maintenance1 and public door knocking and community education programs by firefighters2.
Figure 2: 1.2.1 Increase in the number of community members engaging with CFA

Footnotes
[1] FEMA (2008), USFA Position Paper – Residential Fire Sprinklers. http://www.residentialfiresprinklers.com/wpcontent/uploads/2015/06/sprinkler_position_paper.pdf
[2] Clare et al (2013), Reduced frequency and severity of residential fires following delivery of fire prevention education by on-duty fire fighters: Cluster randomized controlled study. https://www.sciencedirect.com/science/article/pii/S0022437512000230#aep-abstract-id6
2.2 Continuing off-track trend over repeated quarters
2.2.1 FRV: Response to structure fire incidents within 7.7 minutes
For the thirteenth consecutive quarter, FRV did not meet their target for this measure (90 per cent), recording a result of 87.29 per cent for response times to structure fire incidents within 7.7 minutes (Figure 3).
FRV report that the physical location of structure fire incidents, and the time it takes to reach these locations, rather than the type of structure fire incidents (e.g. residential or commercial buildings), has the most impact on response times. FRV’s analysis on response times for structures fires from October to December 2023 is as follows:
- 122 of 960 incidents attended missed the benchmark (resulting in the 87.29 per cent result this quarter).
- Of these 122 incidents, 38 (31 per cent) occurred outside of 6.2 minute drive time from an FRV station.
- Additionally, of the other 84 incidents which missed the benchmark, almost half (49 per cent) were attended first by appliances dispatched from a station outside of the Maintenance Area where the incident was recorded. This likely resulted in FRV having to travel excess distances to reach the incident.
Data note
As reported in Q1 2023-34, prior to the December 2022 cyber-attack, FRV reported this measure by sourcing data from AIRS. Since Q2 2022-23, FRV has used data obtained from TZV CAD system to report this result. FRV advised that TZV CAD data has been validated to ensure its integrity and comparability. FRV reported that comparative analysis confirmed the difference between the two data sets (using TZV CAD data instead of AIRS data) did not materially affect results. Figure 3 represents results reported using AIRS data for results between Q1 2020-21 to Q1 2022-23 and TZV CAD data for results reported between Q2 2022-23 to Q2 2023-24.
Figure 3: 2.1.3a Percentage of response to structure fire incidents within 7.7 minutes (target 90 per cent)
2.2.2 FRV: Increase in support and maintenance of firefighters’ physical and psychological health
FRV continues to record reduced performance in measures ‘3.1.1a Average number of days for first return to work within quarter’ and ‘3.1.1b lost time injury severity rate per 1000 FTE’.
FRV’s measure ‘3.1.1a average number of days for first return to work within quarter’ recorded an 8.39 per cent increase in Q2 2023-24 (18.21 days) compared to Q1 2023-24 (16.8 days). FSIM also notes that results for this indicator displays a continuous upward trend since Q3 2022-23, demonstrating reduced performance (Figure 4).
FRV’s measure ‘3.1.1b: Lost time injury severity rate per 1000 FTE’ calculates the number of injuries reported into FRV’s claims database categorised as Lost Time Injuries (one or more working days/shifts lost due to injury). This quarter's result of 9.07 lost working days/shifts due to injury per 1000 FTE is a 4.25 per cent increase from the Q1 2023-24 result of 8.7 and a 20.8 per cent increase from its year-on-year Q2 2022-23 result of 7.51 (Figure 4).
As reported in Q1 2023-24, FRV advised FSIM that although the results show reduced performance, FRV does not consider this to be a meaningful indicator to understand workforce health and safety due to the way the indicator is measured (e.g. it does not account for claims lodged at the end of the quarter). FRV has reported to FSIM that the work to review health, safety and wellbeing metrics as part of the FRV Health Model program implementation will allow for more meaningful reporting of occupational health and safety under this measure in future.
Figure 4: 3.1.1: Increase in support and maintenance of firefighters’ physical and psychological health, measures 3.1.1a Average number of days for first return to work within quarter, 3.1.1b Lost time injury Severity Rate per 1000 FTE
2.2.3 CFA: Decrease average time spent suppressing structure fires (time spent on scene of incident)
CFA has not met the baseline for this indicator since Q2, 2022-23 (Figure 5).
CFA recorded a result of 136 minutes and 31 seconds this quarter. This is an 83 minutes and 56 seconds increase on the quarterly baseline and represents a continuous off-track trend for this indicator.
CFA report that this increase is due to a number of hayshed fires during the reporting period, which can take days to extinguish. CFA’s result this quarter, with the top ten outliers removed from the overall result, is 64 minutes and 5 seconds, which is an 8 minutes and 30 seconds increase on the quarterly baseline. CFA did not observe any other trends or factors that contributed to this quarter’s results.
As noted previously, CFA advise there are many factors that can influence this result that are not easily evaluated quarter-on-quarter. These factors include fire progression at time of arrival, structure type, timeline of support services such as utilities, and the presence of hazardous materials.
Figure 5: 2.2.3 Decrease average time spent suppressing structure fires (time spent on scene of incident)
2.3 Significant change from the previous quarter (positive or negative)
2.3.1 CFA: Decrease in workplace injuries (staff and volunteers)
CFA reported 91 workplace injuries this quarter. This represents a 16.7 per cent increase on the quarterly baseline of 78 and a significant change from the previous quarter’s result (Figure 6).
CFA advised that there were no significant trends or patterns observed in the injuries reported this quarter and that last quarter’s result was uncharacteristically low given the longer-term trend. For example, CFA’s results have been below the baseline since Q2 2022-23 (with the exception of this quarter). CFA also advised that this measure is linked to the amount of operational activity in a given quarter.
CFA report they continue to roll out targeted and general communications across the organisation to promote health and safety.
Figure 6: 3.1.2 Decrease in workplace injuries (staff and volunteers)

2.4 Varies more than 5 per cent from the agency’s baseline or average over time
2.4.1 CFA: Decrease in the number of house fires
CFA reported a total of 166 house fires in Q2. This figure marks a reduction of 41 house fires compared to the previous quarter (19.8 per cent decrease) and is 22 house fires below the quarterly baseline (Figure 7), which is a good outcome for the community.
CFA has prevention programs and produces communications to influence community behaviour aimed to mitigate fire risk such as working to increase the use of operational smoke alarms in homes. CFA notes that house fires can be affected by a broad range of factors and CFA cannot make a direct correlation between specific CFA activities and the Q2 result. CFA also notes that there are potential lags between CFA prevention activities and outcomes for the community.
Figure 7: 2.1.1 Decrease in the number of house fires

FSIM notes that CFA has also recorded a positive result for 'Increase in percentage of structure fires contained to room of origin’ with a result of 58 per cent (Figure 8). This is a 53.6 per cent increase from the quarterly baseline, demonstrating an improvement on the average Q2 year-on-year result. This is also the fifth consecutive quarter since Q2 2022-23 that CFA have met the baseline for this indicator.
Figure 8: 2.2.3 Increase in percentage of structure fires contained to room of origin
3. Reader guide
Definitions
| Acronym | Title |
|---|---|
| AIRS | Australian Incident Reporting System |
| CAD | Computer Aided Dispatch |
| CFA | Country Fire Authority |
| COVID | Coronavirus |
| EMR | Emergency Medical Response |
| FES | Fire Equipment Services |
| FRV | Fire Rescue Victoria |
| FRV Act | Fire Rescue Victoria Act 1958 |
| FSIM | Fire Services Implementation Monitor |
| FTE | Full Time Equivalent |
| FY | Financial Year |
| TZV | Triple Zero Victoria |
Reference to fire services agencies
References to the fire services in this document relate specifically to CFA and FRV. Where more than one fire services agency is referenced together in this document, they are listed in alphabetical order in the above table.
Comparison between agencies’ performance against published outcomes frameworks
Comparisons between the agencies should not be made as the outcomes frameworks necessarily vary based on the CFA and FRV’s respective strategic and operational priorities and data.
4. Appendix A: CFA Q2 2023-24 outcomes progress report
CFA outcomes framework
This is CFA’s Year Three outcomes framework progress report for Q2 2023-24. The CFA progress report includes quarterly year-on-year baselines, which is the average of five years of data (unless otherwise specified) and an annual baseline, which is a five-year average (unless otherwise specified).
5. Appendix B: FRV Q2 2023-24 outcomes progress report
FRV outcomes framework
FRV’s outcomes framework includes a total of 10 Outcome Statements, 29 indicators and 49 measures (quarterly and annual). In Q2 2023-24, FRV reported on 19 quarterly measures (against 12 indicators). Quarterly data impacted by the cyber-attack in December 2022 has not been included in the progress report for six indicators and ten measures. Annual data is not included in this report and as a result not all indicators and measures are numbered sequentially.