

Higher participation and productivity can help to address skill shortages, get more value out of employment, raise incomes and grow the Victorian economy.
Barriers to participation persist for key groups and will take time to address. Changes to business models and practices are needed to lift productivity and address workforce constraints.
Higher participation by key groups can help meet demand
Labour force participation has steadily grown over the past 30 years in Victoria. Over this period the participation rate has lifted from around 62% to around 67% , a record high.20 While workforce participation has increased, there is room for further growth.
In March 2022 there were an estimated 1.75 million people not in the labour force, with only 876,000 permanently not intending or unable to work.2 Of the remaining 899,000, an estimated 195,600 wanted to work, are available within 4 weeks but are not actively looking.21
Further, in April 2022, 222,600 people were underemployed, and these workers indicated a preference to work an additional 3,031,700 hours – equivalent to almost 7,000 full-time jobs.22
Lifting participation will not be easy. Structural barriers to learning and work prevent people from securing a job, with some communities more impacted than others. Analysis shows that Aboriginal Victorians, early school leavers, and people with disability are more likely to be unemployed or stop looking for work (refer Figure 9)23. When they do find work, it is often lower paid, precarious and casualised, with greater risk of losing their job.
Figure 9. Unemployment rate and labour market participation rate by demographic group, Victoria
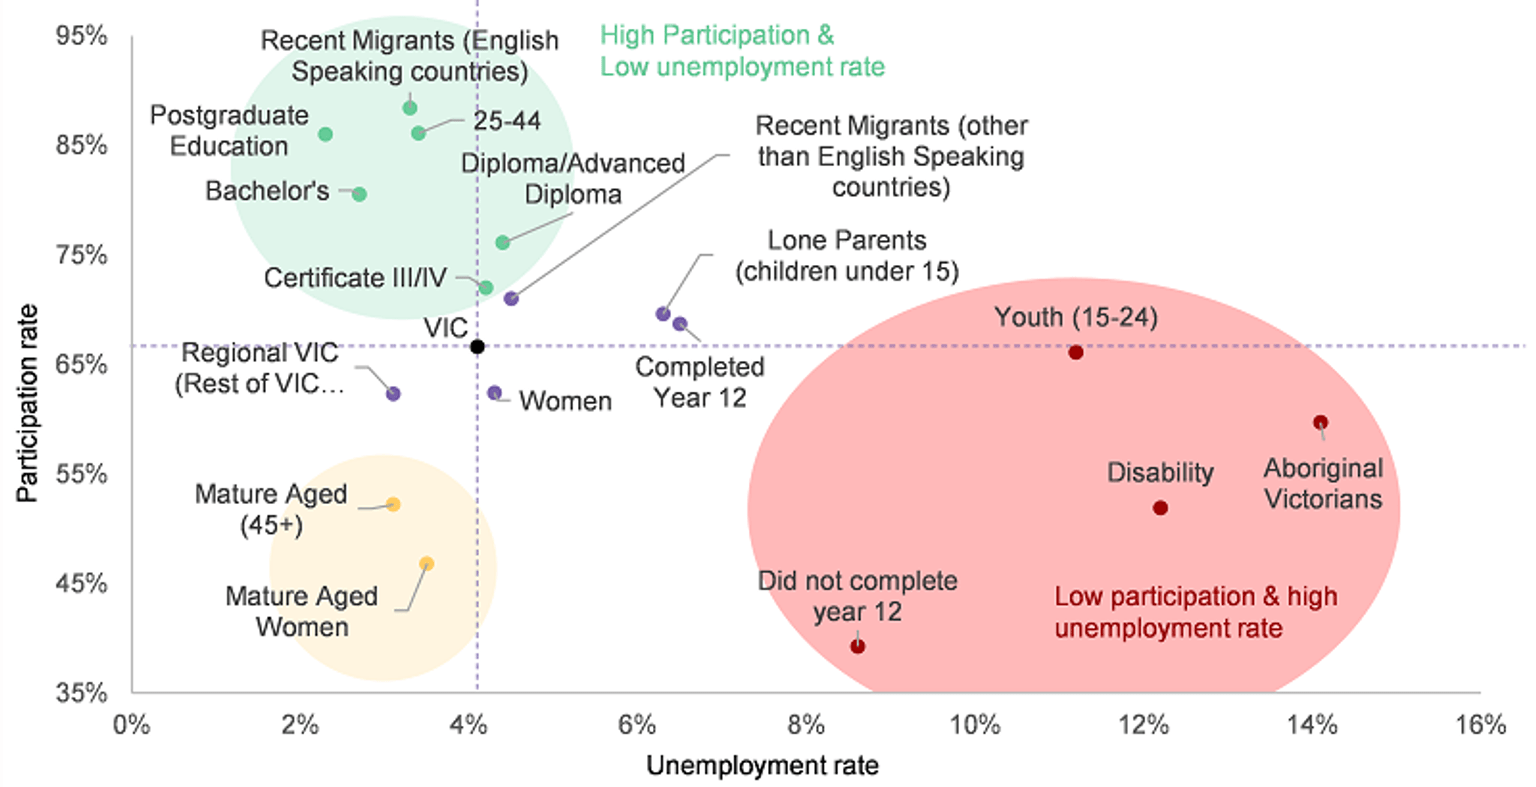
At the regional level, participation rates in education and employment lag metropolitan Melbourne. Low education levels are one factor, but the availability of housing, transport and childcare create barriers to taking up education and work that are not easily overcome.
There is a particular challenge to ensure young people are supported to engage in the labour market. Successful completion of secondary school is a predictor of post-school outcomes, with learners who do not complete Year 12 – 4 times more likely not to be in work, education or training
Female participation has risen from 52% in 1992 to a record high of around 62% in 2022, driving individual, familial, and societal economic prosperity. In that time male participation dropped from 74% to around 72% today, continuing a trend of decline24.
A gap remains in the skills, occupation and labour market outcomes for women compared to men. Women typically occupy more casual and at-risk roles than men and earn less money. For example, the Australian Bureau of Statistics estimates for Victoria that on average men earn 42% more than women.
More diverse workforces can support industry productivity and innovation. It requires industry to harness the varied experiences and ideas of previously under-represented cohorts and include them in decision making systems and processes. In turn, it signals opportunity to people who may have previously thought they would not be afforded a decision-making role purely because of their identity25.
Barriers to participation
Many of the people who are currently outside the workforce face structural barriers to participating in training and work. Intergenerational poverty, trauma and discrimination, and low levels of education limit an individual's ability to engage with, and stay in, training and work. Health or mental health issues, family violence issues, and caring responsibilities add further barriers to participation.
Consultation highlighted that many people face multiple, compounding barriers. For example, a person with disability who has low levels of education will likely find it much harder to access and stay in training and work. People living in regional areas with poor access to transport and childcare, and low digital connectivity, are also more likely to have increased levels of disadvantage.
These experiences often lead to low confidence and motivation that can be associated with long-term unemployment or poor experiences in prior learning.
The pandemic has created and accelerated structural change. Some industries have more rapidly escalated their technological and digital development creating changed job roles and new job opportunities. Unfortunately, displaced workers from other industries do not always have the digital skills needed to take up these jobs.
Productivity growth is essential to future success
National productivity performance has increased over the decades and Australia sits in the middle of OECD rankings1. However, since 2013, Victoria’s Gross State Product (GSP) per capita has been below the Australian average (refer Figure 10).7, 26 While some factors may be structural, it is likely that opportunities exist to support businesses to adopt new business models, practices, and technology to increase productivity and ease demand for labour.
Figure 10. Gross State Product per capita by selected jurisdictions ($)
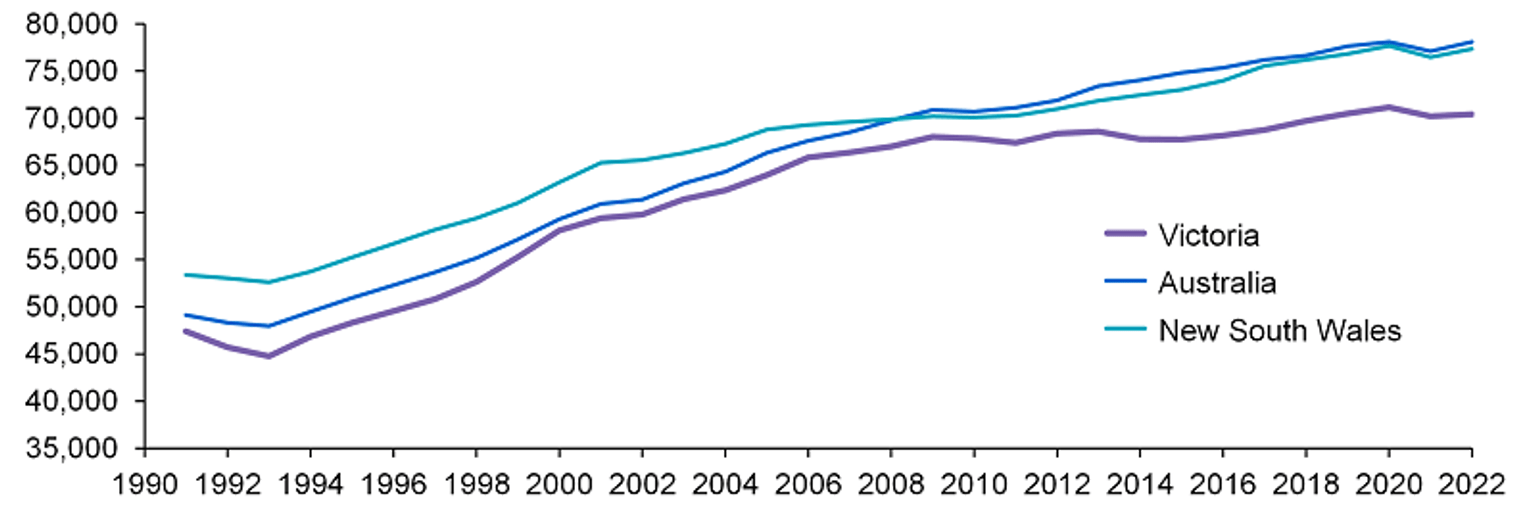
Businesses are rising to the challenge. Across Victoria, innovation is driving new business activity and requires different and higher-level skills – whether related to technology or new practices for businesses to remain competitive. Rapid technological change means most people will be regularly expected to develop new knowledge, conduct new tasks, solve more complex and interconnected problems, interact with digital tools and artificial intelligence, and engage with customers in new ways. Many specialised activities will also be required to comply with international standards operating in globally connected supply chains.
The health and community services industry are at the forefront of thinking differently about their workforce to meet demand. Significant government reform in disability, aged care, mental health and family violence is re-positioning service delivery to be more person centred. Workers will be required to be increasingly multi-skilled into the future whilst also being required to work across different sub sectors as the people they serve present with intersectional care challenges27.
Workers need new skills to remain relevant in their role and support business growth. They also need new skills to effectively take up emerging jobs. This occurs when new business practices generate new occupational needs that vary greatly from existing occupations, requiring a new set of skills entirely. This process is essential to attract investment and support sustained business growth.
The past 2 decades have observed a growing demand for higher order skills. Occupations classified at ANZSCO skill level 1, 2 or 3 or those commensurate with higher level VET and higher education now account for around 60% of the workforce compared to 57% a decade ago28. Occupations commensurate with a bachelor’s degree or higher qualification had the highest increase in share, with more jobs added in the last decade than the other 4 categories combined.‡
However, this only provides part of the story. Industry is increasingly looking to higher order skills across all occupations. Agriculture, manufacturing, and services are just some examples where higher order skills are required by businesses as they seek to automate repetitive work and focus on higher value add activities in order to compete at a local and international level.
This shift is across all roles regardless of prior education or experience, impacting individuals at the start, middle and end of their career. A tight labour market will accelerate this shift as workers become harder to find and retain, driving further adoption of higher order skills. Victoria as a knowledge economy has long recognised the value of skills. Victorians on average are more likely to be enrolled in study29, more educated30, and employed in more highly qualified occupations than most jurisdictions. Investing in the development of new skills has significant returns on investment. Every 1% improvement in productivity across Victoria is the equivalent to the work of approximately 35,000 individuals.31 These benefits can be shared with investors, business owners, employees, and the broader community.
Continued productivity growth requires continuous learning. This is illustrated in a recent survey of businesses of which 83.8% indicated they believed they had the skills they need to function today whereas only 79.2% indicated they expect to have the skills they need to function in the next 12 months35. The changing nature of skills requires retraining yet only 60.6% of employers indicated they supported staff training in the past 12 months, either by paying for the training or providing staff with the time off to engage in the learning.
Ultimately, in a tight labour market, the quality of jobs is critical to individuals. ‘Better work’ looks like higher skill, pay, job satisfaction, security and long-term resilience. Higher productivity is the key to delivering this.
References
20 Australian Bureau of Statistics (ABS) 2022, Labour force, Australia, reference period April 2022, released May 2022, ABS, Canberra.
2 Australian Bureau of Statistics (ABS) 2022, Participation, Job Search and Mobility, cat.no. 6291.0.55.001, reference period March 2022, released April 2022, ABS, Canberra.
21 Australian Bureau of Statistics (ABS) 2022, Labour Force, Australia, Detailed, cat.no.6202.0 and 6291.0.55.01, reference period March 2022, released April 2022, ABS, Canberra.
22 Australian Bureau of Statistics (ABS) 2022, Labour Force, Australia, Detailed, cat.no.6202.0 and 6291.0.55.01, reference period March 2022, released April 2022, ABS, Canberra.
23 Australian Bureau of Statistics (ABS) 2022, Labour force, Australia, ABS, Canberra, viewed 3 May 2022, available here. Data current as at March 2022 unless otherwise stated. Where seasonally adjusted data is not reported by ABS a 3-month moving average is calculated. A 12-month moving average is applied for Youth (15-24). Aboriginal Victorians is based on ABS Census 2016. Disability is based on ABS Disability, Ageing and Carers (2018). Highest level of educational attainment is based on quarterly data reported by ABS as at February 2022
24 Australian Bureau of Statistics 2022, Labour force, Australia, cat.no. 6202.0, ABS, Canberra, viewed 3 May 2022.
25 Ely, R and Thomas, D, Getting serious about diversity: enough already with the business case, 2020, Harvard Business Review.
1 Australian Government Productivity Commission, PC Productivity Insights, March 2022
7 Australian Bureau of Statistics 2022, national, state and territory population, reference period September 2021, released March 2022, ABS, Canberra. Available at Australian Bureau of Statistics.
26 Australian Bureau of Statistics (ABS) 2021, Australian national accounts: state accounts, reference period 2020–21 financial year, released November 2021, ABS, Canberra.
27 Victorian Skills Authority, Victorian Skills Plan – Health and Community Services Industry Insight, May 2022
28 Nous analysis of Australian Bureau of Statistics (ABS) 2022, Labour Force Survey, Australia, released April 2022, ABS, Canberra.
‡ In ANZSCO, skill level is defined as a function of the range and complexity of the set of tasks performed in a particular occupation. The greater the range and complexity of the set of tasks, the greater the skill level of an occupation. ANZSCO has 5 skill levels, with Skill Level 1 defined as having a level of skill commensurate with a bachelor degree or higher qualification and Skill Level 5 having a level of skill commensurate to Australian Qualification Framework Certificate 1 or compulsory secondary education.
29 Australian Bureau of Statistics 2021, Education and work, Table 11, Persons aged 15-64, electronic dataset, ABS, Canberra.
30 Australian Bureau of Statistics 2021, Education and work, Table 29, electronic dataset, ABS, Canberra
31 Nous analysis of Australian Buraru of Statistics 2022, Labour Force, Australia, Detailed, cat.no.6291.0.55.001, reference period March 2022, released April 2022, ABS, Canberra
32 Australian Bureau of Statistics 2021, Education and work, Table 11, Persons aged 15-64, electronic dataset, ABS, Canberra.
33 Australian Bureau of Statistics 2021, Education and work, Table 29, electronic dataset, ABS, Canberra
34 Nous analysis of Australian Bureau of Statistics 2022, Labour Force, Australia, Detailed, cat.no.6291.0.55.001, reference period March 2022, released April 2022, ABS, Canberra
35 Wallis Social Research, Victorian Employer Skills Survey, Q5a an Q5b, n= 9935, 2021
Updated