
The Koala Index was developed by the Arthur Rylah Institute for Environmental Research with a generalised linear model (GLM) using a Poisson distribution (Zuur, Ieno, and Smith 2007). The mean Koala incident rate is based on historical Koala incident and population data and estimated using the model.
Calculating the Koala Index
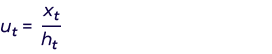
To calculate the Koala Index, the Koala incident rate must first be determined. The Koala incident rate (ut) is calculated over a time period (t) by dividing the total number of Koala incidents by the total number of Koala observations, as per the formula below (refer to Table 1 for variables):
The Koala incident rate (ut) is then used to calculate the Koala Index (zt), as per the formula below (refer to Table 1 for variables):
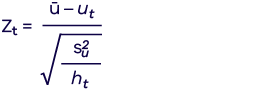
Table 1 Variables used to calculate the Koala Index (zt)
Variable | Definition |
| ut | Koala incident rate over time t |
| xt | Total number of koala incidents over time t |
| ℎt | Total number of koala observations over time t |
| zt | Koala index over time t |
| ū | Mean Koala incident rate. A value set annually using Koala incident data from operational blue gum plantations. Note: this figure is expressed as expected incidents per 100 observations and may change as collection and reporting of data refines the model. |
s 2/u | Variance in Koala incident rate. A value set annually using Koala incident data from operational blue gum plantations. Note: this is a measure of the amount of variability in Koala incident data and may change as collection and reporting of data refines the model. |
Once the Koala Index has been calculated using the formula above, comparisons over time can be displayed on a line graph, with Koala Index on the y-axis and corresponding time period on the x-axis. For example, if the Koala Index is calculated on a monthly basis, comparisons between months can be displayed (refer to the case study on the following page).
Assessing compliance using quality control indicators
The Koala Index provides an indication of a blue gum plantation company’s operations against the expected Koala Index (determined from the mean Koala incident rate across the industry) allowing for an assessment of non-compliance. In general, a Koala Index of zero or greater indicates that the management measures being implemented are at a level that is equal to or better than the industry average (i.e. management measures are effective in reducing Koala incidents). If a Koala Index is less than zero (i.e. negative), the number of Koala incidents occurring across the blue gum plantation company’s operations is poorer than the industry average.
The industry average will be reviewed on a needs basis, noting that the index will only be recalibrated where there has been a material change in industry performance.
The industry is expected to focus on continuously improving its performance. Negative Koala Index results indicate a need to explore options for remedial action.
If the Koala Index results are consistently poor or severely low, there is a set of quality control indicators that determine the conduct to be non-compliant. These are consistent with standard rules used in quality control (Nelson 1984). If one or more of the quality control indicators listed in Appendix 2 are met, the authorisation holder is considered not in compliance with the conditions of the authorisation (including the Koala Management Plan). This level of non-compliance may result in enforcement action.
Quality control indicators
- The Koala index is less than -3 on one or more occasions.
- The Koala Index is less than -2 at two of three consecutive time periods.
- The Koala Index is less than -1 at four of five consecutive time periods.
- The Koala Index has been below 0 for eight consecutive time periods.
- The Koala Index has been steadily decreasing for six consecutive time periods.
- The Koala Index has 14 points in a row alternating up and down.
Case Study
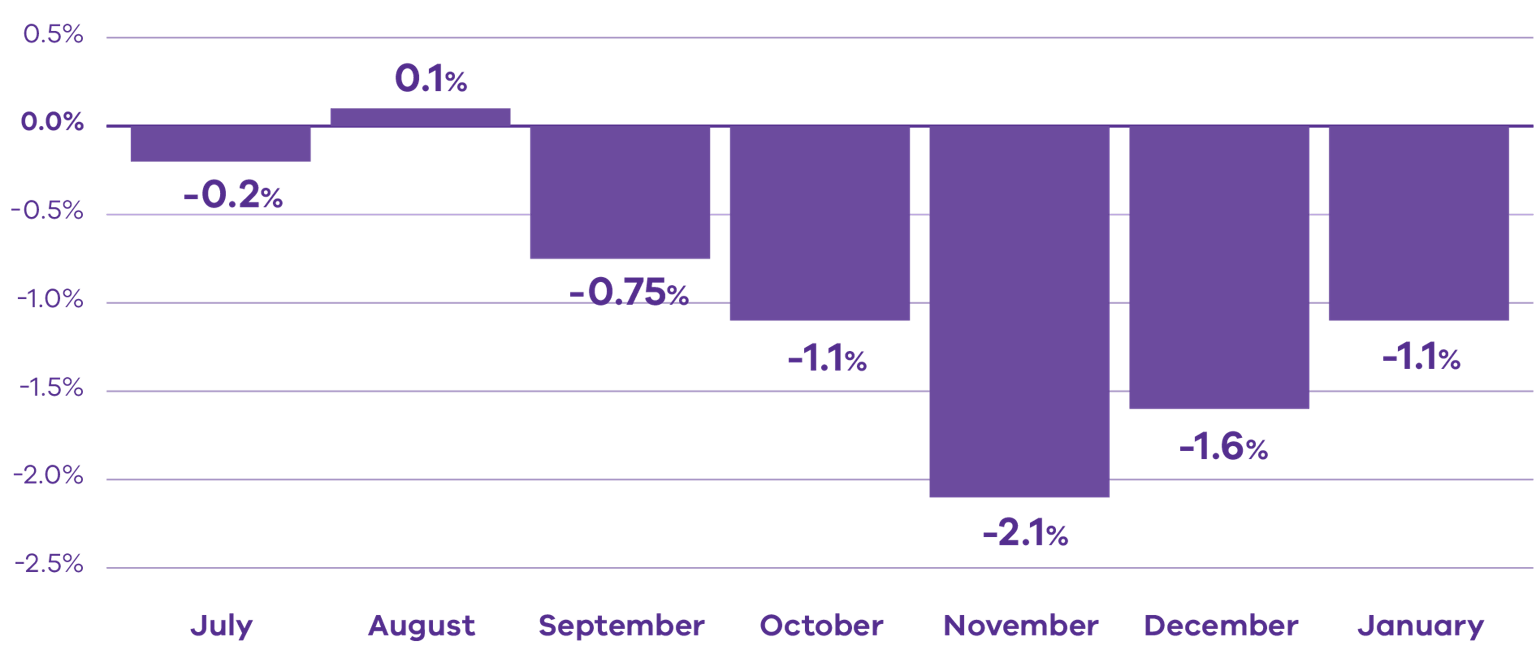
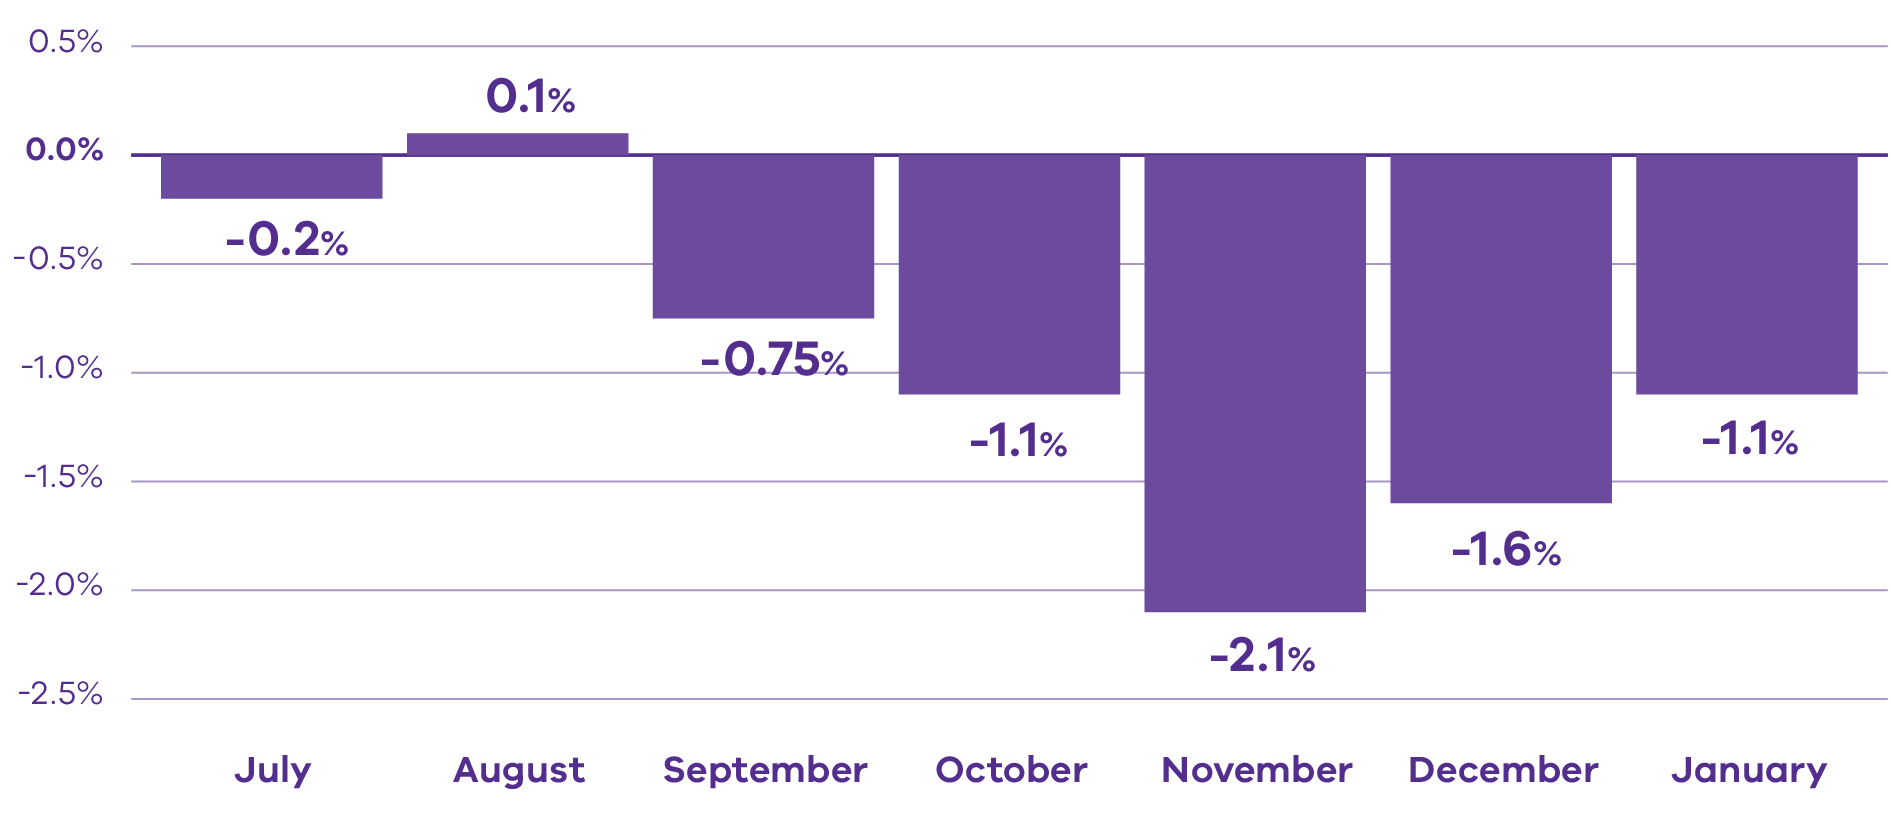
The Koala Index for a blue gum plantation company’s operation has been calculated for the months of July to January (Figure 2 – note: this is not based on real data). To determine compliance, examination against the quality control indicators is required:
| Has the Koala Index been below -3 in any one month? | No |
| Has the Koala Index been less than -2 over two of three consecutive months? | No |
| Has the Koala Index been less than -1 over four of five consecutive months? | Yes |
| Has the Koala Index been below 0 for eight consecutive months? | Insufficient data |
| Has the Koala Index been steadily decreasing for six consecutive months? | No |
| Has the Koala Index been alternating up and down for 14 consecutive months? | Insufficient data |
One of the quality control indicators is met and the Conservation Regulator commences compliance action.
Figure 2 Example data showing the Koala Index over time. This graph is not based on real data.
Updated