This includes the nature of contracts held (full-time, part-time, casual or other; ongoing versus fixed-term), average number of hours and days worked, and amount of unpaid work undertaken.
Exploring these conditions can assist in understanding any challenges this workforce may face in undertaking their work, and aid in the interpretation of subsequent results throughout this report.
Overall, the Census results indicated that the roles held within the specialist family violence response workforce were highly varied in terms of working hours and contract conditions (i.e. ongoing versus fixed-term).
Most employees reported that the number of hours they were employed to work was equivalent to the number of hours they ideally wanted to be employed. Over half also worked additional unpaid hours at least ‘sometimes’.
Figure 3 illustrates that respondents were most commonly employed on a full-time basis (58%), while 38% were employed on a part-time basis, and just 3% were casual or sessional employees.
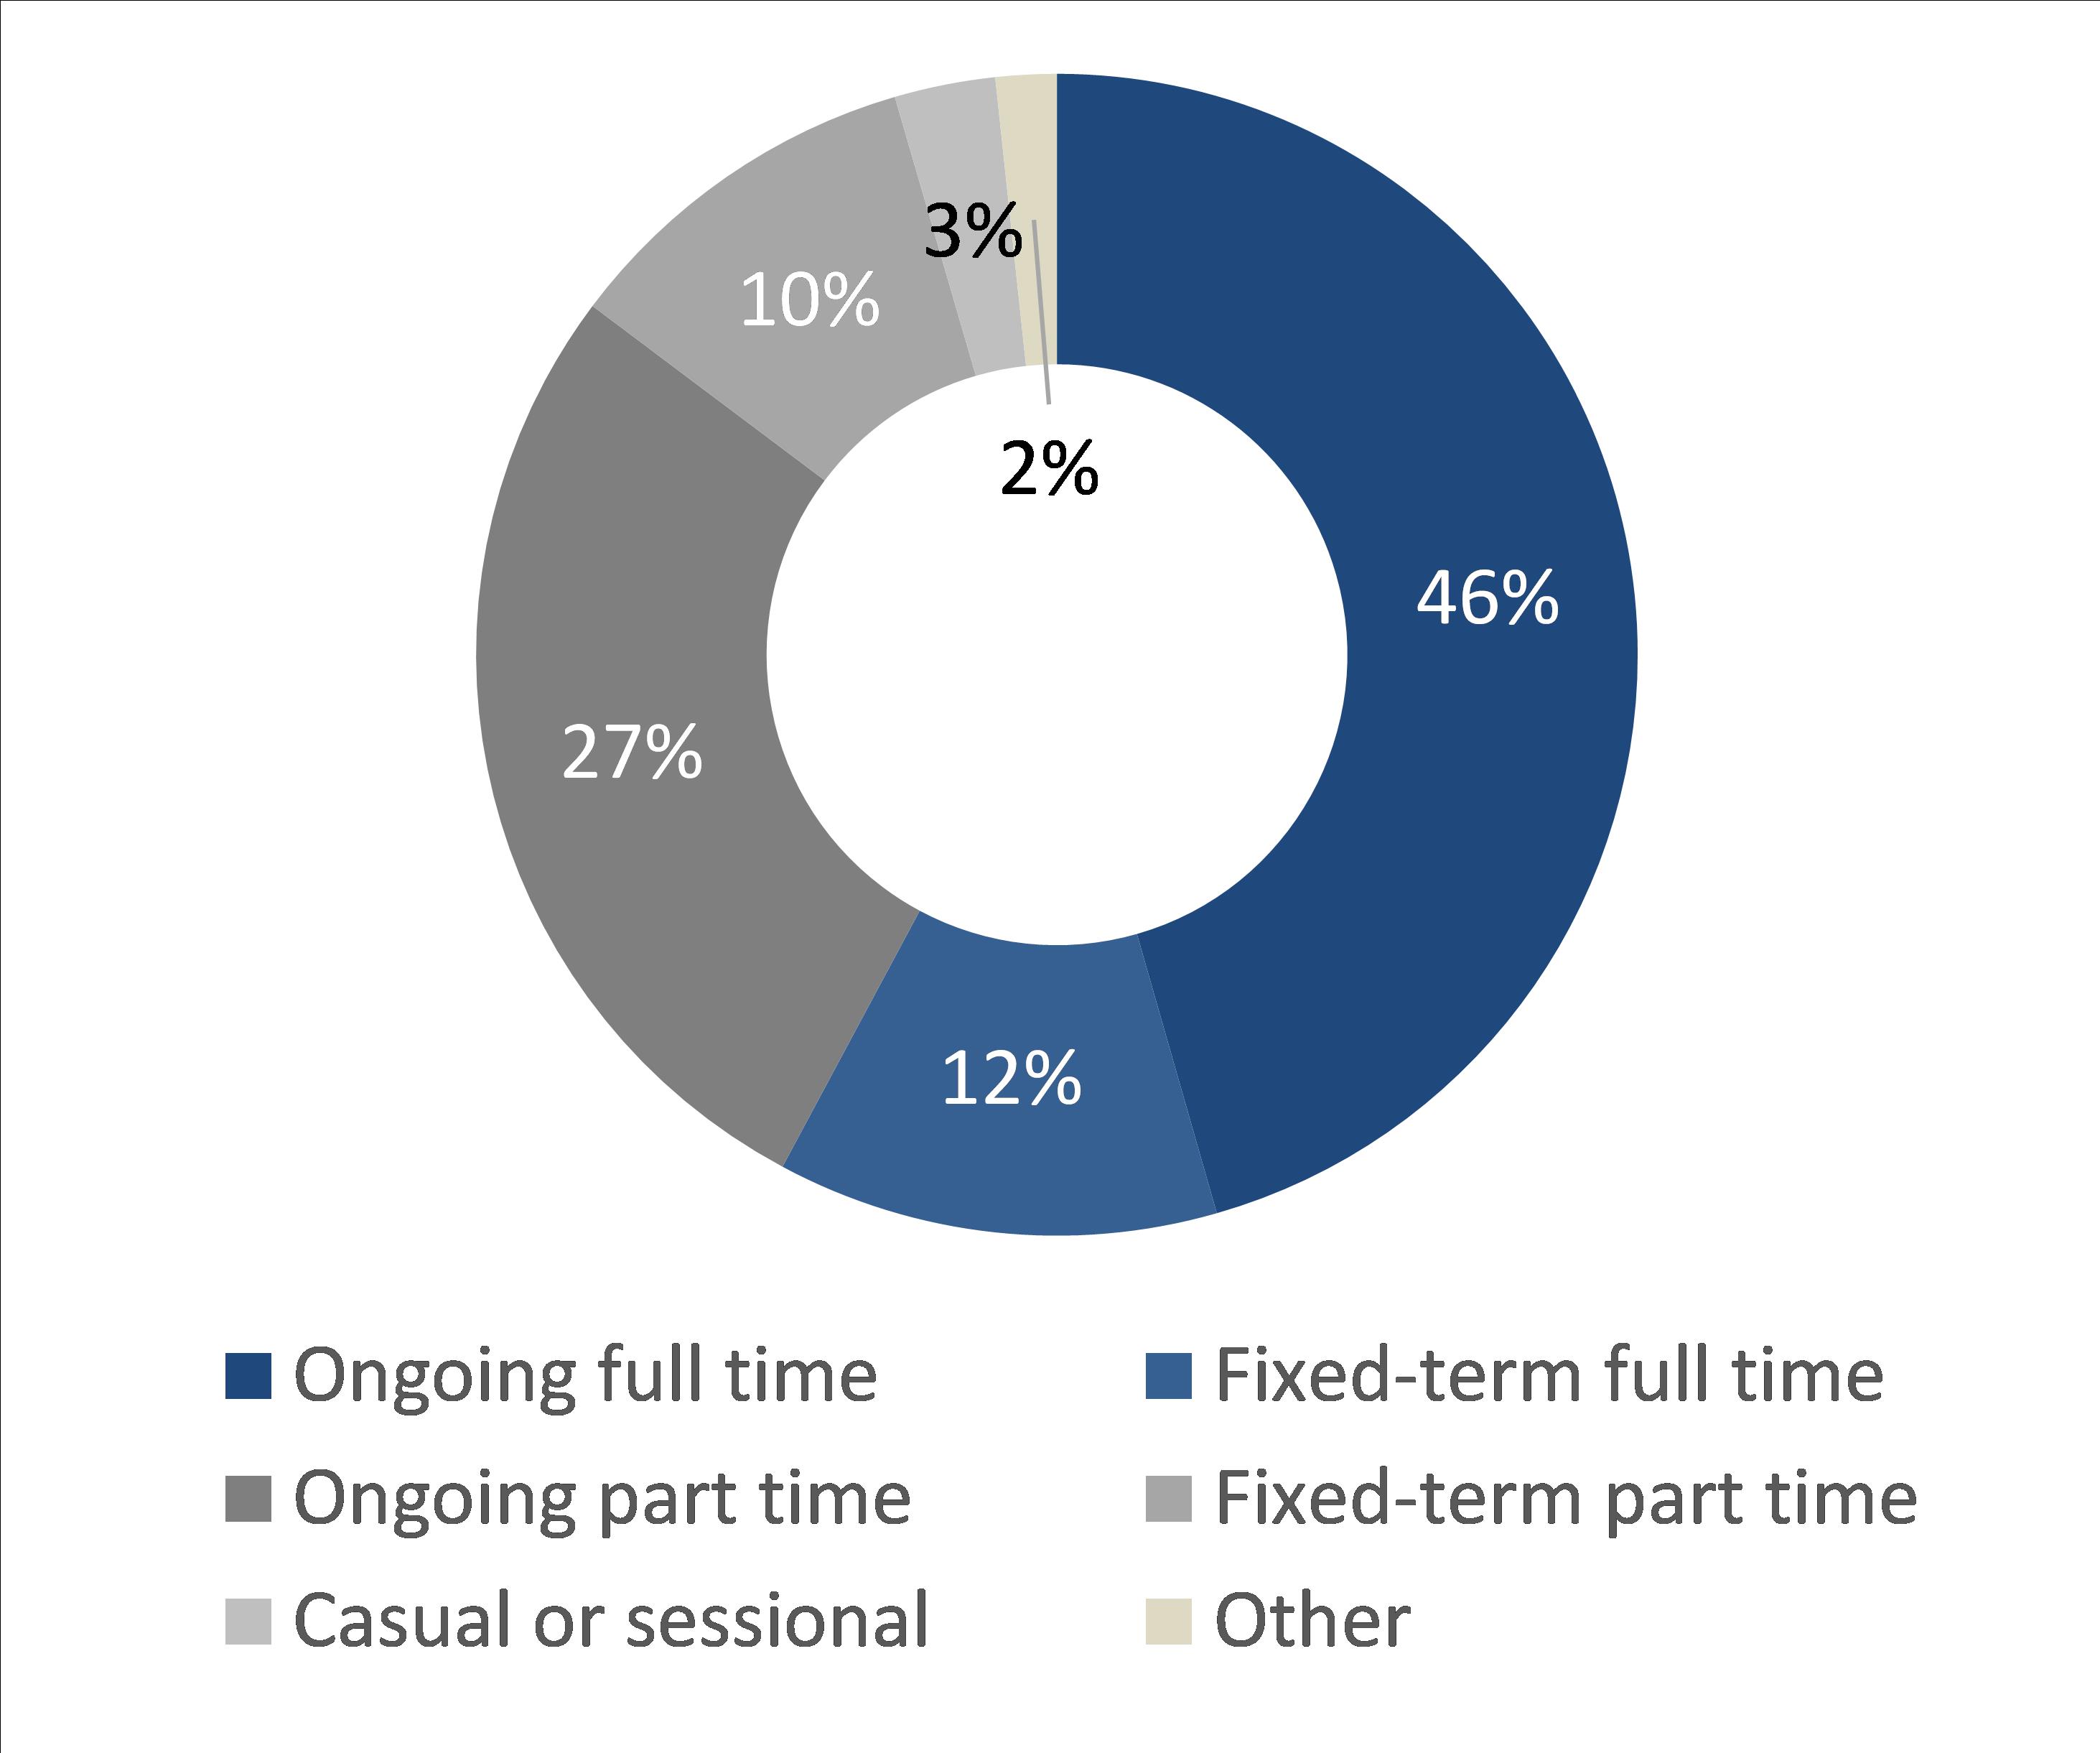
Furthermore, almost three-in-four respondents indicated that they were employed in an ongoing capacity (73%), while 23% held fixed-term roles.
Just over one-in-ten reported that they held at least one additional paid role outside of the specialist family violence response workforce (12%), and 7% held more than one paid role within this workforce.
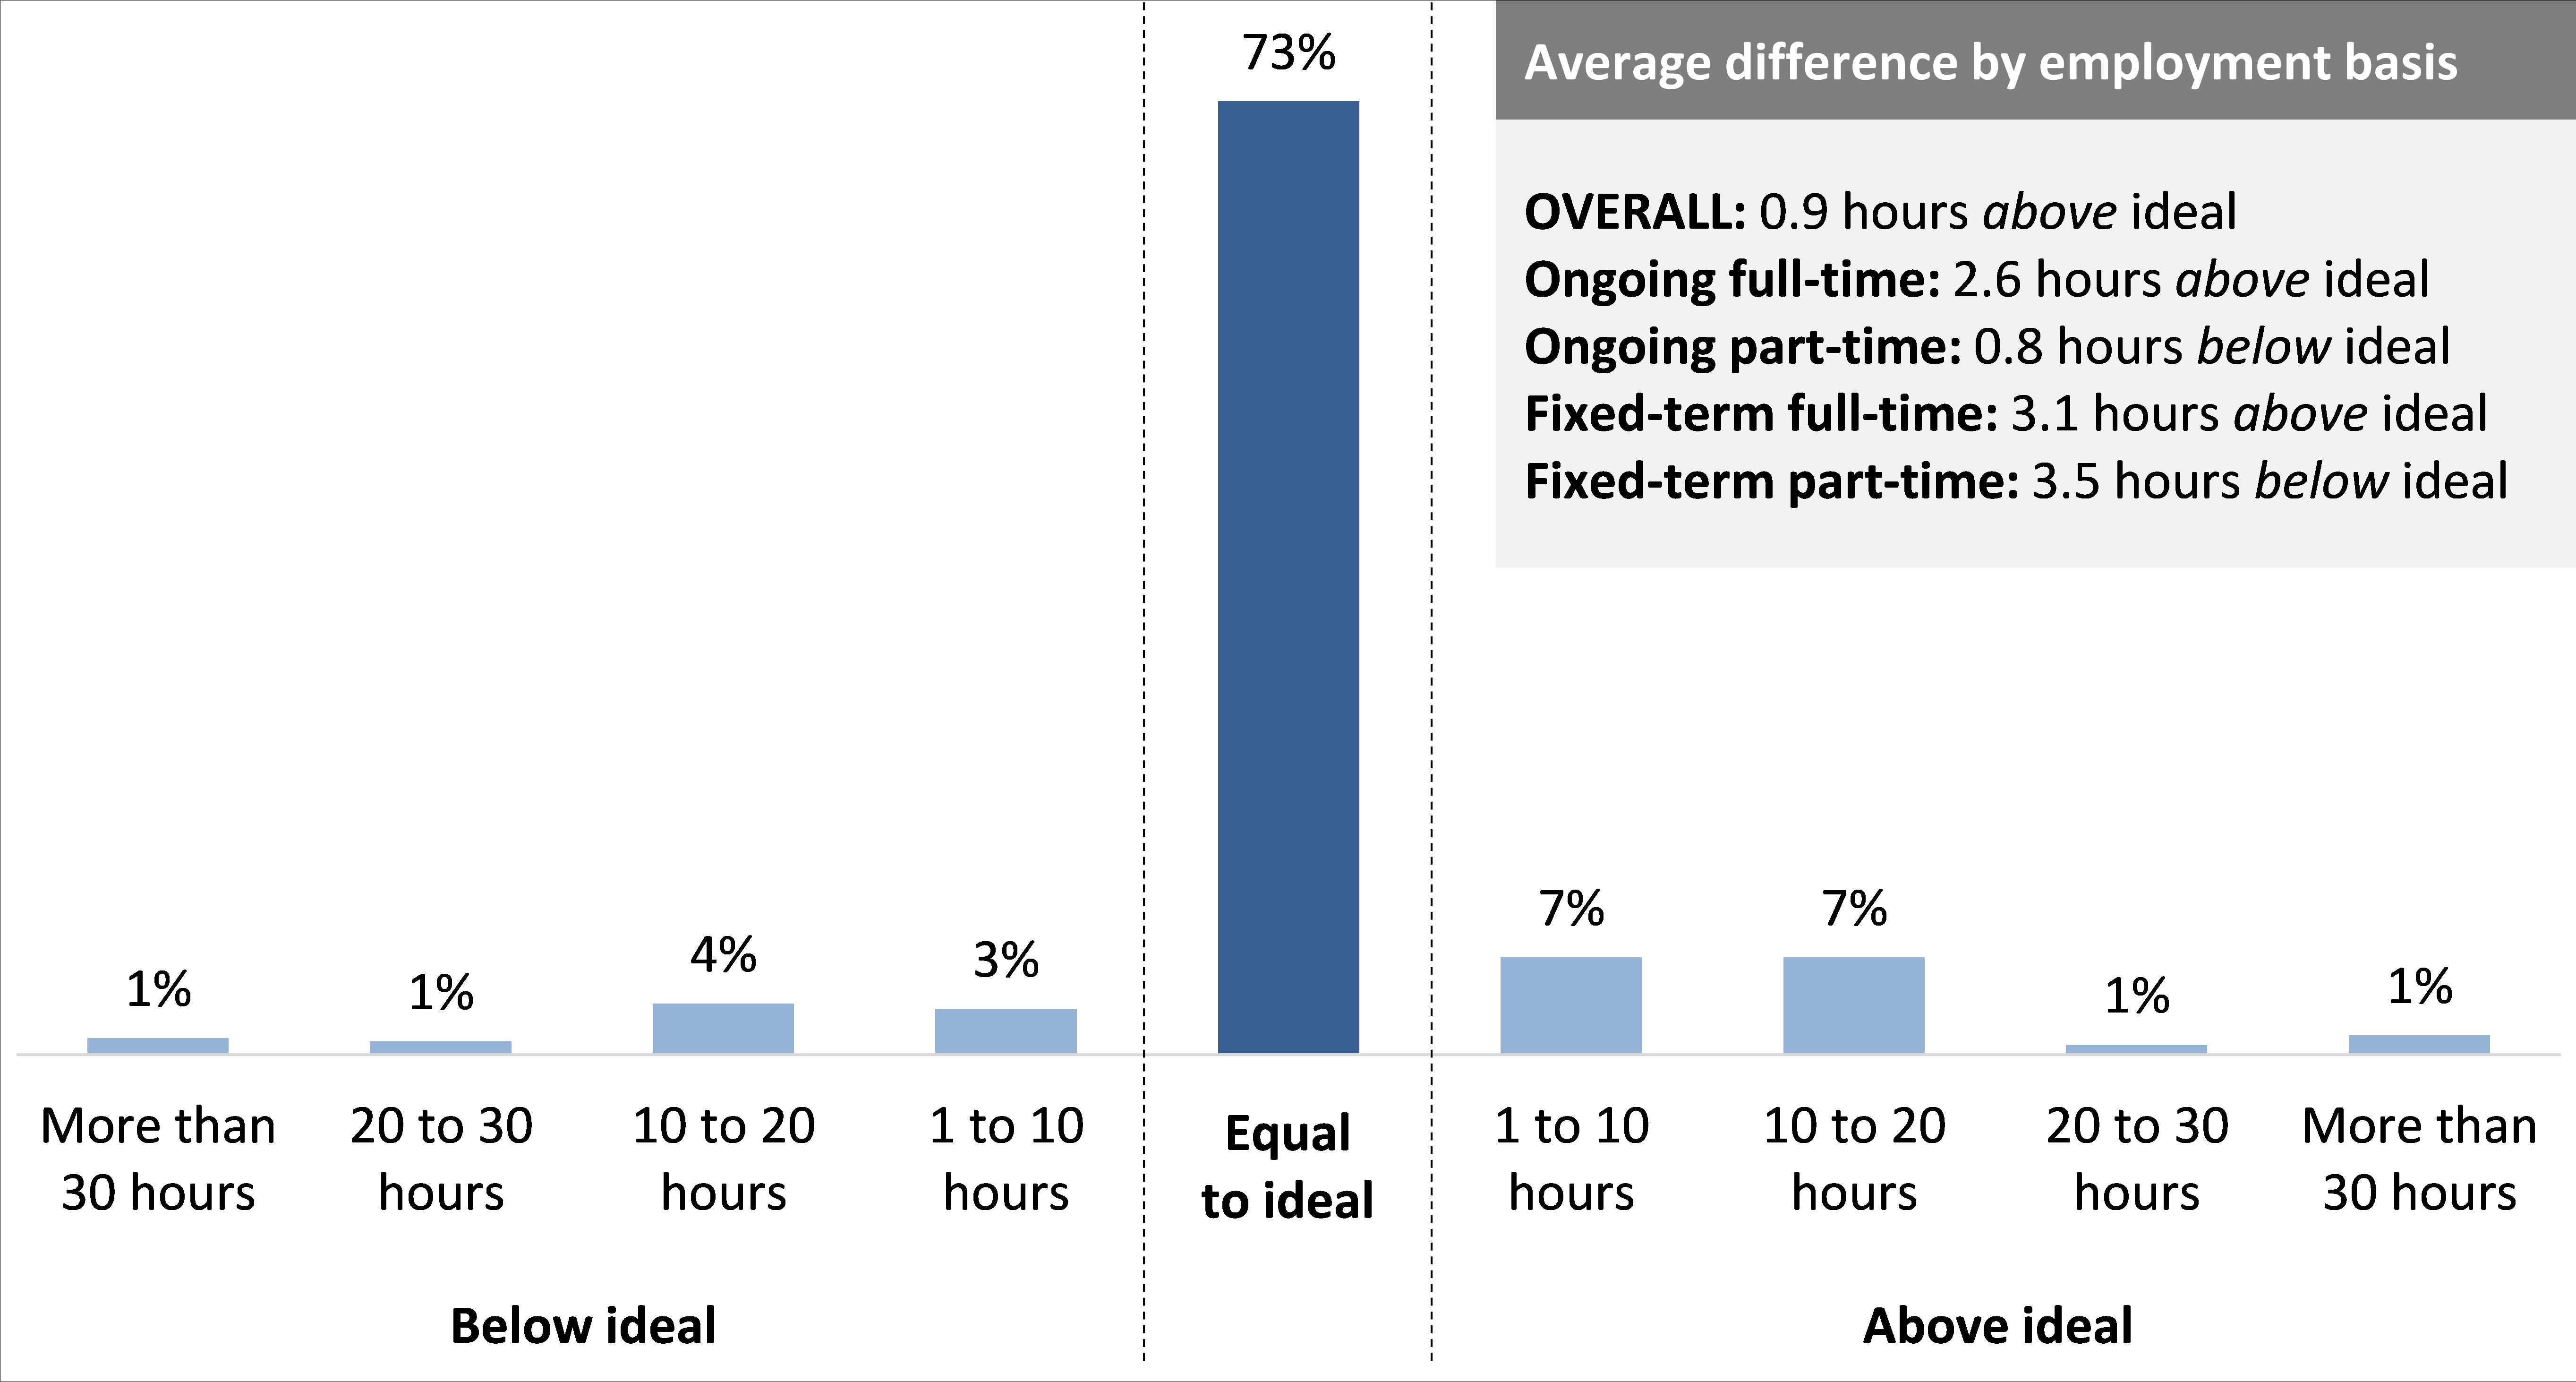
As shown in Figure 4 overleaf, the majority of the workforce (73%) reported that in the past fortnight, the number of hours they were employed to work was equivalent to the number of hours they ideally wanted to be employed to work in this role. Those who reported that their hours worked were not ideal were slightly more likely to indicate that they worked in excess of their ideal hours (17%), compared to below their ideal hours (10%).
The difference between actual and ideal hours worked naturally varied by basis of employment, with part-time employees (particularly those in fixed-term roles) being generally more likely than full-time employees to report a desire to have been employed for a greater number of hours in the last fortnight.
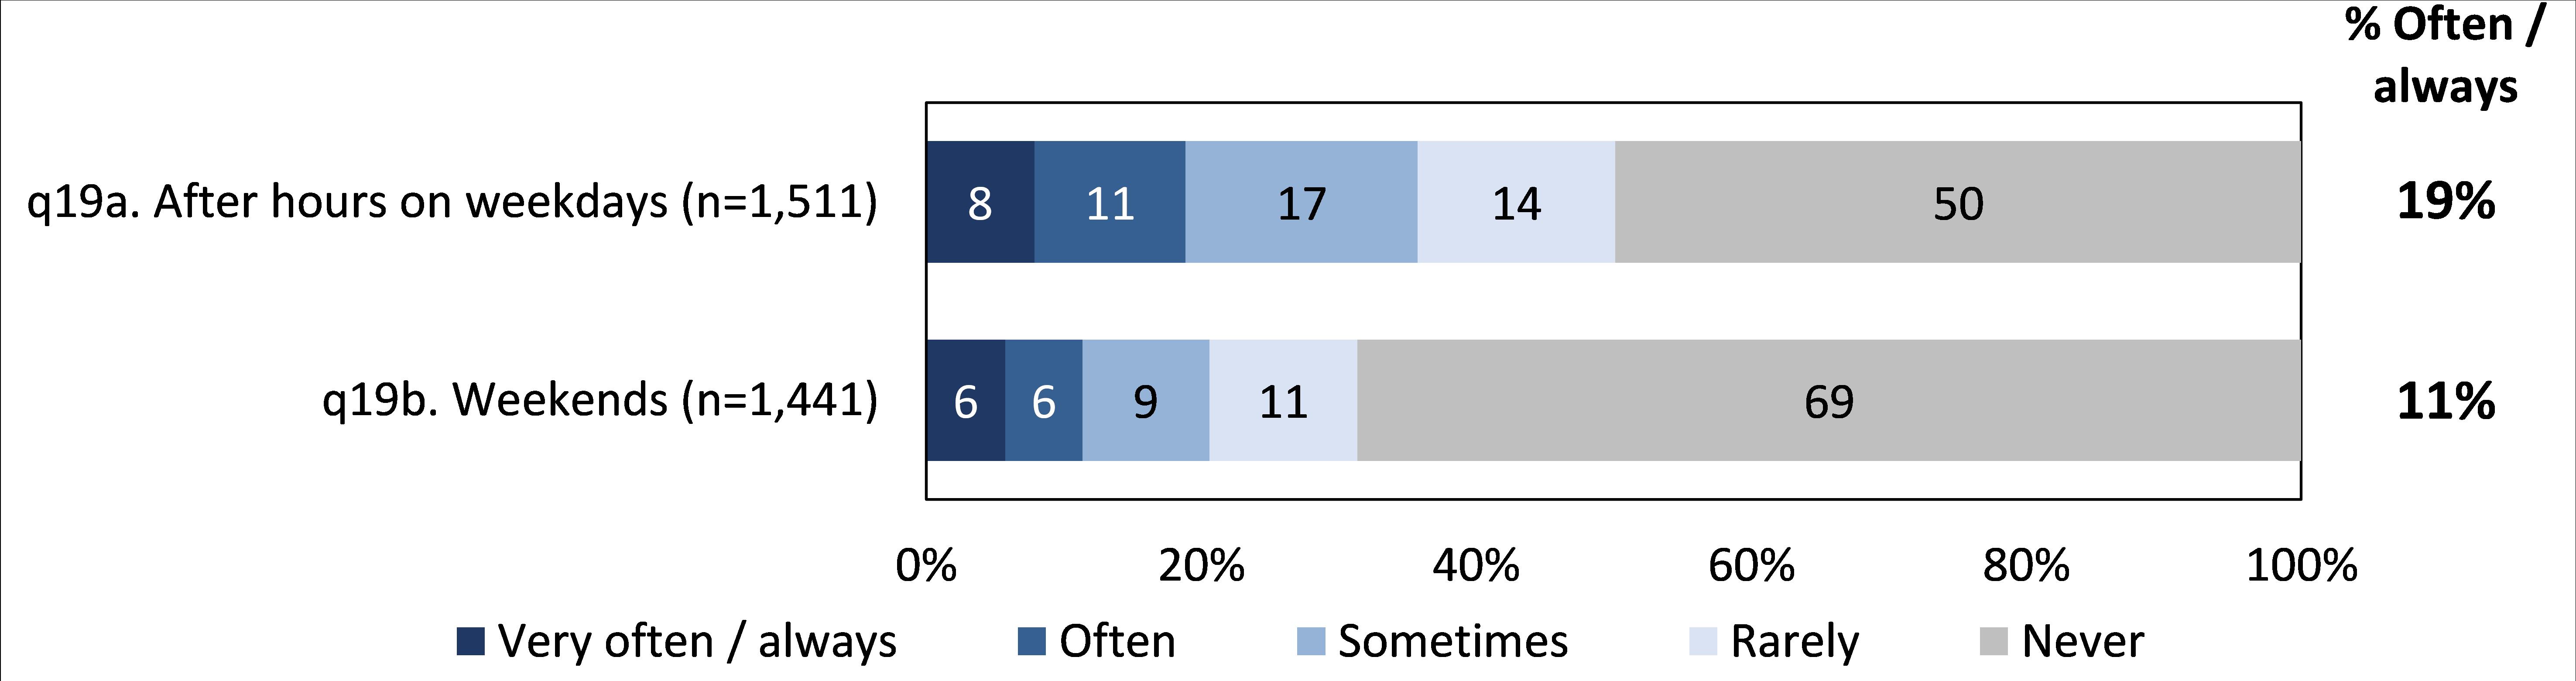
The majority of respondents were generally paid to undertake their work during normal business hours. Around one-in-five reported that they were frequently1 paid to undertake their work after hours on weekdays (19%), while 11% were frequently paid to work on weekends (see Figure 5).
Furthermore, respondents were also asked to provide comment about any unpaid work that they undertook. Overall, fewer than one-in-three respondents indicated that they frequently worked additional unpaid hours (17% often and 14% very often / always), though a further 26% reported that they sometimes did.
Footnotes
- ‘Often’ or ‘Very often / always’
- Those working in child protection also reported that they frequently undertook paid work outside of normal business hours (20%-33%), however these results should be treated with caution due to the low sample size (n=15).
- Practitioner responsible for partner and family contact responsibilities as part of a Men’s Behaviour Change Program.
Updated