- Published by:
- Fire Services Implementation Monitor
- Date:
- 21 Dec 2023
Country Fire Authority (CFA) and Fire Rescue Victoria (FRV) provided their performance updates for the first quarter of the financial year 2023-24 (1 July to 30 September 2023). These updates inform the Fire Services Implementation Monitor's (FSIM) 2023-24 Quarter 1 Fire Services Outcomes Framework Progress Report.
CFA continues to report against its 2022-23 Outcomes Framework and has reported on all quarterly indicators and three annual indicators.
The December 2022 cyber-attack continues to affect FRV's data availability and its ability to fulsomely report on its Outcomes Framework. FRV reported on 12 out of 19 indicators from its Outcomes Framework. FSIM understands that FRV continues to work towards restoring its IT systems and data access for future reporting. FSIM has now published three years of CFA and FRV outcomes framework progress data. FSIM considers it important that the agencies, as far as practicable, explain what actions they are taking that are impacting results, particularly with respect to key public safety indicators and those that demonstrate progress towards longer-term strategies.
In this report, the FSIM reports by exception on the following results:
- FRV continues to meet its target for percentage of emergency medical responses within 9.2 minutes for the 13th consecutive quarter (Q1 2020-21 to Q1 2023-24), and reports that training, appropriately equipped appliances and collaboration with Ambulance Victoria have contributed to this result.
- CFA continues to perform well in its smoke alarm installation and maintenance program for vulnerable people with 72 per cent of its 2023-24 target met in Q1. Smoke alarm maintenance and installations are part of a suite of CFA home fire safety activities scheduled in the winter period. CFA also work with local councils and community networks to reach households at risk.
- CFA has seen a significant decrease in workplace injuries for staff and volunteers this quarter compared to Q4 2022-23. However, CFA reported an increase in WorkCover claims, fifty per cent of which are mental health claims. CFA report that they will investigate whether there are systemic factors influencing this result.
- FRV has reported reduced performance in all measures under the indicator ‘Increase support and maintenance of firefighters’ physical and psychological health’ since Q4 2022-23.
- FRV has not met its target for ‘Percentage of response to structure fire incidents within 7.7 minutes’ since Q2 2020-21 (12 consecutive quarters). FRV advised that travel time can be affected by access to the scene of the incident, location of the nearest FRV station, appliance availability to respond and variation between stations in time it takes to turnout.
- CFA did not meet the baseline for their indicators that measure the average time it takes to suppress structure fires and the time it takes to control bushfires. CFA recognises there are a range of factors that can influence this outcome.
FSIM acknowledges CFA and FRV for their ongoing cooperation and active contribution to FSIM’s monitoring and reporting activities.
1. Summary
This Fire Services Outcomes Framework Progress Report provides the Country Fire Authority (CFA), and Fire Rescue Victoria (FRV) fire services outcomes framework performance indicator results and commentary for Quarter 1 (Q1) of the 2023-24 financial year (FY). This report also presents historical data on CFA and FRV performance compiled by the Fire Services Implementation Monitor (FSIM) and FSIM commentary by exception.
This report is provided in accordance with FSIM’s requirements under section 141 of the Fire Rescue Victoria Act 1958 (FRV Act). FSIM publishes these quarterly reports at Fire Services Implementation Monitor publications.
FSIM Observations
Due to ongoing impacts of the cyber-attack incident in December 2022, FRV was again unable to report fulsomely on their outcome indicators. FRV reported on 12 (out of 19) quarterly indicators, and 19 measures out of 29 quarterly measures. CFA reported against all its quarterly indicators and three annual indicators from its outcomes framework.
I have now published three years of CFA and FRV quarterly outcomes data demonstrating:
- trends of agencies not meeting targets (e.g. FRV structure fire response times),
- agencies reporting on indicators which are heavily influenced by factors outside of their control (e.g. CFA number of house fires and number of grass and scrub fires and FRV number of preventable non-structure fire incidents), and
- a significant lack of data (and therefore fulsome reporting) by FRV.
Agencies consider the published outcomes important to their strategic goals and many outcomes and indicators relate to the safety of staff, volunteers and the broader Victorian public. Reflecting on published data and commentary received over the first three years of outcomes reporting, the following questions continue to arise:
- What actions are agencies taking when a rolling baseline, benchmark, target or broader intention (e.g. decrease/increase of an indicator) is not met?
- What are the impacts on Victorian public safety of not meeting these benchmarks, baselines, targets or broader intentions?
- When will FRV be able to fulsomely and retrospectively report on all indicators?
- Should outcomes, indicators or measures be amended or adjusted to more effectively capture the agencies’ role in delivering an outcome?
I have acknowledged in previous outcomes framework progress reports that reporting on outcomes is a long-term proposition and agencies have matured their data collection, analysis, and reporting approaches and frameworks. While agencies are not yet able to fulsomely answer these questions with respect to many of their indicators, it is important for agencies to, as far as practicable, explain what actions they are taking that are impacting results, particularly with respect to key public safety indicators and those that demonstrate progress towards longer-term strategies.
I recognise that this level of detail is not feasible nor appropriate on a quarterly basis due to the significant data collection and complex analysis required. However, there is benefit in yearly commentary on whether agencies consider their progress against outcomes as aligned to their longer-term vision and whether agencies consider that they are on the right pathway to deliver their intended outcomes.
I look forward to agencies being able to more fulsomely address these questions in future reports this financial year and encourage agencies to take action to address any agency-identified deficiencies in the outcomes, indicators and measures in their current frameworks and provide this information to the Victorian public.
Reporting on outcomes
Section 140(1) of the FRV Act requires CFA and FRV to each prepare an outcomes framework that sets out their respective outcomes-based fire service performance measures. In developing outcomes frameworks, CFA and FRV each determined their strategic organisational priorities and the associated indicators and measures of performance to be included in those frameworks. FSIM has published CFA and FRV progress reports for
Q1 2023-24 as appendices to this report.
Tracking the progress of agencies towards their outcomes is a long-term proposition and trends or patterns may only be observable over an extended period. FSIM therefore provides commentary by exception on indicators and measures that:
- demonstrate a notable achievement.
- show a continuing off-track trend over repeated quarter.
- vary more than 5 per cent from the agency’s baseline or average over time.
- are a significant change from the previous quarter (positive or negative).
FSIM notes that some performance measures are influenced by factors outside the control of CFA or FRV and in some instances, agencies may not be able to provide substantiated reasons, supported by evidence, for changes to results.
Maturing outcomes frameworks
Outcomes frameworks, when used to guide decision-making, can inform progress towards strategic goals and provide insights to inform how agencies respond and adapt to emerging trends. Ongoing review and refinement of outcomes frameworks is important to assist agencies to assess progress towards delivering against their objectives and support informed, evidence-based decision making.
CFA and FRV outcomes frameworks are based on each agencies’ strategic priorities. CFA and FRV set their own relevant indicators and measures, and agencies have been reporting on their outcomes frameworks since July 2020. Reflecting on three years of quarterly results, there is an opportunity for agencies to more comprehensively demonstrate how the outcomes frameworks and results are informing strategy, planning, and decision-making. When metrics are trending negatively, or where a metric is significantly influenced by factors outside of the agency’s control, agencies have the power to be accountable and identify an appropriate response to reverse the trend or re-evaluate the intended purpose of metrics to drive organisational change and continuous improvement.
For example, FSIM has observed a concerning trend that FRV has not met its target for measure ‘2.1.3a Percentage of response to structure fire incidents within 7.7 minutes (target 90 per cent)’ since Q2 2020-21 (12 consecutive quarters). FRV has indicated that factors outside of its control have consistently contributed to this trend. As part of FRV’s proposed outcomes framework review, there is an opportunity for FRV to:
- undertake further analysis, in districts where this target has been met, to identify the extent to which factors external and internal to FRV have contributed to meeting this target.
- fulsomely report on the extent to which external and internal factors contribute to not meeting FRV’s target.
- develop a new measure(s) to monitor and report on factors within FRV’s control to meet this target. This will allow for more meaningful reporting; it will also allow FRV to monitor the impact of its interventions to influence this measure.
For these frameworks to be useful in the context of the wider Fire Services Reform, agencies have provided information to demonstrate how they are using their data to guide decision-making, adapt responses or amend metrics and measures to be more useful and appropriate.
Updates to the agencies’ outcome frameworks for Q1 are outlined below.
CFA’s outcomes framework 2023/24
There have been no changes to CFA’s outcomes framework this quarter.
CFA is currently finalising the annual review of its outcomes framework with the Year 4 outcomes framework expected to be applied in Q3 outcomes reporting. Minimal changes are expected given the substantive update in 2022.
CFA advises the changes being considered will support greater clarity and transparency to reporting. Often when new indicators are introduced, historical (baseline) data is not available. The opportunity to enhance (or introduce) baselines and targets will be considered when the Year 4 outcomes framework is applied to Q3 reporting. The review process presents an opportunity for CFA to review targets and baselines and create new ones, where appropriate. FSIM supports the use of evidence-based targets and baselines where appropriate, as they can provide a level of accountability, clarify organisational expectations, and enable a more comprehensive understanding of the impact of interventions or activities. This in turn can make reporting more comprehensive and useful for future use.
FRV’s outcomes framework 2023/24
This quarter, FRV incorporated a new measure ‘3.4.1b: Number of incidents outside of FRV district’ under the indicator ‘3.4.1: Increase in collaboration, consultation and advocacy with Country Fire Authority and other sector stakeholders to continually improve community safety and emergency management.’ FRV considers that this measure provides an indication of cooperation with the CFA in the Country Area of Victoria (CAoV).
From Q1 2023-24, FRV has discontinued reporting on the quarterly measure ‘% WorkCover claims who ceased work with no return to work’ (formerly 3.1.1a). FRV report that it does not believe it was a meaningful indicator of the impact of FRV’s return to work activities due to the way the indicator is measured. FRV report that under its Health Model program, work is underway to establish a health, safety and wellbeing reporting framework informed by metrics that demonstrate progress in a more meaningful way.
FRV advise that they are intending to undertake a fulsome review of their Outcomes Framework once a dedicated performance management specialist has been onboarded. Recruitment for this position will commence in January 2024, with the review expected to be completed within a 12-month period. All measures within the current outcomes framework will be subject to this review, as are other FRV performance measures deemed within scope. The review will determine the scale of potential changes to the outcomes framework.
There is an opportunity for the review to consider FSIM’s observations as part of this process and clarify timelines for when the review will be finalised and when FRV’s revised outcomes framework will be available. As noted with CFA’s review, FSIM also sees an opportunity for FRV to consider the use of evidence-based targets and baselines where appropriate, to provide additional transparency on FRV’s progress.
FRV cyber-attack impacts on outcomes framework reporting
FRV report that the cyber-attack in December 2022 continues to have a severe impact on its information and computer technology systems. FRV is still unable to access the Australian Incident Reporting System (AIRS) (a national database that collects data on fire services reported incidents and response) and FireCode (a service management tool that captures the scheduling of fire protection maintenance of fire safety assets) and cannot provide results on operational indicators and subsequent measures for:
- 1.1.1 Decrease in preventable fires in homes
- 1.1.3 Increase in homes with working smoke alarms
- 1.2.1 Decrease in preventable fires in higher-risk buildings
- 1.2.2 Decrease in impact from fire due to early detection and suppression systems
- 1.2.4 Number of services provided by Fire Equipment Services (FES) to maintain fire protection equipment and essential safety measures in the built environment.
- 3.3.1 Increase in use of and participation in research, data analytics and evaluation to support evidence-based decision making and improvements to community and firefighter safety.
FRV also advise that due to the cyber-attack, it cannot report on measure ‘2.1.3a Percentage of response to Road rescue responses within 13.5 minutes (target 90 per cent)’, which informs the indicator ‘2.1.3 Improved readiness for all emergencies, including large or complex incidents, for specialist rescue, and for times of surge demand’.
FRV confirm that it is not able to retrospectively populate metrics as there has been no extensive post-incident data recording while AIRS and FireCode have been unavailable. FRV reports that AIRS is likely to be restored by the end of 2023, and FireCode will likely be restored by April 2024. Once AIRS and FireCode have been restored, FRV can commence reporting on associated metrics.
In the interim, FRV has obtained data from the Emergency Services Telecommunications Authority (ESTA) Computer Aided Dispatch (CAD) system as an alternative to AIRS data. FRV confirms that ESTA CAD data has been validated to ensure its integrity and comparability. FRV reported that a comparative analysis of both data sets, for a period before the cyber-attacks, confirmed that the difference between the two data sets did not materially affect the results. FRV found that incident volumes and response times were similar for Structure Fire, EMR and Code 1 classifications in both data sets.
FRV reported five operational measures using ESTA CAD data in Q1 2023-24:
- Number of properties with six or more false alarms on different days (rolling 12 months)
- Number of structure fire incidents
- Number of incidents other than structure fires and other non-fire related incidents
- Percentage of response to structure fire incidents within 7.7 minutes
- Percentage of response to EMR (emergency medical response) within 9.2 minutes.
Industrial action impacting FRV data quality
FRV advised that FRV staff undertook industrial action during the periods of 27 October 2022 to 20 April 2023 and on 12 August 2023. From this industrial action, when FRV staff responded to ‘False alarm’, ‘False Call’ or ‘Good intent calls’, they reported such calls as ‘Other’. This has had an impact on FRV’s ability to reliably report on indicator ‘1.2.3 Decrease in unwanted false alarms to reduce unnecessary emergency response’ and the ‘False Alarms and False Calls’, ‘Good intent calls and ‘Other’ categories for measure ‘1.3.3: Decrease in preventable non-structure fires and other hazard related incidents’ during reporting periods: Q2, Q3, Q4 2022-23 and Q1 2023-24.
Due to a separate ongoing protected industrial action undertaken by some CFA staff, FRV have advised that it has modified data reporting to reflect results for metropolitan appliances only when reporting on measure ‘2.1.3b: Total operational fleet availability’. FRV report that since the start of this industrial action in the end of March 2023, reporting on fleet availability has been limited due to regional appliance information being unavailable.
2. Outcomes framework Q1 results
In this section, FSIM highlights CFA and FRV indicators and measures that show a continuing off-track trend over repeated quarters, demonstrates a notable achievement, varies more than 5 per cent from the agency’s baseline or average over time, or is a significant change from the previous quarter (positive or negative).
As noted above, FRV’s data limitations constrain FSIM’s ability to assess FRV quarterly progress on all indicators and measures.
2.1 Demonstrates a notable achievement
Analysis of results that demonstrated a notable achievement: FRV emergency medical response, CFA decrease in workplace injuries, CFA smoke alarm installation and maintenance.
2.2 Continuing off-track trend over repeated quarters
Analysis of results that demonstrated a continuing off track trend over repeated quarters: FRV response to structure fire incidents.
2.3 Varies more than 5 per cent from the agency’s baseline or average over time
Results that varied more than 5 per cent from the agency’s baseline or average over time: CFA structure fire suppression, FRV support and maintain firefighters physical and psychological health.
2.4 Significant change from the previous quarter (positive or negative)
Results that significantly changed from the previous quarter (positive or negative): CFA time to control bushfires, FRV number of preventable non-structure fire incidents, CFA new WorkCover claims.
2.1 Demonstrates a notable achievement
2.1.1 FRV emergency medical response (EMR)
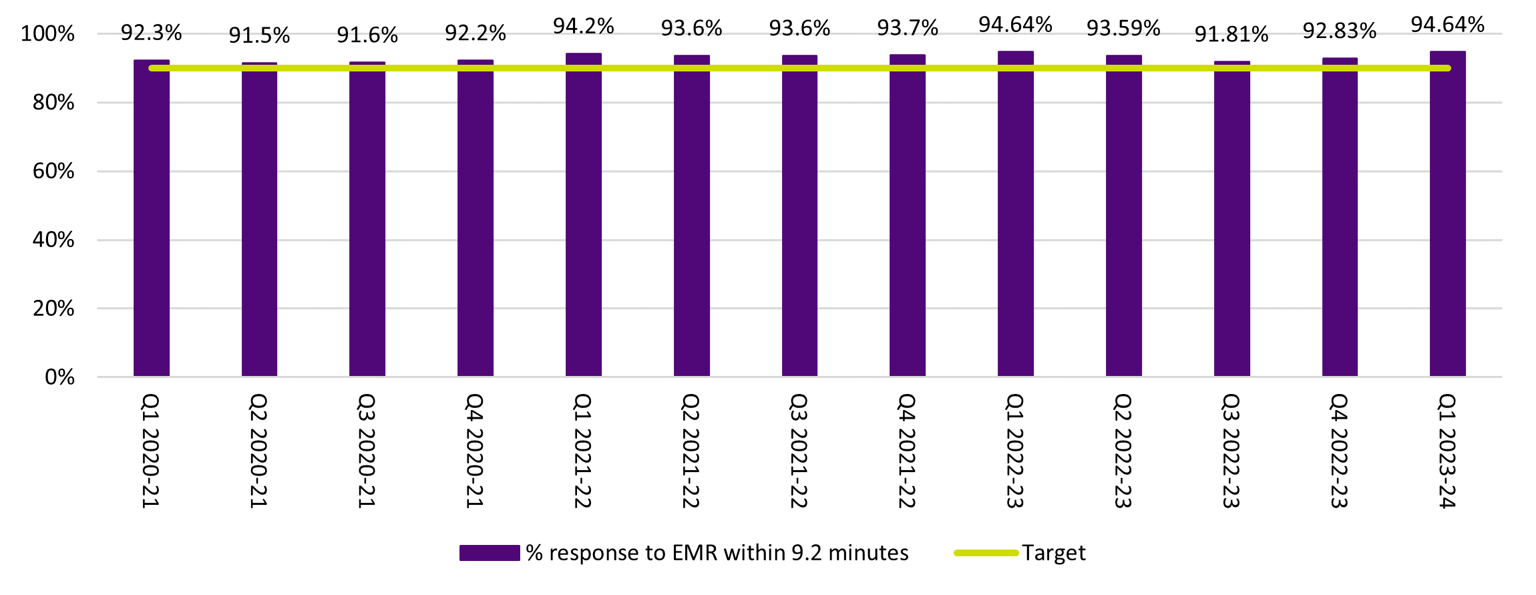
FRV continues to achieve its target for percentage of response to EMR within 9.2 minutes (measure 2.1.3a) in FRV districts. FRV reported a result of 94.64 per cent and has met the target of 90 per cent over 13 consecutive quarters, which is a good result for the community (see Figure 1). FSIM notes that FRV recorded 1511 EMR incidents in FRV districts (measure 1.3.1).
FRV advise that the following factors have contributed to this result:
- collaboration with Ambulance Victoria in delivering firefighter EMR training and co-responding to EMR calls
- having EMR qualified firefighters responding to relevant calls on EMR capable appliances and
- introducing standardised EMR capabilities and oxygen resuscitation equipment across the fleet.
Data note
Prior to the December 2022 cyber-attack, FRV reported this measure by sourcing data from AIRS. FRV has used data obtained from the ESTA CAD system to report this quarter’s result. FRV report that the ESTA CAD data has been validated to ensure its integrity and comparability. FRV advised FSIM that their comparative analysis confirmed that the difference between the two data sets (using ESTA CAD data instead of AIRS data) did not materially affect results.
Figure 1 includes results reported using AIRS data for results between Q1 2020-21 to Q1 2022-23 and ESTA CAD data for results reported between Q2 2022-23 to Q1 2023-24.
Figure 1: 2.1.3a Percentage of response to EMR within 9.2 minutes
Note re figure 1: Quarterly year-on-year baseline were introduced from Q2 2022-23. As reported in the Fire Services Outcomes Report Q2 2022-23, CFA has not calculated baselines retrospectively for results recorded prior to Q2 2022-23.
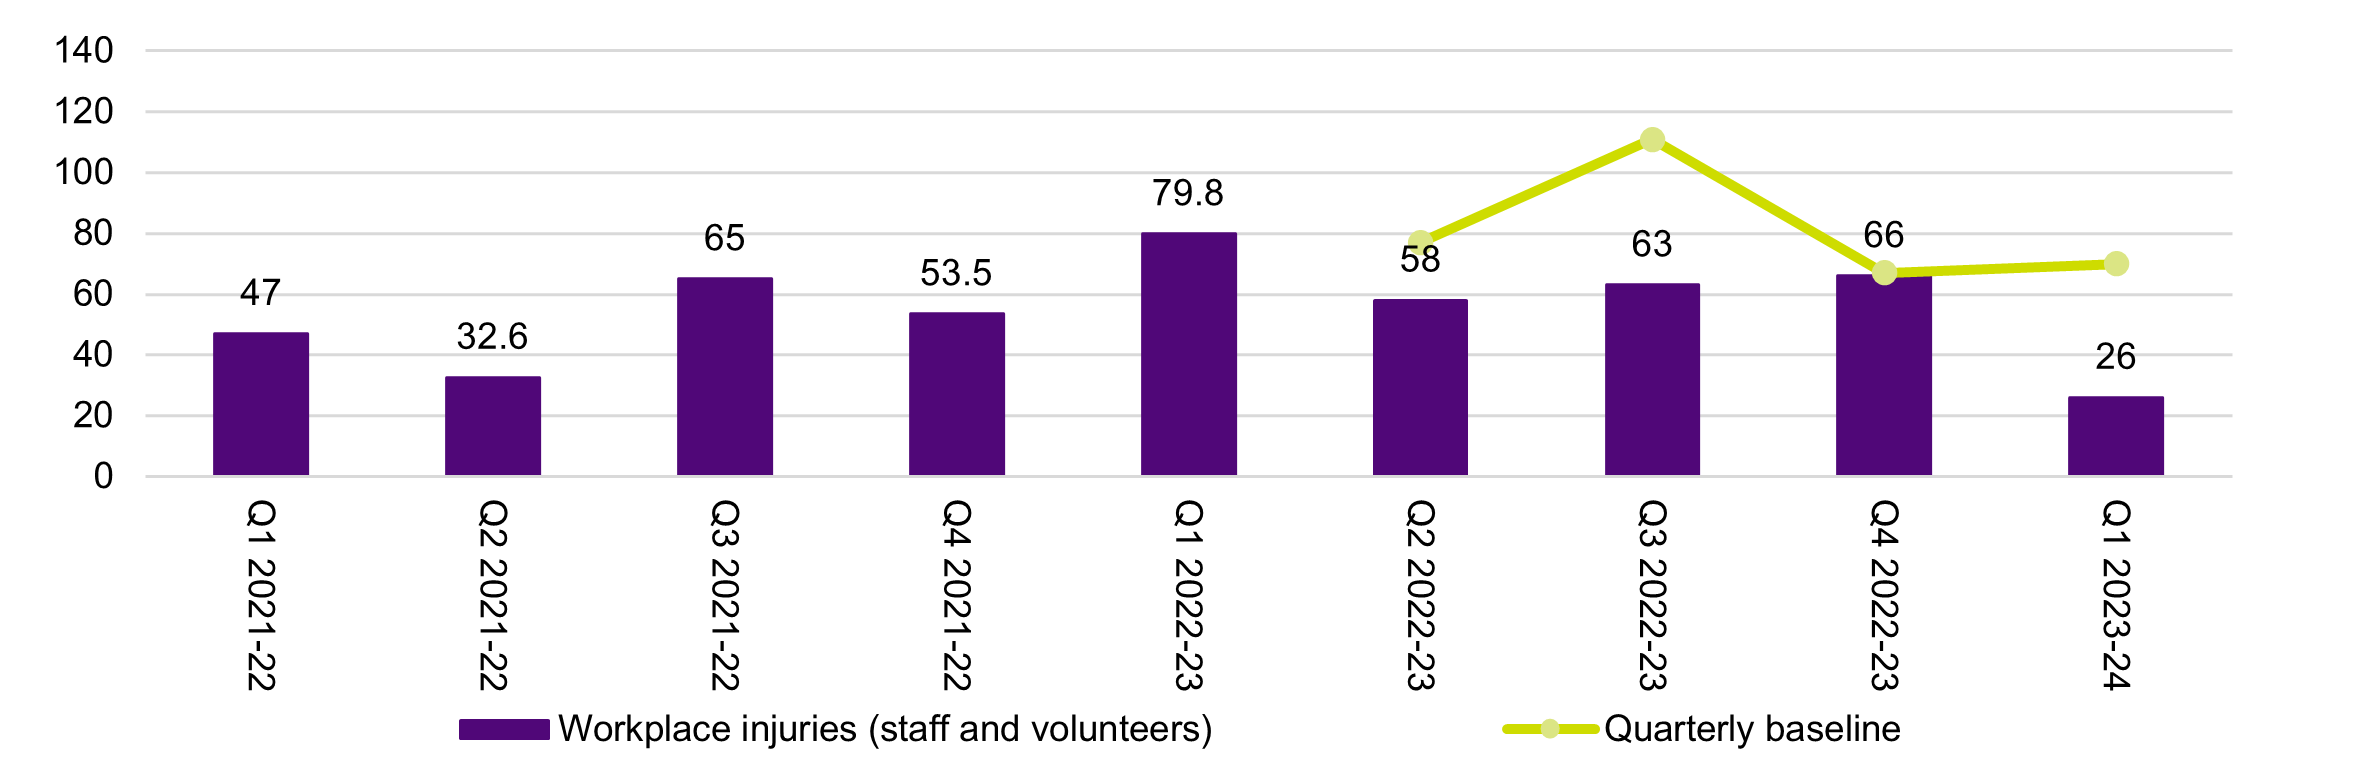
2.1.2 CFA decrease in workplace injuries
CFA reported 26 workplace injuries in Q1 2023-24 (indicator 3.1.2). This is well below the CFA quarterly baseline of 70 and a positive result for CFA volunteers and staff (see Figure 2).
CFA advise that contributing factors to the reduction in workplace injuries may include:
- work undertaken by CFA Health and Safety advisors to improve brigade health and safety awareness
- CFA hazard inspections at fire stations which aim to mitigate potential hazards and minimise risk of injury on site
- Health and Safety committees established by CFA for staff and volunteers, placing a spotlight on health and safety within CFA.
FSIM also notes that CFA continued to record an increase in hazard reporting (indicator 3.1.1) on its CFASafe system, as required under its legislation, reporting 89 this quarter, compared to 85 in Q4 2022-23 and 81 in Q3 2022-23.
Hazard reporting is used to identify hazards to mitigate risk against injuries. If a hazard is reported at a brigade (via CFASafe), CFA advise that this may prompt a hazard inspection outside those undertaken as part of the section 29 process. Action plans to respond to hazards (and incidents/near misses) are tracked in CFASafe.
FSIM notes that this positive hazard reporting trend may also be contributing to a reduction in workplace injuries at the CFA.
Figure 2: 3.1.2 Decrease in workplace injuries (staff and volunteers)

Note re figure 2: Quarterly year-on-year baseline were introduced from Q2 2022-23. As reported in the Fire Services Outcomes Report Q2 2022-23, CFA has not calculated baselines retrospectively for results recorded prior to Q2 2022-23.
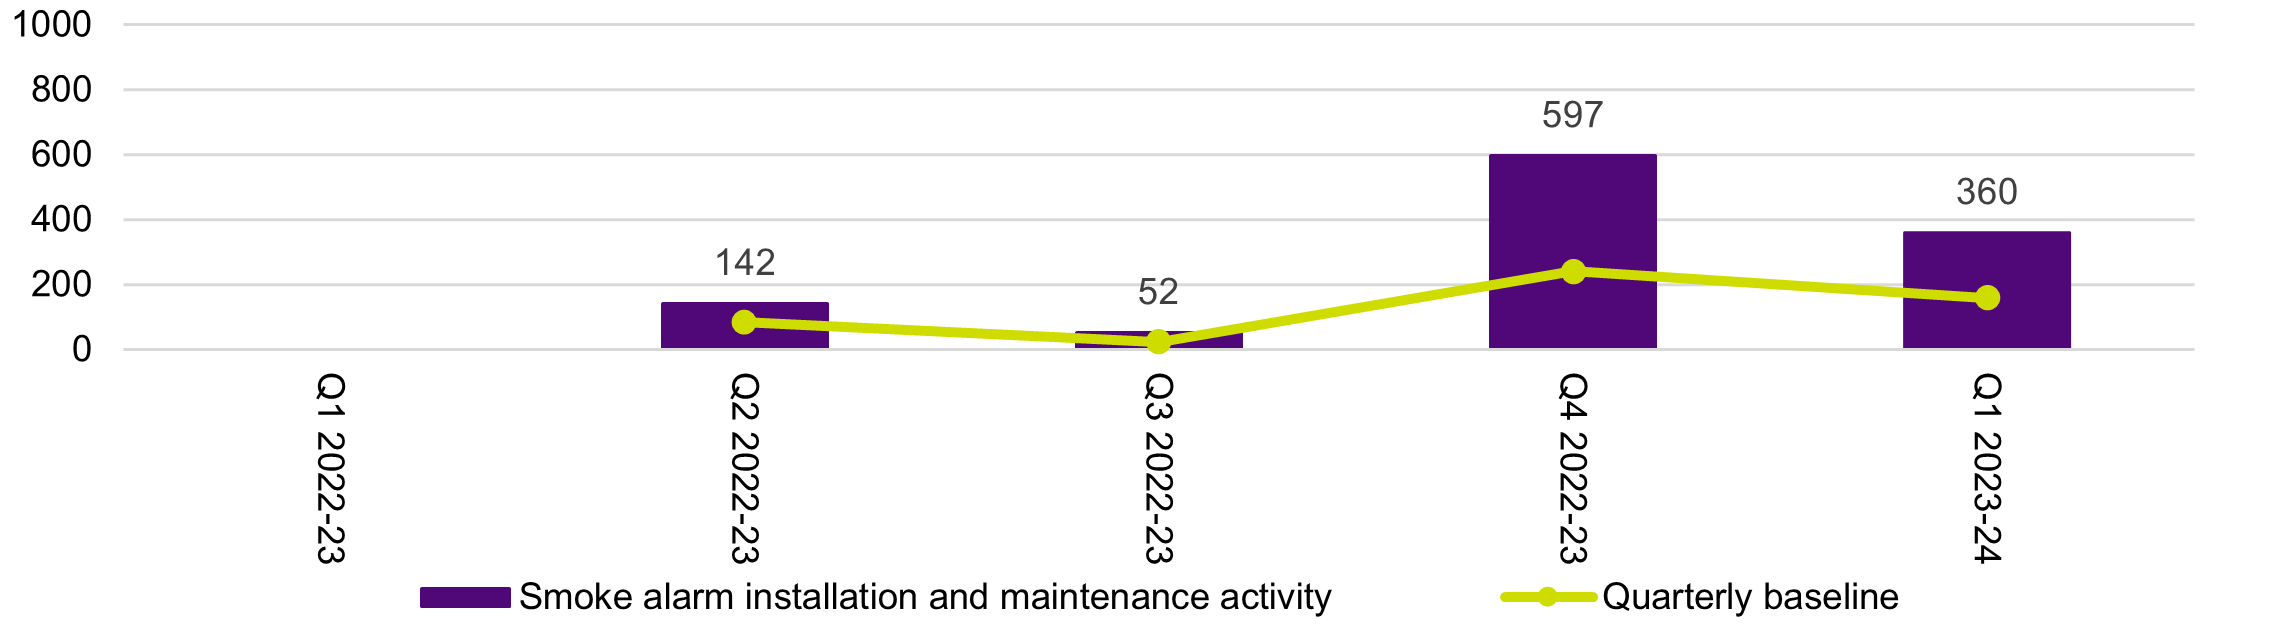
2.1.3 CFA smoke alarm installation and maintenance
CFA reported 360 smoke alarm installation and maintenance activities for vulnerable people who require assistance (indicator 2.3.6). This is an increase of 200 on the CFA quarterly baseline this quarter, and the second consecutive quarter the CFA has significantly exceeded their baseline; the Q4 2022-23 result exceeded the baseline by 356 (see Figure 3).
CFA report that smoke alarm installation is part of a suite of CFA home fire safety activities scheduled in the winter period. CFA work with local councils and community networks to reach households at risk. CFA report that a significant percentage of homes engaged had inoperable smoke alarms.
FSIM notes that CFA have completed 72 per cent of their target to achieve 500 smoke alarm installation and maintenance activities for 2023-24.
Figure 3: 2.3.6 Increase in the number of homes with operational smoke alarms

2.2 Continuing off-track trend over repeated quarters
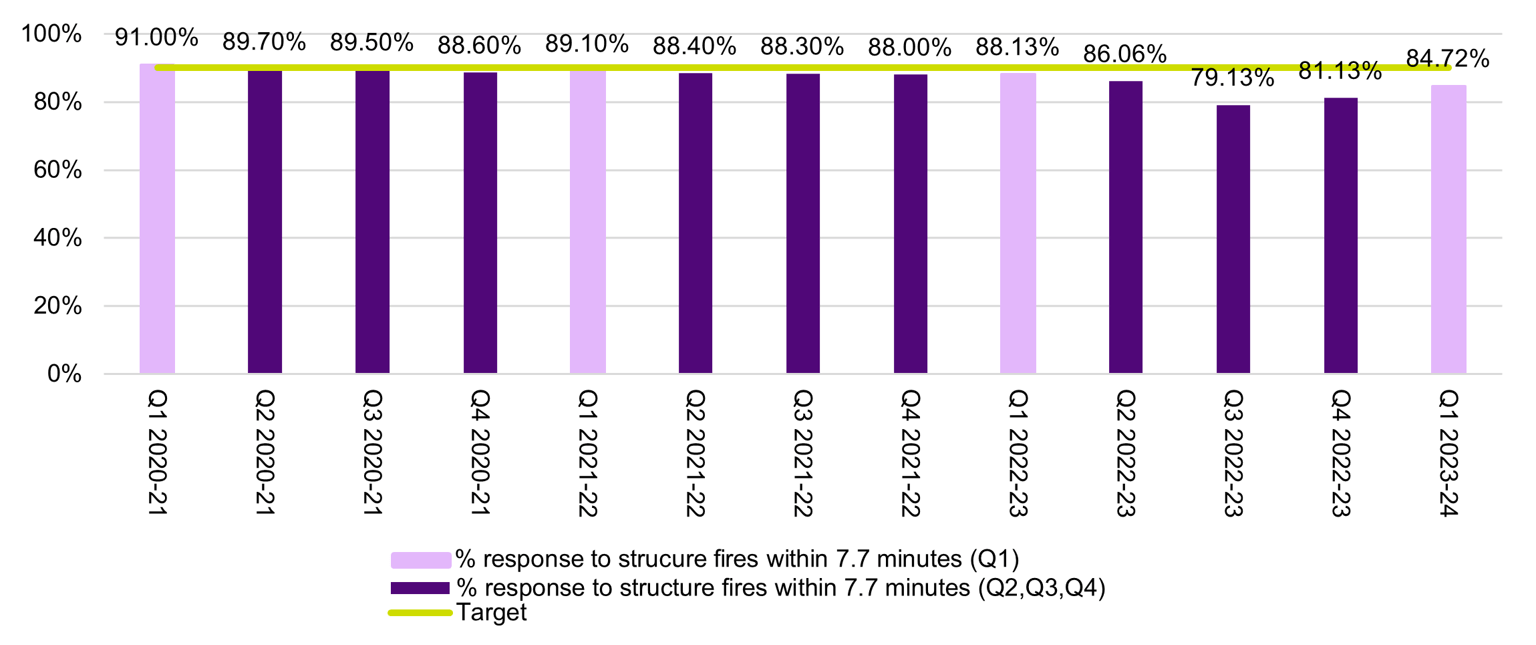
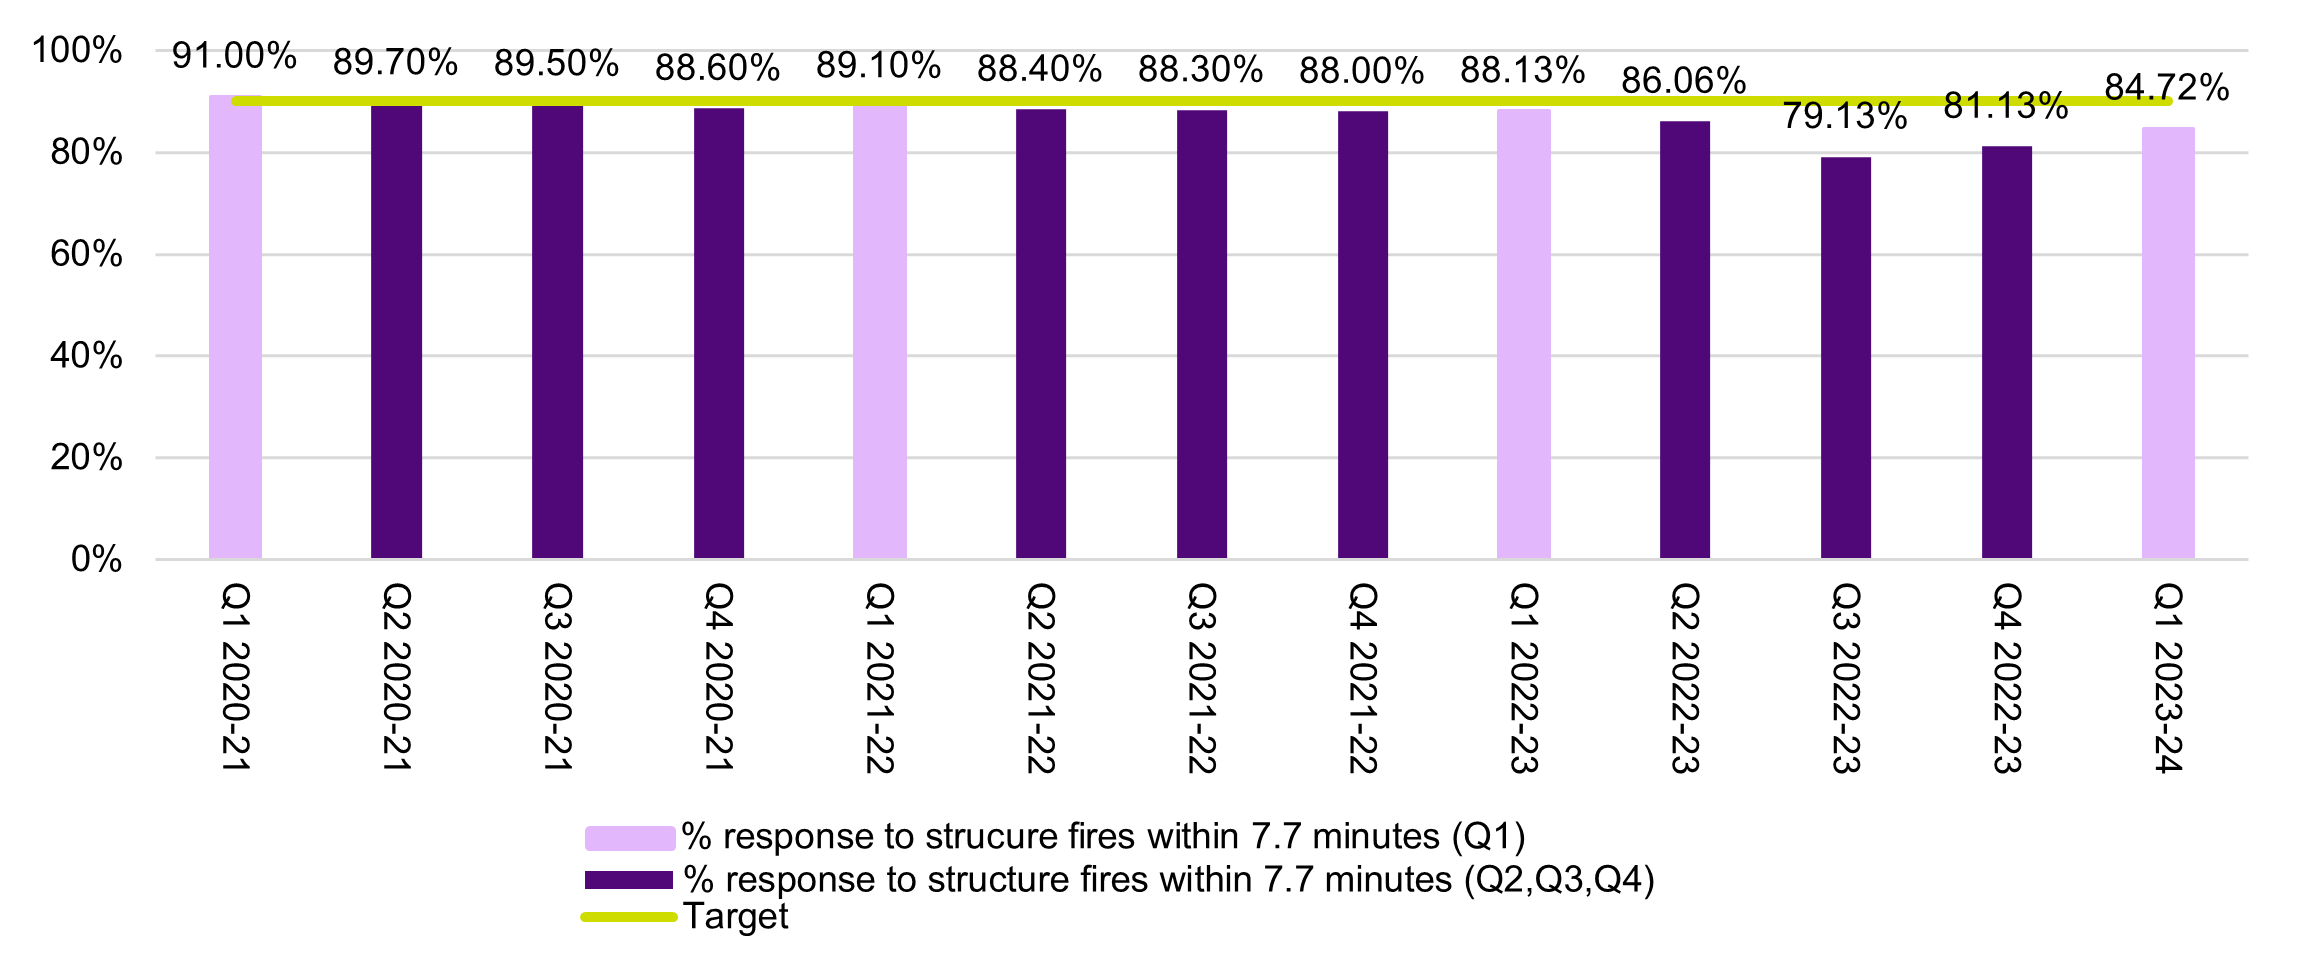
2.2.1 FRV response to structure fire incidents
FRV did not meet their target (90 per cent) in Q1, with a result of 84.72 per cent for the percentage of structure fires responded to within 7.7 minutes from the time the call was initiated by ESTA (measure 2.1.3a). FRV attributes this result to the restoration of the Station Turn Out system on 1 August 2023, following the December 2022 cyber-attack.
FSIM notes that Q1 year-on-year results across three years shows a declining trend and is the twelfth consecutive quarter where FRV has not met its target (see Figure 4). FRV advised that travel time can be affected by access to the scene of the incident, location of FRV station, appliance availability to respond and variation between stations in time it takes to turnout (i.e. the period between when the firefighters receive a call to dispatch to when they exit the station).
Data note
Prior to the December 2022 cyber-attack, FRV reported this measure by sourcing data from AIRS. Since Q2 2022-23, FRV has used data obtained from the ESTA CAD system to report this result. FRV advised FSIM that ESTA CAD data has been validated to ensure its integrity and comparability. FRV reported that comparative analysis confirmed that the difference between the two data sets (using ESTA CAD data instead of AIRS data) did not materially affect results. Figure 4 includes results reported using AIRS data for results between Q1 2020-21 to Q1 2022-23 and ESTA CAD data for results reported between Q2 2022-23 to Q1 2023-24.
Figure 4: 2.1.3a Percentage of response to structure fire incidents within 7.7 minutes (target 90 per cent)
2.3 Varies more than 5 per cent from the agency’s baseline or average over time
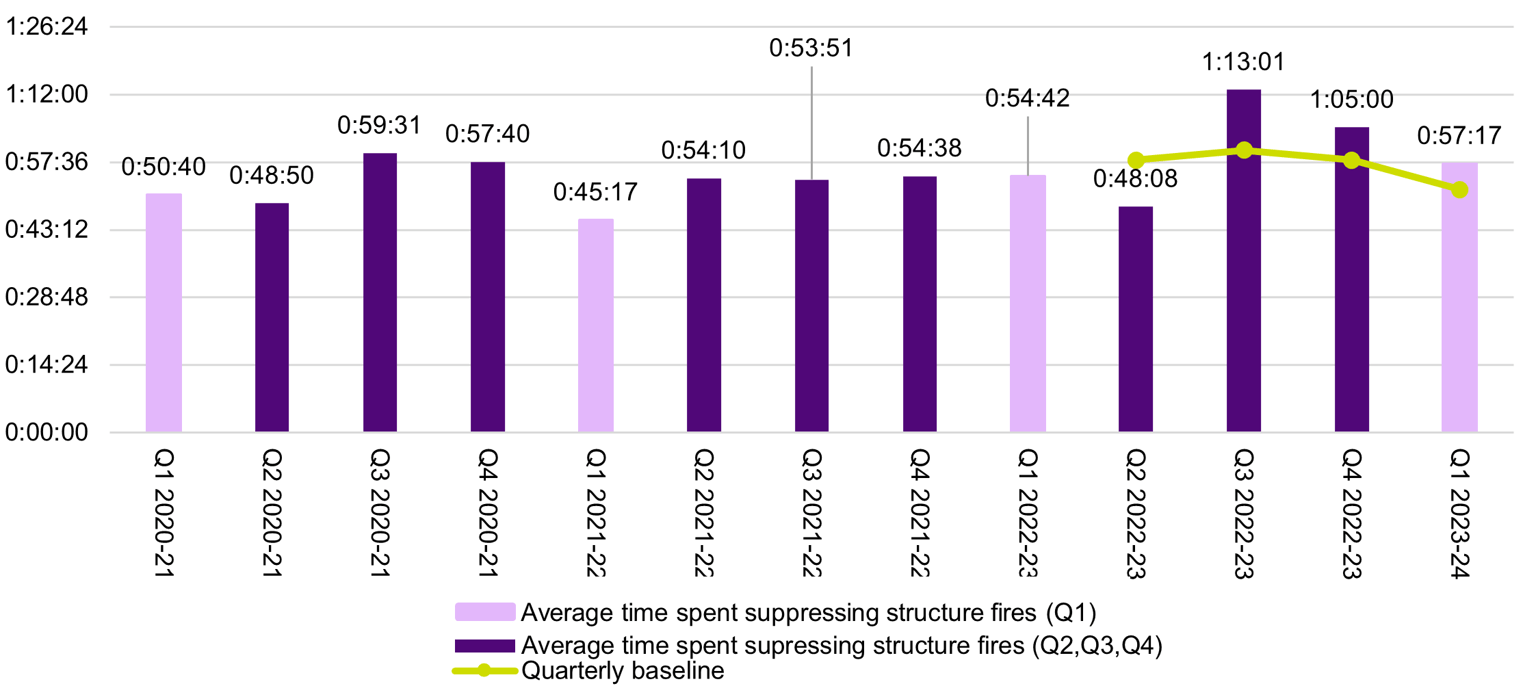
2.3.1 CFA structure fire suppression
CFA did not meet the 51 minutes and 48 seconds baseline for indicator 2.2.3 (average time spent to suppress structure fires) this quarter, although FSIM notes an improvement from 65 minutes in Q4 2022-23 to 57 minutes and 17 seconds in Q1 2023-24.
CFA advised that even though there is a 5 per cent variance from the baseline, CFA consider the result acceptable, as various factors (many outside of CFA’s control) impact this outcome. These factors include fire progression at time of arrival, building type, timeliness of support services (such as utilities) and the presence of hazardous materials. CFA reports that it has undertaken actions to raise awareness of structure fire suppression expectations amongst District Assistant Chief Officers and brigades to ensure timely ‘under control’ radio messages.
FSIM notes that in Q1 2023-24, CFA recorded the highest average time spent to supress structure fires year-on-year since Q1 2020-21, outlined in Figure 5 below.
Figure 5: 2.2.3 Decrease in the average time spent suppressing structure fires (time spent on scene of incident)
Note re figure 5: Quarterly year-on-year baseline were introduced from Q2 2022-23. As reported in the Fire Services Outcomes Report Q2 2022-23, CFA has not calculated baselines retrospectively for results recorded prior to Q2 2022-23.
FSIM notes that although the Q1 2023-24 result did not meet the quarterly baseline, CFA has demonstrated improvements in Q1 2023-24 in other indicators related to structure fire operational performance:
- indicator 2.2.1: increase in the percentage of structure fires contained to room of origin, recorded a 5.6 per cent increase on the quarterly baseline.
- indicator 2.3.5: decrease in complete structures loss due to structure fire, recorded a 3.7 per cent decrease on the quarterly baseline.
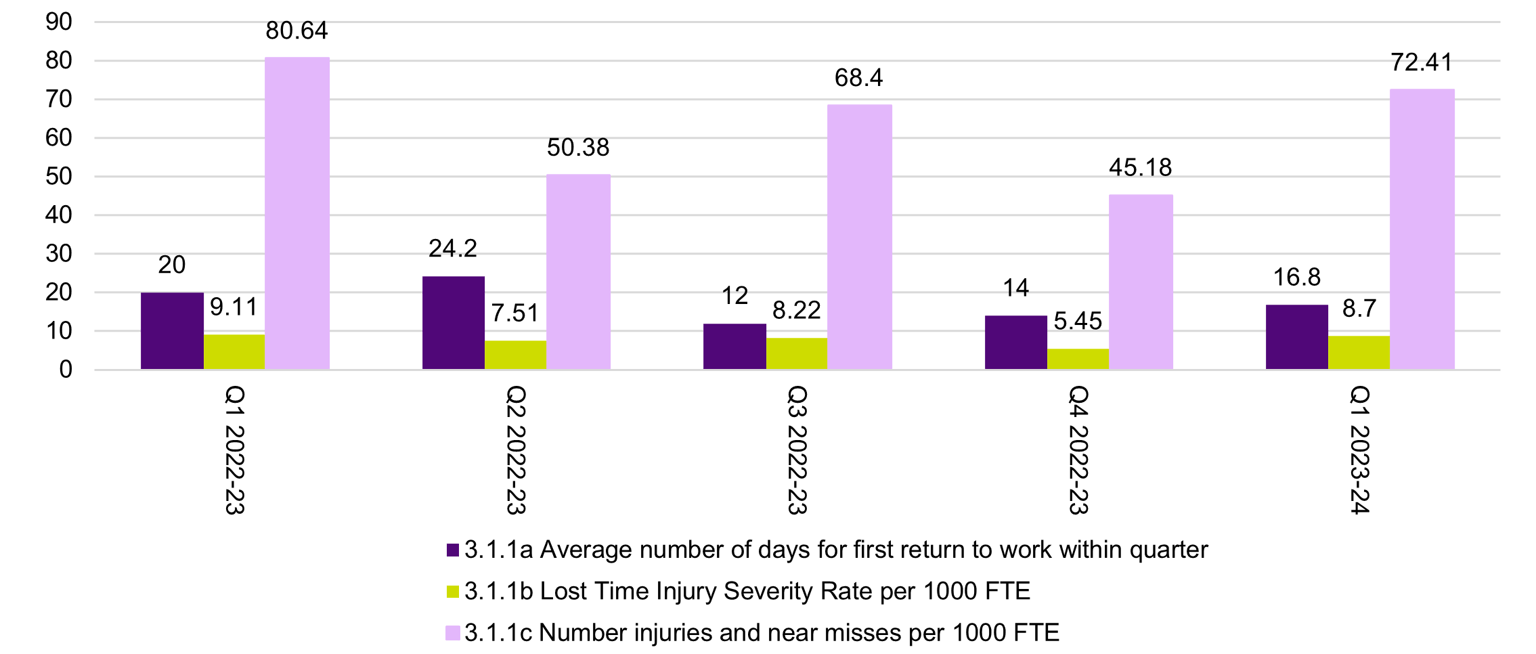
2.3.2 FRV support and maintain firefighters’ physical and psychological health
FRV has reported reduced performance in all measures under indicator ‘3.1.1: Increase in support and maintenance of firefighters’ physical and psychological health’ since Q4 2022-23 (see Figure 6 below).
FRV’s measure ‘3.1.1b: Lost time injury severity rate per 1000 FTE’ calculates the number of injuries reported into FRV’s claims database categorised as Lost Time Injuries (one or more working days/shifts lost due to injury). The result was 8.7 lost working days/shifts due to injury per 1000 FTE compared to 5.45 lost working days/shifts due to injury per 1000 FTE in Q4 2022-23. When FSIM applies a simple moving average to the measure for quarterly results since Q1 2022-23, FRV’s Q1 2023-24 result is 11.57 per cent higher than the average of 7.8.
FRV’s measure ‘3.1.1c: Number of injuries and near misses per 1000 FTE’ result was 72.41 per 1000 FTE compared to 45.18 per 1000 FTE in Q4 2022-23. When FSIM applies a simple moving average to the measure for quarterly results since Q1 2022-23, FRV’s Q1 2023-24 result is 14.21 per cent higher than the average of 63.4. Results for 3.1.1b and 3.1.1c demonstrate increases of more than 5 per cent from the average calculated from all quarterly results since Q1 2022-23.
Additionally, FSIM notes that FRV continues to record an increase on the average number of days for return to work (3.1.1a) with a Q1 result of 16.8 days. This is an increase from 12 days in Q3 2022-23 and 14 days in Q4 2022-23.
Data note
FRV advise that although the results show a reduction in performance in all measures relating to supporting and maintaining firefighters physical and psychological health, FRV does not consider this to be a meaningful indicator to understand workforce health and safety due to the way the indicator is measured. FRV has reported to FSIM that work is underway to review health, safety and wellbeing metrics as part of the FRV Health Model program implementation and a broader review into FRV’s outcomes framework.
Figure 6: 3.1.1: Increase in support and maintenance of firefighters’ physical and psychological health
2.4 Significant change from the previous quarter (positive or negative)
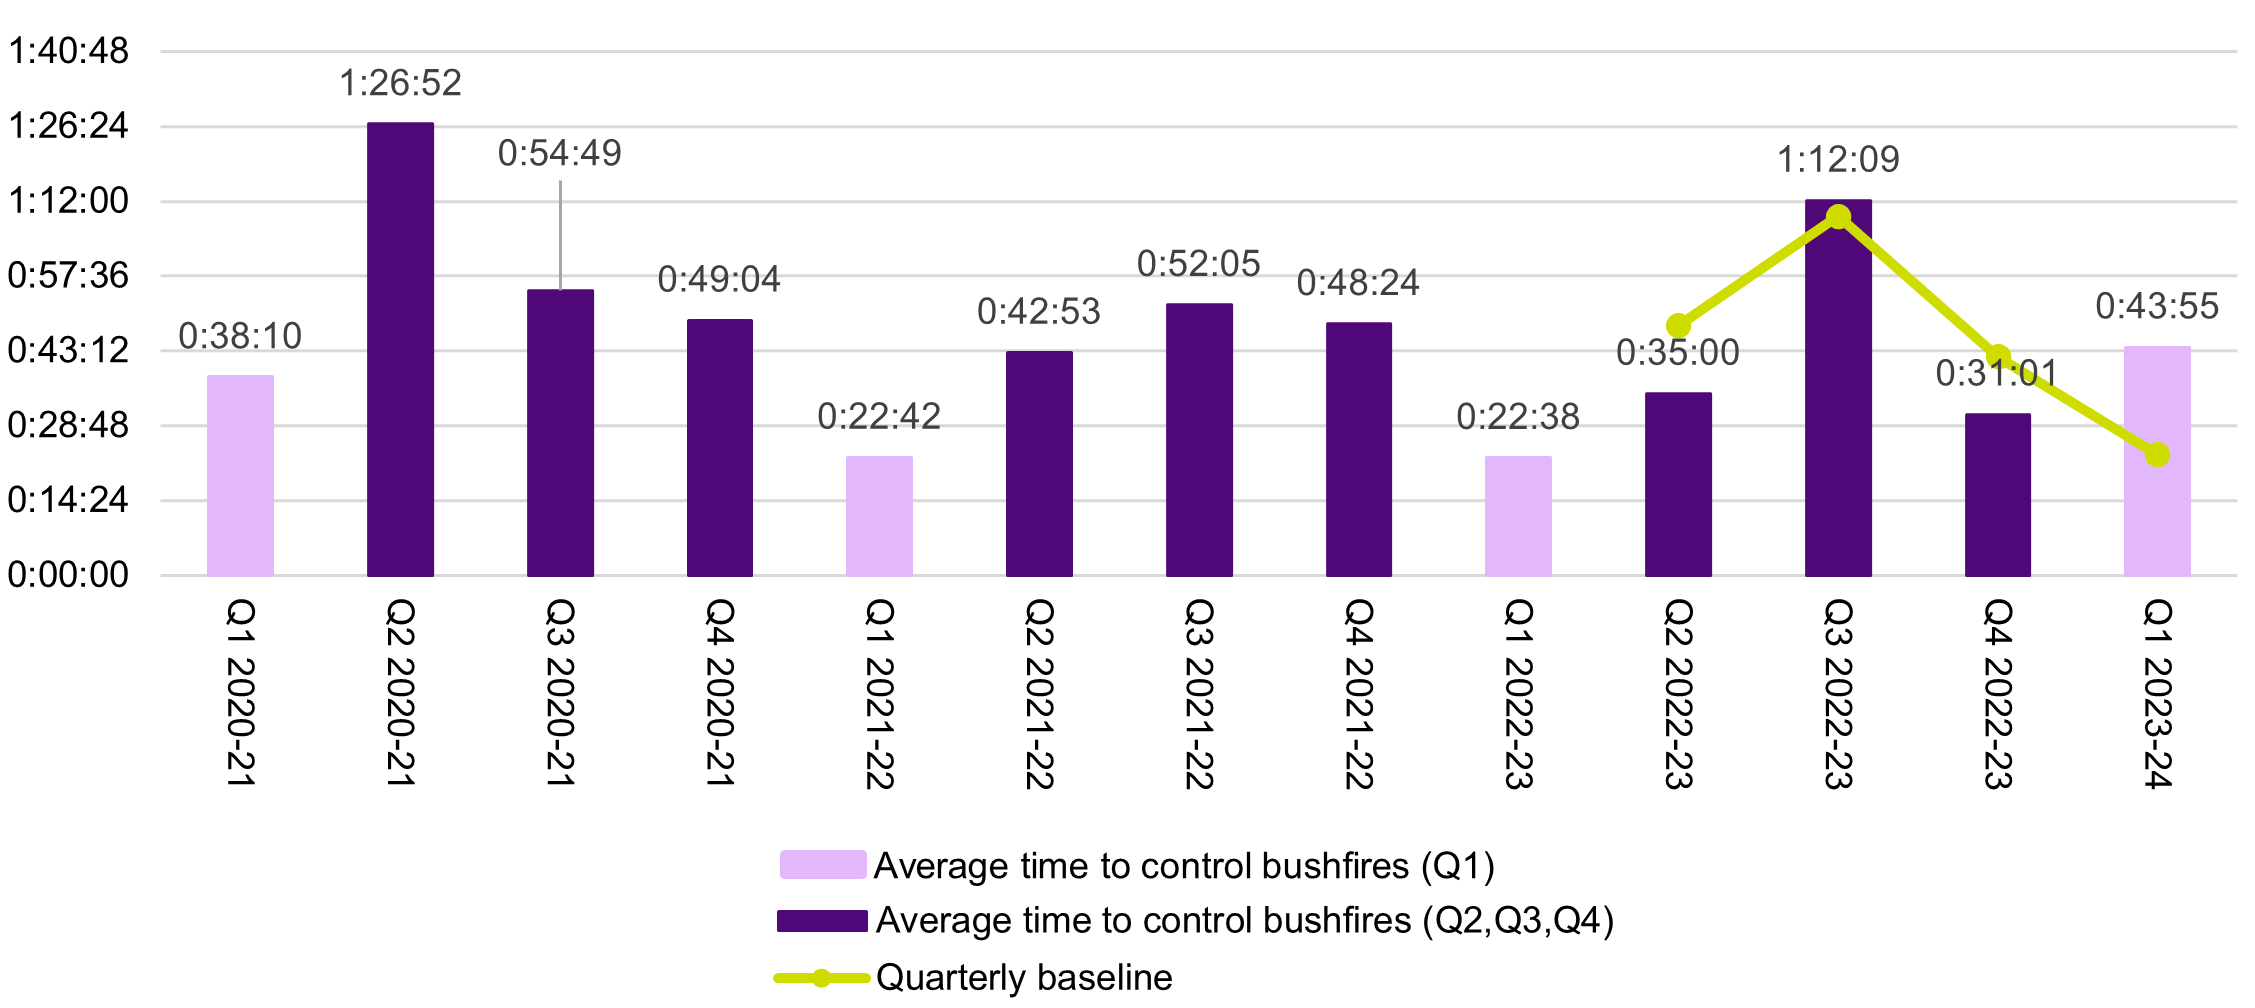
2.4.1 CFA time to control bushfires
CFA recorded a result of 43 minutes and 55 seconds for the average time to control bushfires (indicator 2.2.4). This is a significant increase of 12 minutes and 54 seconds from Q4 2022-23. This result also exceeds all Q1 year-on-year results since Q1 2020-21, as outlined in Figure 7 below.
CFA advise that a wet or dry season, along with early or late seasonal onset, can influence the result for this metric (both overall baseline and quarterly baseline). CFA report that Q1 this year has seen a move into an early fire season with dry conditions, which is different to Q1 in 2021 and 2022. CFA advised that this may account for a level of quarterly variation.
Figure 7: 2.2.4 Decrease in average time to control bushfires

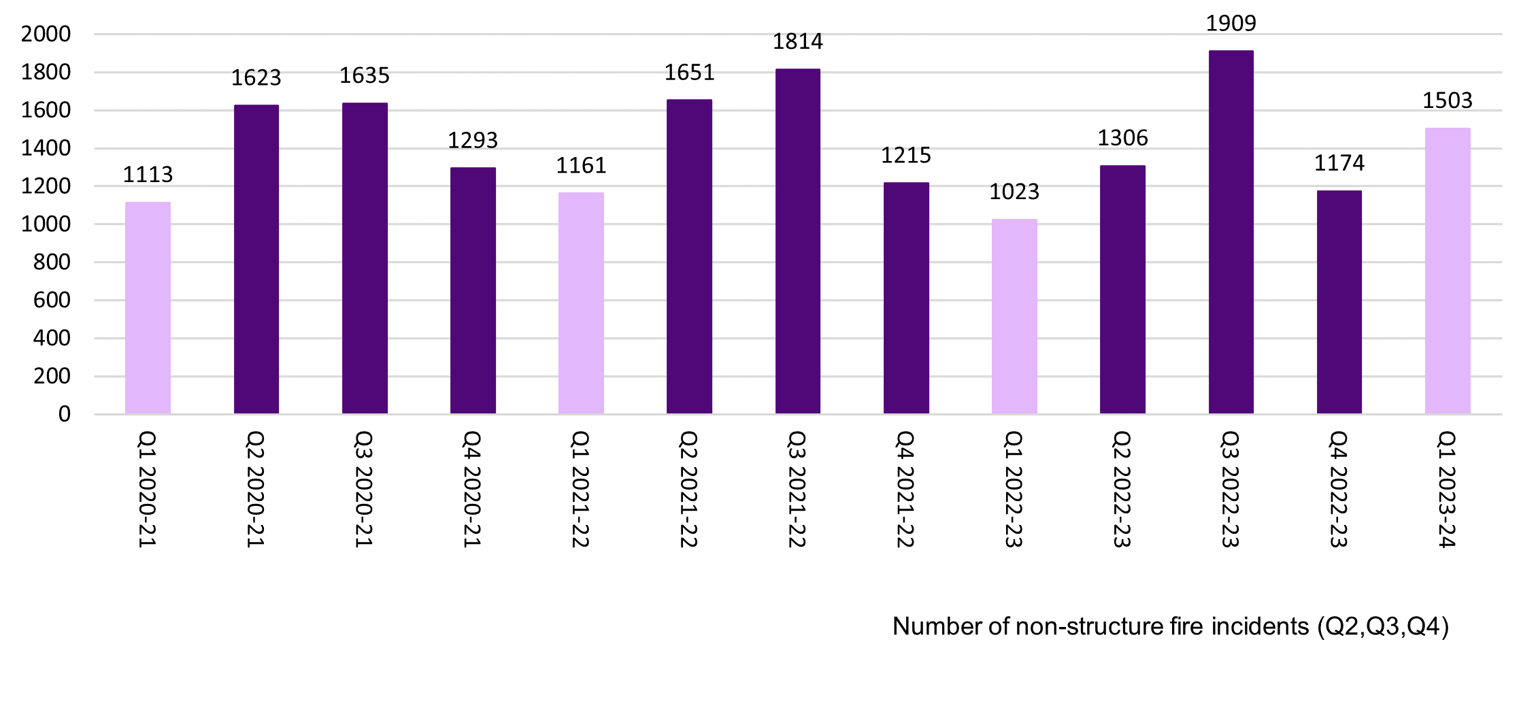
2.4.2 FRV number of preventable non-structure fire incidents
FRV responded to 1,503 incidents (categorised as preventable non-structure fire incidents) in FRV districts in Q1 2023-24 (1.3.3a). This is an increase of 329 (21.89 per cent) when compared to Q4 2022-23.
FSIM notes that FRV’s Q1 2023-24 result was an increase on comparable Q1 year-on-year results, outlined in Figure 8 below, noting that comparing year-on-year results removes seasonal variability as a factor to some extent. Without access to the AIRS data after the December 2022 cyber-attack, FRV report that it is not possible to perform a more detailed investigation of data that could help determine causation.
FRV advised that the degree of quarter-to-quarter variation was not statistically significant and historically there is a high rate of variation across quarters (e.g. 1909 incidents recorded in Q3 2022-23 compared to 1174 incidents recorded in Q4 2022-23). FRV also advised that there are various factors, including seasonal variability, that contribute to statistical variance from quarter to quarter, and that it is challenging to directly attribute the impact of FRV community safety activities. [1]
Figure 8: 1.3.3 Number of incidents other than structure fires and other non-fire related incidents, category – non-structure fires
Note re figure 8: Prior to the December 2022 cyber-attack, FRV reported this measure by sourcing data from AIRS. FRV has used data obtained from the ESTA CAD system to report its Q1 2023-24 result. Figure 2 includes results reported using AIRS data (Q1 2020-21 to Q1 2022-23) and ESTA CAD data for results reported between Q2 2022-23 to Q1 2023-24.
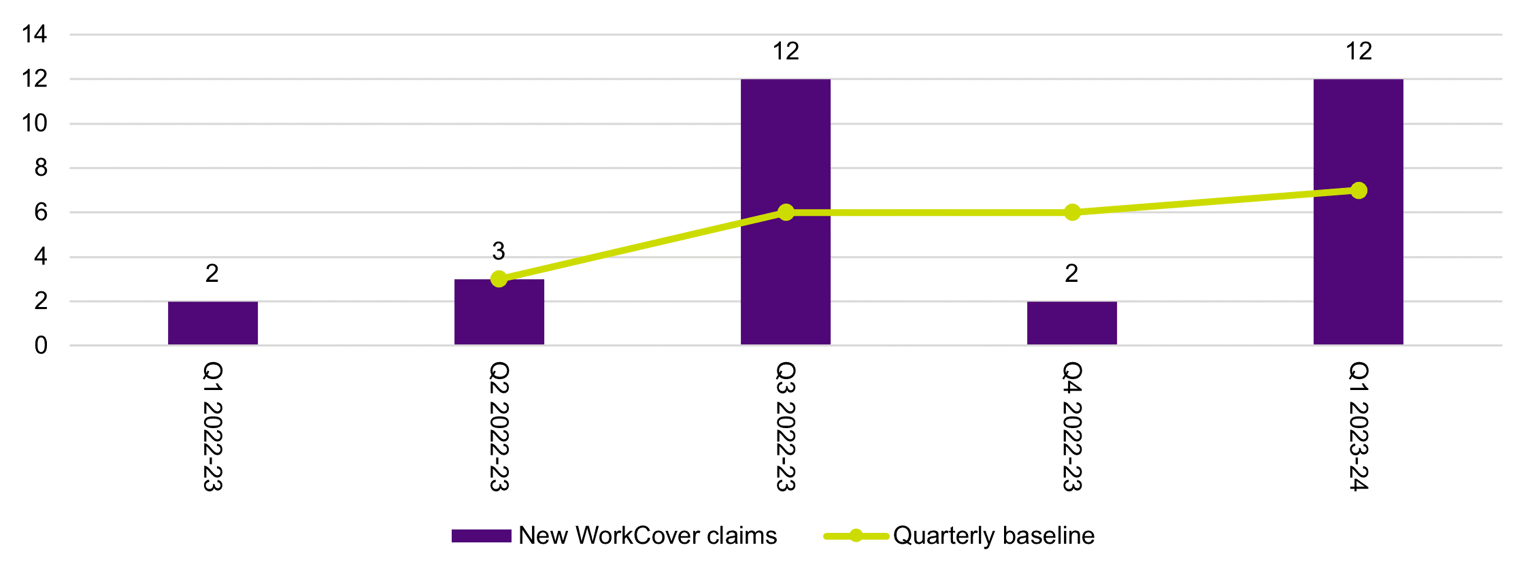
2.4.3 CFA new WorkCover claims
CFA reported 12 new WorkCover claims this quarter (indicator 3.1.4). This is a significant (83 per cent) increase from the Q4 2022-23 result of two claims and the year-on-year Q1 2022-23 result of two claims (see Figure 9). CFA report that new employee claims continue to increase, with mental health claims accounting for 50 per cent of all new employee claims. CFA advised FSIM that further investigation is required to determine if there are any systemic factors leading to these increases.
CFA report that it offers mental health and wellbeing services to support volunteers and staff, such as, but not limited to, digital training modules, peer support programs, CFA wellbeing support line and crisis support.
Figure 9: 3.1.4 Decrease in new WorkCover claims
Note re figure 9: Quarterly year-on-year baseline were introduced from Q2 2022-23. As reported in the Fire Services Outcomes Report Q2 2022-23, CFA has not calculated baselines retrospectively for results recorded prior to Q2 2022-23.
Footnotes
[1] FRV advised that it undertakes non-structure fire prevention activities, bush/grass fire, dangerous goods and to a lesser extent road safety.
3. Reader guide
Definitions
| Acronym | Title |
|---|---|
| AIRS | Australian Incident Reporting System |
| CAD | Computer Aided Dispatch |
| CAoV | Country Area of Victoria |
| CFA | Country Fire Authority |
| EMR | Emergency Medical Response |
| ESTA | Emergency Services Telecommunications Authority |
| FRV | Fire Rescue Victoria |
| FRV Act | Fire Rescue Victoria Act 1958 |
| FSIM | Fire Services Implementation Monitor |
| FTE | Full Time Equivalent |
Reference to fire services agencies
References to the fire services in this document relate specifically to CFA and FRV. Where more than one fire services agency is referenced in this document, they are listed in alphabetical order.
Comparison between agencies’ performance against published Outcomes Frameworks
As the two outcomes frameworks are based on the agencies’ own strategic and operational priorities and data, comparisons between the agencies should not be made.
4. Appendix A: Country Fire Authority Q1 Progress Update
CFA outcomes framework
CFA has reported on its Year Three Outcomes Framework in Q1 2023-24. Appendix A provides a CFA Outcomes Framework Performance Report Q1 2023-24. The CFA report includes quarterly year-on-year baselines, which is the average of five years of data (unless otherwise specified) and an annual baseline, which is a five-year average (unless otherwise specified).
5. Appendix B: Fire Rescue Victoria Q1 Progress Update
FRV outcomes framework
FRV’s outcomes framework includes ten outcome statements and 25 indicators in total. In Q1 2023-24 FRV reported on a total of 18 quarterly measures (against 12 indicators) (see Appendix B). Quarterly data impacted by the cyber-attack in December 2022 has not been included in the progress report for six indicators and ten measures. Annual data is not included in this report and as a result not all indicators and measures are numbered sequentially.