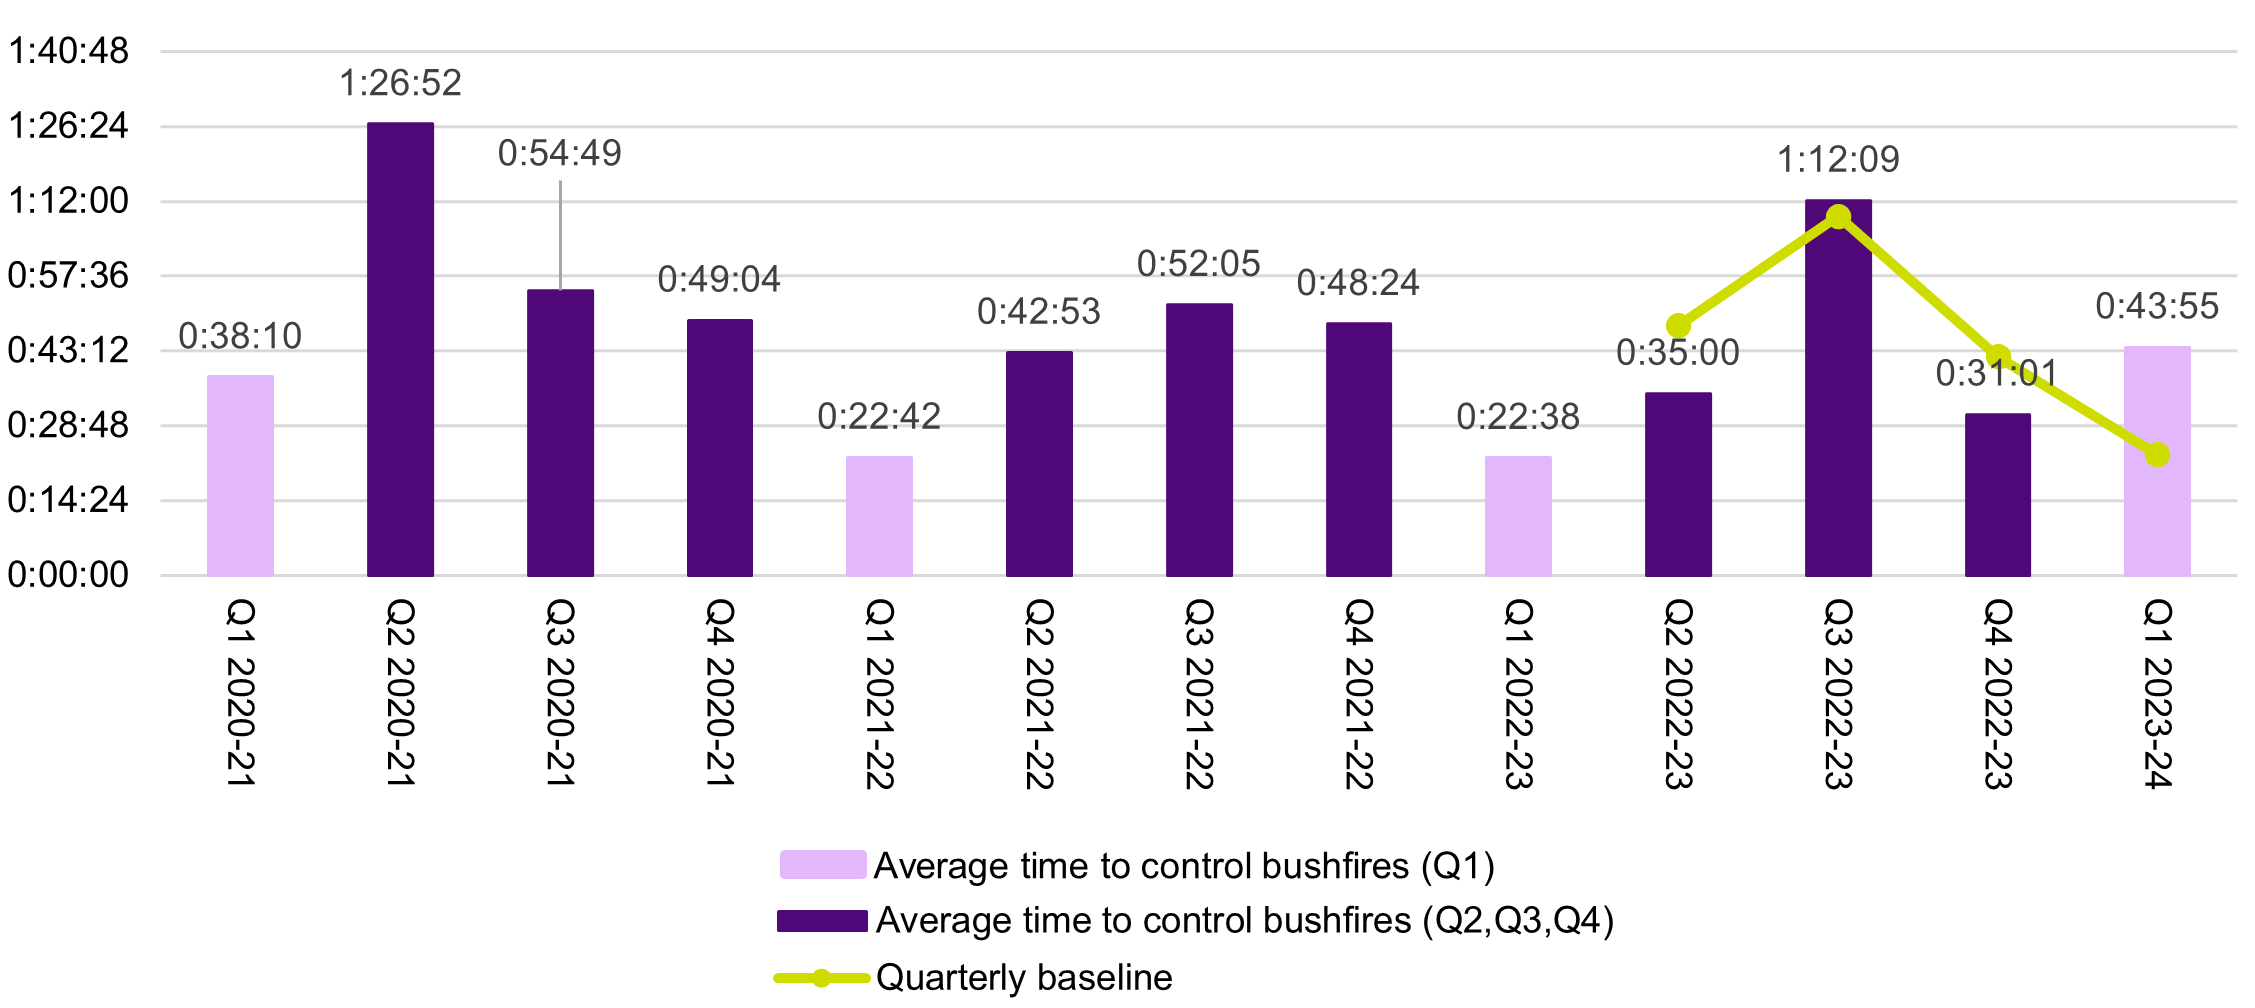
2.4.1 CFA time to control bushfires
CFA recorded a result of 43 minutes and 55 seconds for the average time to control bushfires (indicator 2.2.4). This is a significant increase of 12 minutes and 54 seconds from Q4 2022-23. This result also exceeds all Q1 year-on-year results since Q1 2020-21, as outlined in Figure 7 below.
CFA advise that a wet or dry season, along with early or late seasonal onset, can influence the result for this metric (both overall baseline and quarterly baseline). CFA report that Q1 this year has seen a move into an early fire season with dry conditions, which is different to Q1 in 2021 and 2022. CFA advised that this may account for a level of quarterly variation.
Figure 7: 2.2.4 Decrease in average time to control bushfires

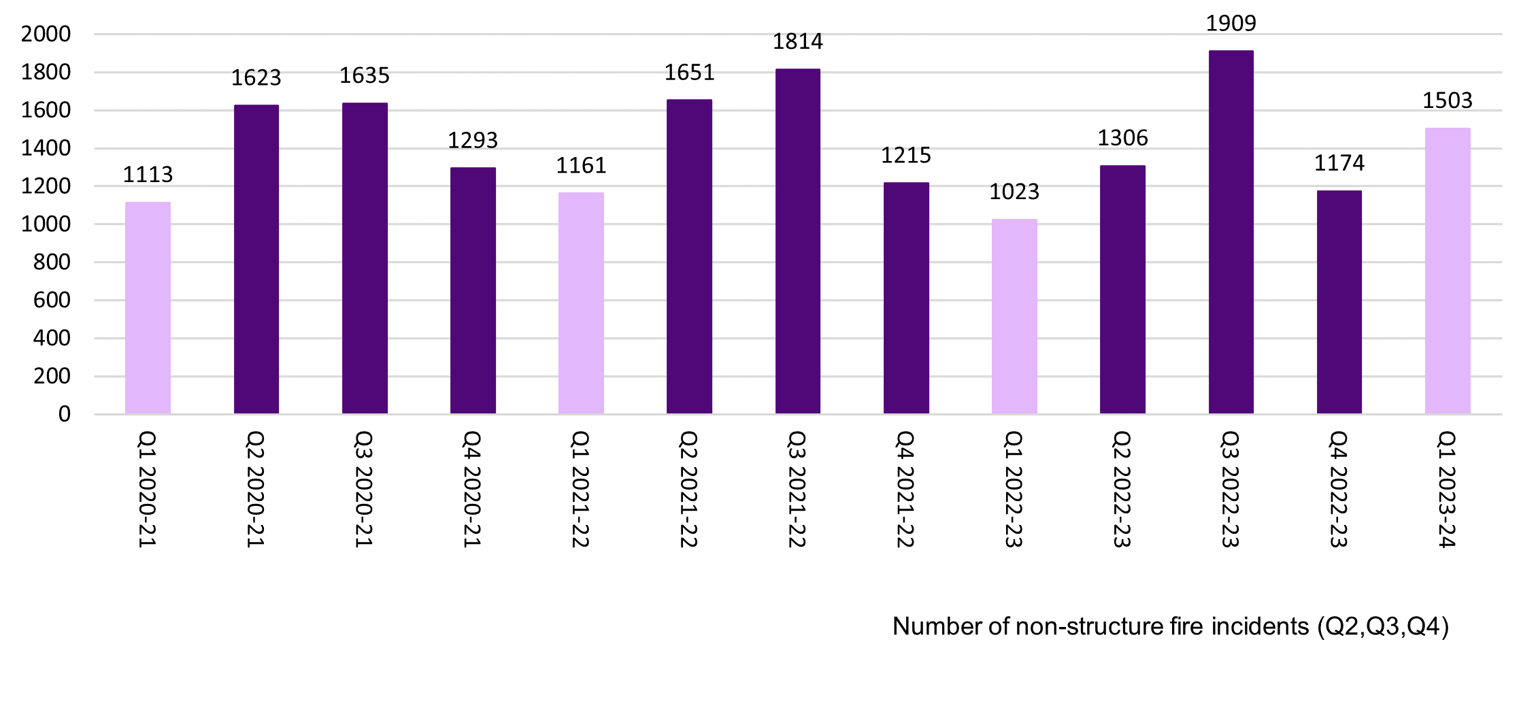
2.4.2 FRV number of preventable non-structure fire incidents
FRV responded to 1,503 incidents (categorised as preventable non-structure fire incidents) in FRV districts in Q1 2023-24 (1.3.3a). This is an increase of 329 (21.89 per cent) when compared to Q4 2022-23.
FSIM notes that FRV’s Q1 2023-24 result was an increase on comparable Q1 year-on-year results, outlined in Figure 8 below, noting that comparing year-on-year results removes seasonal variability as a factor to some extent. Without access to the AIRS data after the December 2022 cyber-attack, FRV report that it is not possible to perform a more detailed investigation of data that could help determine causation.
FRV advised that the degree of quarter-to-quarter variation was not statistically significant and historically there is a high rate of variation across quarters (e.g. 1909 incidents recorded in Q3 2022-23 compared to 1174 incidents recorded in Q4 2022-23). FRV also advised that there are various factors, including seasonal variability, that contribute to statistical variance from quarter to quarter, and that it is challenging to directly attribute the impact of FRV community safety activities. [1]
Figure 8: 1.3.3 Number of incidents other than structure fires and other non-fire related incidents, category – non-structure fires
Note re figure 8: Prior to the December 2022 cyber-attack, FRV reported this measure by sourcing data from AIRS. FRV has used data obtained from the ESTA CAD system to report its Q1 2023-24 result. Figure 2 includes results reported using AIRS data (Q1 2020-21 to Q1 2022-23) and ESTA CAD data for results reported between Q2 2022-23 to Q1 2023-24.
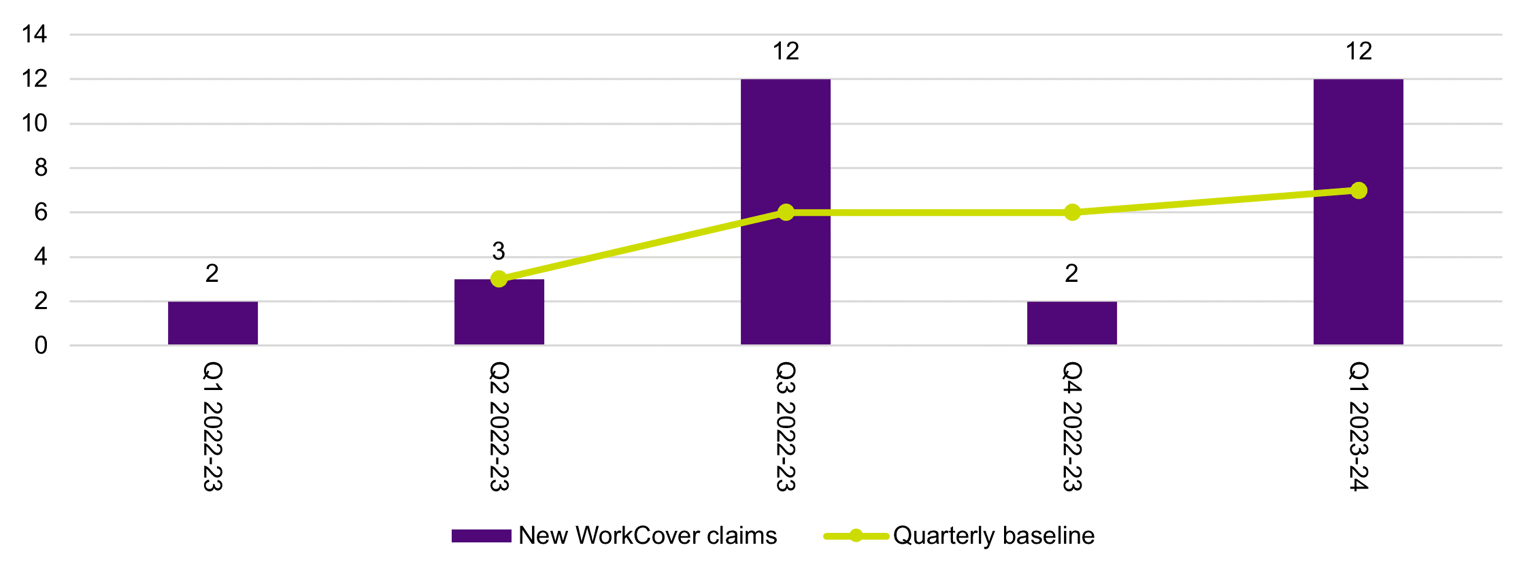
2.4.3 CFA new WorkCover claims
CFA reported 12 new WorkCover claims this quarter (indicator 3.1.4). This is a significant (83 per cent) increase from the Q4 2022-23 result of two claims and the year-on-year Q1 2022-23 result of two claims (see Figure 9). CFA report that new employee claims continue to increase, with mental health claims accounting for 50 per cent of all new employee claims. CFA advised FSIM that further investigation is required to determine if there are any systemic factors leading to these increases.
CFA report that it offers mental health and wellbeing services to support volunteers and staff, such as, but not limited to, digital training modules, peer support programs, CFA wellbeing support line and crisis support.
Figure 9: 3.1.4 Decrease in new WorkCover claims
Note re figure 9: Quarterly year-on-year baseline were introduced from Q2 2022-23. As reported in the Fire Services Outcomes Report Q2 2022-23, CFA has not calculated baselines retrospectively for results recorded prior to Q2 2022-23.
Footnotes
[1] FRV advised that it undertakes non-structure fire prevention activities, bush/grass fire, dangerous goods and to a lesser extent road safety.
Updated