2.3.1 CFA structure fire suppression
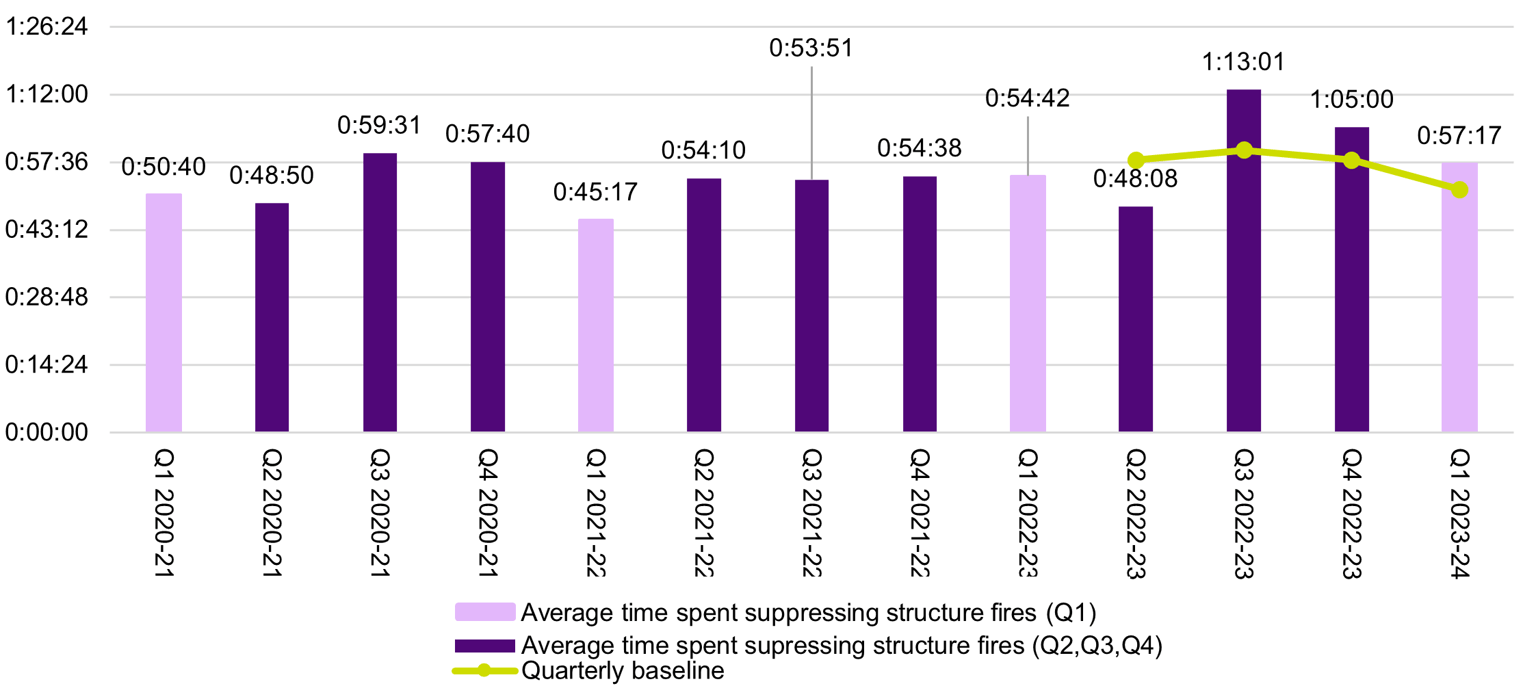
CFA did not meet the 51 minutes and 48 seconds baseline for indicator 2.2.3 (average time spent to suppress structure fires) this quarter, although FSIM notes an improvement from 65 minutes in Q4 2022-23 to 57 minutes and 17 seconds in Q1 2023-24.
CFA advised that even though there is a 5 per cent variance from the baseline, CFA consider the result acceptable, as various factors (many outside of CFA’s control) impact this outcome. These factors include fire progression at time of arrival, building type, timeliness of support services (such as utilities) and the presence of hazardous materials. CFA reports that it has undertaken actions to raise awareness of structure fire suppression expectations amongst District Assistant Chief Officers and brigades to ensure timely ‘under control’ radio messages.
FSIM notes that in Q1 2023-24, CFA recorded the highest average time spent to supress structure fires year-on-year since Q1 2020-21, outlined in Figure 5 below.
Figure 5: 2.2.3 Decrease in the average time spent suppressing structure fires (time spent on scene of incident)
Note re figure 5: Quarterly year-on-year baseline were introduced from Q2 2022-23. As reported in the Fire Services Outcomes Report Q2 2022-23, CFA has not calculated baselines retrospectively for results recorded prior to Q2 2022-23.
FSIM notes that although the Q1 2023-24 result did not meet the quarterly baseline, CFA has demonstrated improvements in Q1 2023-24 in other indicators related to structure fire operational performance:
- indicator 2.2.1: increase in the percentage of structure fires contained to room of origin, recorded a 5.6 per cent increase on the quarterly baseline.
- indicator 2.3.5: decrease in complete structures loss due to structure fire, recorded a 3.7 per cent decrease on the quarterly baseline.
2.3.2 FRV support and maintain firefighters’ physical and psychological health
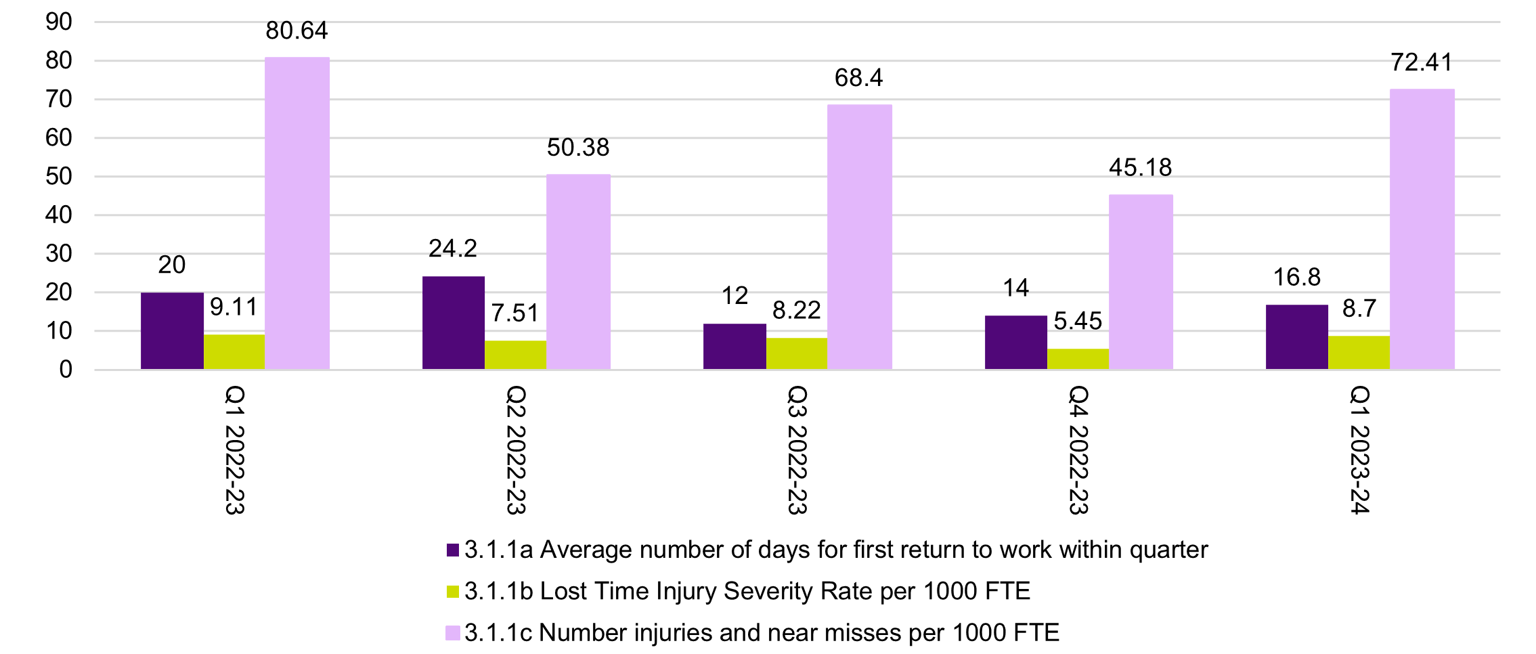
FRV has reported reduced performance in all measures under indicator ‘3.1.1: Increase in support and maintenance of firefighters’ physical and psychological health’ since Q4 2022-23 (see Figure 6 below).
FRV’s measure ‘3.1.1b: Lost time injury severity rate per 1000 FTE’ calculates the number of injuries reported into FRV’s claims database categorised as Lost Time Injuries (one or more working days/shifts lost due to injury). The result was 8.7 lost working days/shifts due to injury per 1000 FTE compared to 5.45 lost working days/shifts due to injury per 1000 FTE in Q4 2022-23. When FSIM applies a simple moving average to the measure for quarterly results since Q1 2022-23, FRV’s Q1 2023-24 result is 11.57 per cent higher than the average of 7.8.
FRV’s measure ‘3.1.1c: Number of injuries and near misses per 1000 FTE’ result was 72.41 per 1000 FTE compared to 45.18 per 1000 FTE in Q4 2022-23. When FSIM applies a simple moving average to the measure for quarterly results since Q1 2022-23, FRV’s Q1 2023-24 result is 14.21 per cent higher than the average of 63.4. Results for 3.1.1b and 3.1.1c demonstrate increases of more than 5 per cent from the average calculated from all quarterly results since Q1 2022-23.
Additionally, FSIM notes that FRV continues to record an increase on the average number of days for return to work (3.1.1a) with a Q1 result of 16.8 days. This is an increase from 12 days in Q3 2022-23 and 14 days in Q4 2022-23.
Data note
FRV advise that although the results show a reduction in performance in all measures relating to supporting and maintaining firefighters physical and psychological health, FRV does not consider this to be a meaningful indicator to understand workforce health and safety due to the way the indicator is measured. FRV has reported to FSIM that work is underway to review health, safety and wellbeing metrics as part of the FRV Health Model program implementation and a broader review into FRV’s outcomes framework.
Figure 6: 3.1.1: Increase in support and maintenance of firefighters’ physical and psychological health
Updated