CFA: A decrease in workplace injuries (volunteer operational activity)
This indicator considers the emergency lost time injury frequency rate and the CFA deems a lower result as desirable.
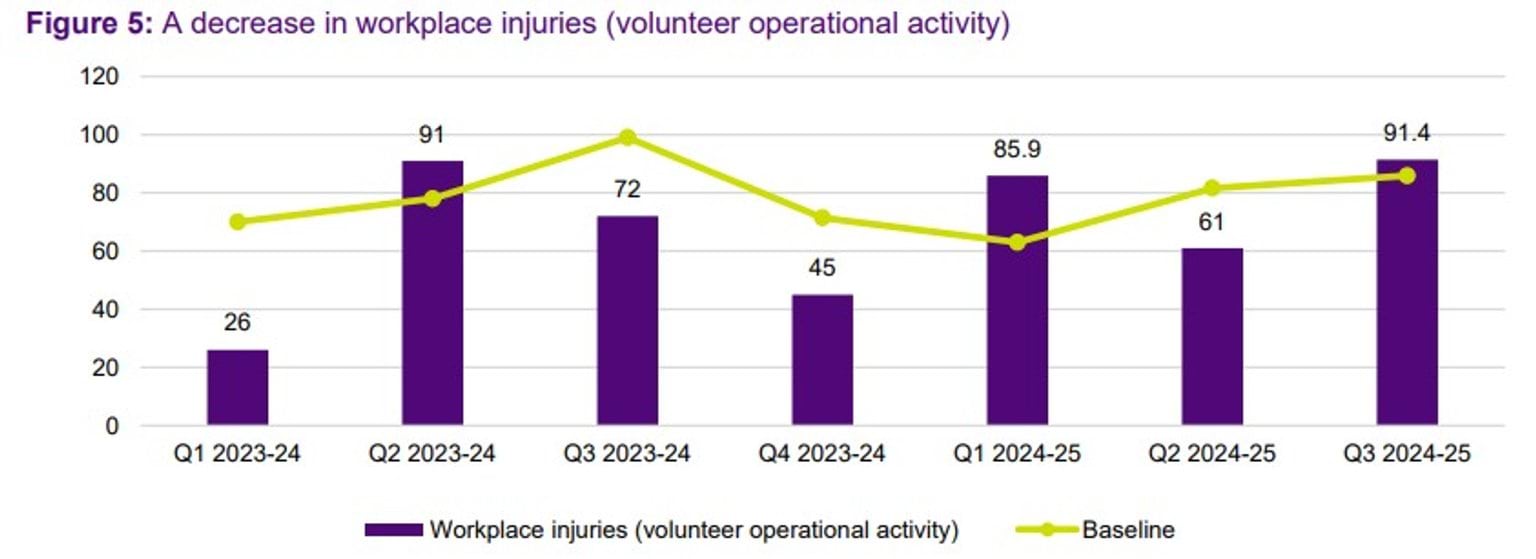
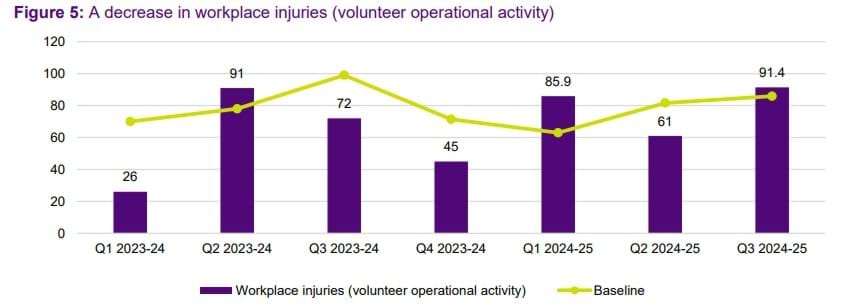
The CFA reported an increase in workplace injuries (volunteer operational activity) this quarter, from 61 in Q2, to 91.4 in Q3. While this is an increase of 49.8% from the Q2 result, it is also 6.4% higher than the CFA’s Q3 baseline of 85.9, reflecting the seasonal nature of this measure.
The CFA advised it experienced an increase in operational activity during this period, with 16 lost time injuries reported this quarter (Figure 5).
Figure 5: A decrease in workplace injuries (volunteer operational activity)
CFA: Increase delivery of operational training to CFA volunteers
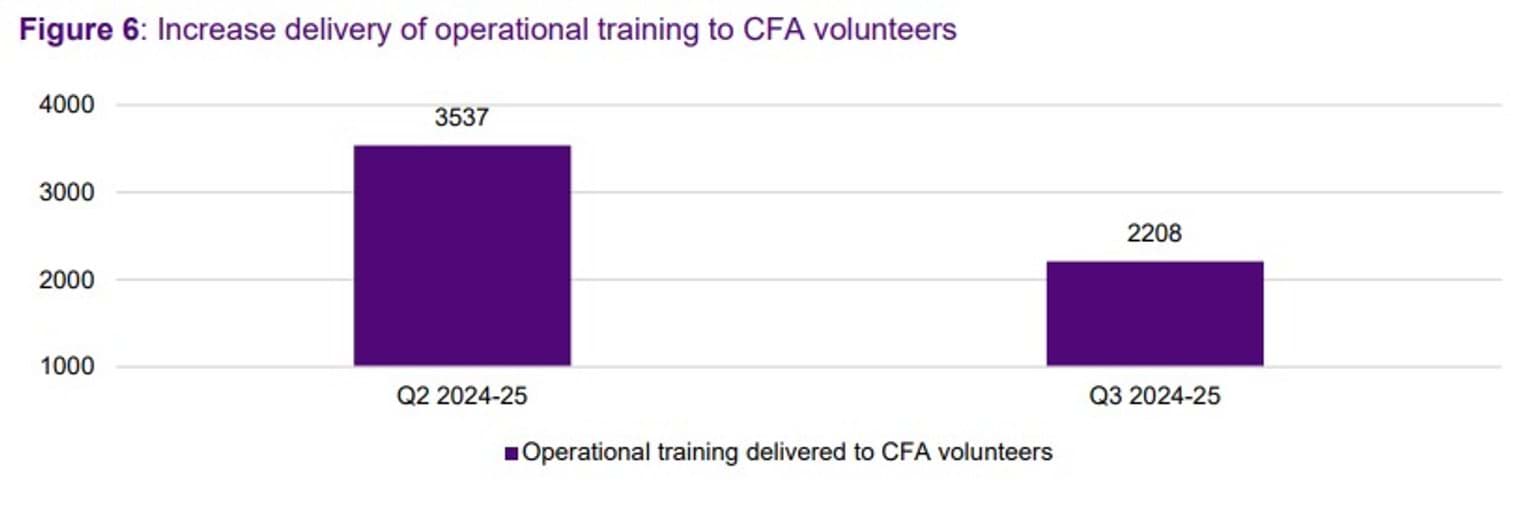
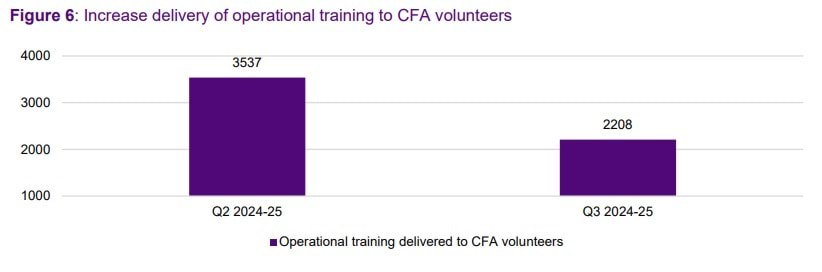
The CFA recorded a decrease in the delivery of operational training to CFA volunteers, from 3,537 in Q2, to 2,208 in Q3. This is a decrease of 37.6% from the Q2 result (Figure 6).
The CFA advises that this result, which is lower than the level of training completed in Q2, is as expected given quarter 3 is the peak operational period within the fire season.
Figure 6: Increase delivery of operational training to CFA volunteers
FRV: Number of people engaged by FES
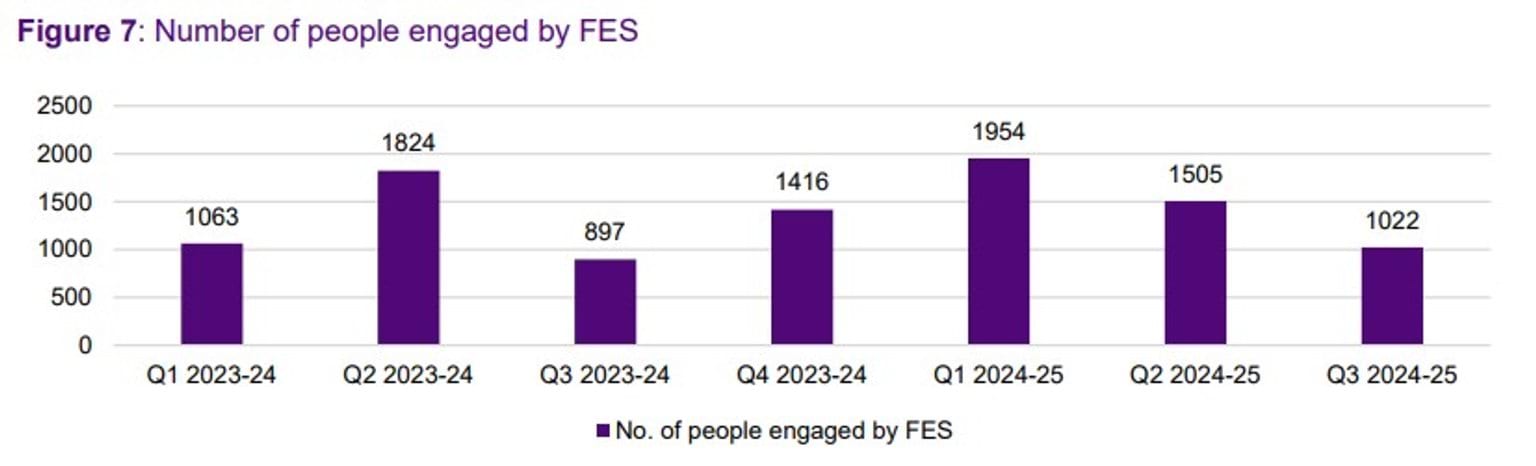
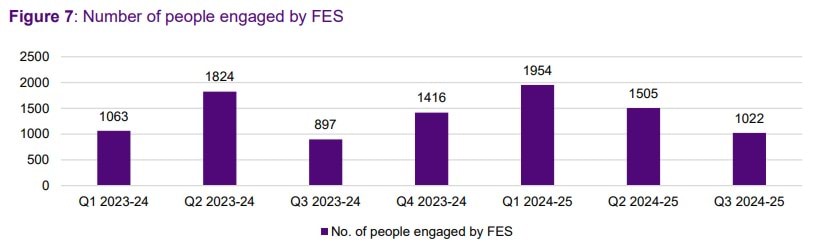
FRV reported a decrease in the number of people engaged by FES from 1,505 in the previous quarter to 1,022 this quarter. This is a decrease of 47.3% (Figure 7).
FRV attributes the decrease to seasonal factors. It also notes that more established work around processes in the 2024-25 financial year have led to a higher overall number of engagements in Q3 compared to the same period in 2023-24. FRV advises that the cumulative number of engagements in 2024-25 also exceeds that of the previous financial year, 2023-24.
Figure 7: Number of people engaged by FES
FRV: Total operational fleet availability
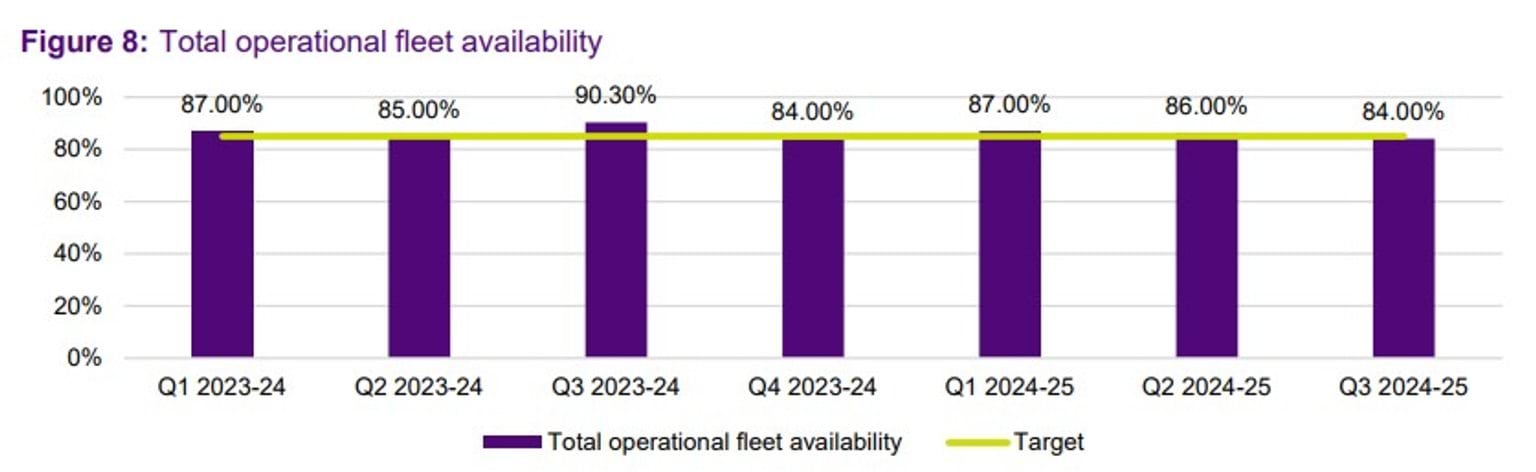
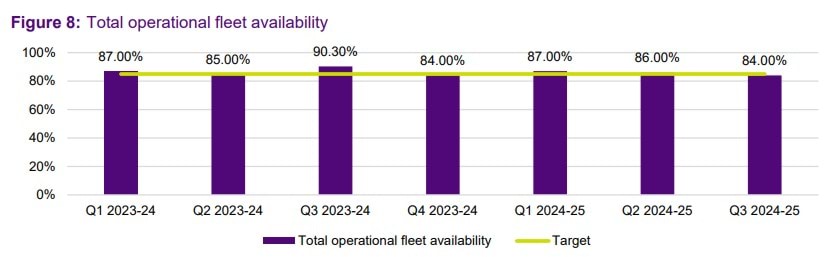
FRV did not meet its target for total operational fleet availability this quarter, reporting a result of 84%. This is 1% below the target of 85% and slightly lower than the results from the previous 2 quarters (Figure 8).
FRV attributes the decrease in total operational fleet availability this quarter to various seasonal factors.
Figure 8: Total operational fleet availability
Data note
FRV reports that 2024-25 data is not comparable to 2023-24 data as 2024-25 data includes both metro and regional areas, and 2023-24 data only reflects metro appliances due to CFA protected industrial action.
Updated