- Published by:
- Family Safety Victoria
- Date:
- 3 May 2023
To receive this document in another format, phone 03 9085 0900, using the National Relay Service 13 36 77 if required, or email reception@familysafety.vic.gov.au
Aboriginal acknowledgement
The Victorian Government proudly acknowledges Victorian Aboriginal people as the First Peoples and Traditional Owners and custodians of the land and water on which we rely.
We acknowledge and respect that Aboriginal communities are steeped in traditions and customs built on an incredibly disciplined social and cultural order.
This social and cultural order has sustained up to 50,000 years of existence. We acknowledge the ongoing leadership role of the Aboriginal community in addressing and preventing family violence and join with our First Peoples to eliminate family violence from all communities.
Executive summary
The Family Violence and Sexual Assault Workforce Pulse Survey (WP Survey) was conducted by Family Safety Victoria between September and October 2022.[1]
The WP Survey explored the employment conditions, workplace barriers and career intentions of specialists employed by family violence and sexual assault organisations, Aboriginal Community Controlled Organisations (ACCO) and The Orange Door network (TOD) in Victoria.[2]
The final sample is composed of 1,049 (completed and partial) responses, representing an estimated 35% of the total family violence and sexual assault specialist workforce.
Given that the survey method involved non-probability sampling, it is important to highlight findings represent valid characteristics of the sample but may not be representative of the wider target population.[3]
A summary of findings is provided below.
Employment conditions
- 84% of those who responded (875 persons) were employed on a secure (or ongoing) basis and 16% were employed on an insecure basis, with 14% employed on a fixed-term basis (144 persons) and 2% employed on a casual or sessional basis (19 persons).[4]
- 57% of those who responded (590 persons) were employed full time, 41% (429 persons) were employed part time and 2% were employed on a casual or sessional basis (19 persons).
- The median total annual (individual) salary was $81,000-90,000, with the majority of respondents (61%) earning a total annual (individual) salary (before tax) above $81,000.[5]
- The greatest proportion of those who responded, 28% (266 persons) worked between 35 and 38 hours per week.
- On the basis of the median measure, participants across the survey stated they worked 32 hours, but would prefer to work 25 hours per week. For those employed on a full time basis, participants stated they worked 38 hours, but would prefer to work 37.5 hours.
- The most common work responsibility was case worker and/or case management with 20% of those who responded (161 persons) describing this as their primary responsibility.[6]
- 96% (1,012 persons) of those who identified a primary responsibility also identified at least one secondary responsibility.
Workplace barriers
- The 2 most common significant barriers at work were ‘staff issues (short staffed)’ and ‘too many competing priorities’. This was followed by ‘corporate process’, ‘case loads’ and ‘administrative processes’.[7]
- 81% of those who responded (854 persons) said their employer currently had staff vacancies.
- Amongst those who identified vacancies at work, 50% (430 persons) stated staff vacancies had a ‘high’ or ‘very high’ impact on their team’s ability to meet service delivery targets, with an additional 33% stated a moderate impact (282 persons).
Career Intentions
- 31% of those who responded had less than one year's experience working in their current role and more than 60% (663 persons) were only employed in their current role for 2 years or less. In comparison, 31% (322 persons) had been employed in their current sector for 2 years or less.
- 48% (502 persons) stated they had worked in a related sector before commencing in their current role, meaning almost one in two had worked for an organisation in a related sector prior to their current role.
- 22% of those who responded (235 persons) plan to leave their current role in the next 12 months, but only 8% plan to leave both their role and the sector during this period.
- The top 3 reasons given for planning to leave a current role were ‘career prospects’ (110 mentions), ‘excessive levels of demand’ (103 mentions) and ‘insufficient income / salary’ (82 mentions).
About the participants - demographic profile
Gender and sexual identity
- 87% of those who responded (913 persons) identified as female, with 9% (91 persons) identifying as male, and 2% (24 persons) self-describing their gender identity.
- 40-44 years was the median age, with the largest age group in the sample being 30-34 years with 16% (170 persons).
- 68% identified their sexual orientation as heterosexual / other gender attracted (715 persons), with 20% (209 persons) identifying as multi-gender attracted, same sex / gender attracted or asexual and the remainder stating ‘prefer not to say’ or ‘none of the above’.
Cultural and ethnic background
- 5% identified as Aboriginal and Torres Strait Islander (48 persons).
- 21% identified as first-generation migrants, meaning they were born overseas (215 persons).
- 67% identified ‘Australian’ as one of their 2 ancestries (698 persons).[8]
- 91% listed English as one of the main languages spoken at home (956 persons).
Disability status
- 10% stated they had a long-term health condition or disability that affected their participation in work (104 persons).
Qualifications
- 81% of those who responded described a Bachelor’s qualification or above as their highest level of educational attainment (848 persons).
- 38% described social work as their main field of study in their highest qualification (395 persons).
Notes
[1] Family Safety Victoria website and Centre for Workforce Excellence website, State Government of Victoria, accessed 19 December 2022. The survey was sponsored by the Centre for Workforce Excellence.
[2] The Orange Door network, What is The Orange Door webpage, State Government of Victoria, accessed 19 December 2022.
[3] In a non-probability sampling approach, each person selects themselves (or opts in) for inclusion in a survey. This means that unlike probability sampling, the chance of anyone from a target population being included is not equal. This approach is often adopted when it is impossible or impracticable to draw a random sample, as is the situation in this case given the contact details of all (or many) family violence and sexual assault workers are not available to government because most workers are employed by community services organisations.
[4] Insecure employment commonly refers to types of employment that are based on casual, fixed term and other kinds of insecure arrangements. Secure employment includes both full-time and part-time ongoing employment in this survey, noting that the principle was introduced as an objective to the Fair Work Act 2009 by the Fair Work Legislation Amendment (Secure Jobs Better Pay) Act 2022.
[5] The median is the middle number in an ordered list of values. In comparison, the average involves the sum of values divided by the total number of amounts. Median is used in this instance because it is less likely to be skewed by low or high outliers.
[6] In the survey, participants were asked, “Which of the following categories best describes your primary responsibility?” Many who responded to this question also nominated their primary work responsibility as their job title.
[7] In the survey participants were asked, “Which of the following are currently the most significant barriers that prevent you performing optimally at work?”
[8] The concept of ‘ancestry’ seeks to more inclusively describe the cultural identity of people from diverse migrant and ethnic backgrounds, for instance, by including second and third generation migrants or migrants who are ethnic minorities in their nation of origin. Prior to the notion of ancestry, birth nation or language spoken at home were common methods of identifying cultural and linguistically diverse backgrounds. Similar to the ABS Census, the WP Survey did not assume cultural identifications are singular, and provided an opportunity for participants to nominate up to 2 primary ancestries.
About the response
The WP Survey targeted specialists working for the following types of employers:
- Specialist family violence (victim survivor) services (SFVS) organisations
- Sexual assault support services (SASS) organisations
- Family violence perpetrator intervention (FVPI) organisations[9]
- Aboriginal Community Controlled Organisations (ACCO)
- The Orange Door Network (TODN), including child wellbeing specialists.[10]
The final survey sample was 1,049 responses, representing a response rate of approximately 35% of the target population.
Response by organisation type
The largest number and proportion of those who responded to the survey were from SFVS organisations, with 41% (426 persons) stating they worked for a SFVS organisation providing victim survivor services (Table 1).
In comparison, 28% of those who responded (289 persons) were employed by TOD Network, 15% (162 persons) were employed by a SASS organisation, 10% (110 persons) were employed by a FVPI provider and 6% (62 persons) were employed by an ACCO.
Table 1: Where do you work?
| Count | Percentage | |
| TODN | 289 | 28% |
| SFVS | 426 | 41% |
| SASS | 162 | 15% |
| FVPI | 110 | 10% |
| ACCO | 62 | 6% |
| Grand total | 1,049 |
Source. Question 1, WP Survey 2022
The survey’s eligibility rules included child wellbeing specialists working in TOD network. From those working in TOD network:
- 18 respondents identified their role as dedicated to supporting families needing support with the care and wellbeing of children and young people,
- 88 respondents identified their role as dedicated to working with victim survivors and/or people using family violence, and
- 183 respondents stated they supported both (Table 2).
Table 2: What client groups do you primarily provide services to directly or indirectly (as part of TOD network workforce)?
| Count | Percentage | |
| Victim survivors and/or people using family violence | 88 | 30% |
| Families needing support with the care and wellbeing of children and young people | 18 | 6% |
| Both of the above | 183 | 63% |
| Grand total | 289 | |
| Missing/skipped question | 0 |
Source. Question 1A, WP Survey 2022
Response by geographic location
61% of those who responded (638 persons) stated they work in metropolitan Melbourne, with the remainder (400 persons) working in regional Victoria (Table 3).
Focusing on those who responded from regional Victoria:
- 10% (104 persons) worked in the Loddon Mallee region,
- 9% (95 persons) worked in the Gippsland region,
- 7% (73 persons) worked in the Hume region,
- 7% (71 persons) worked in the Barwon South-West Region and
- 5% (57 persons) worked in the Grampians region.[11]
Table 3: In your main role, what region and Local Government Area do you work in?
| Count | Percentage | |
| Metropolitan Melbourne | 638 | 61% |
| Loddon Mallee region | 104 | 10% |
| Gippsland region | 95 | 9% |
| Hume region | 73 | 7% |
| Barwon South-West region | 71 | 7% |
| Grampians region | 57 | 5% |
| Don’t know/unsure | 7 | <1% |
| Grand total | 1045 | |
| Missing/skipped question | 4 |
Source. Question 3, WP Survey 2022
A much larger proportion of people working in metropolitan Melbourne worked in large organisations (organisations with more than 100 staff). 52% of people who delivered services into metropolitan areas worked for large organisations, compared to 36% of people delivering services into regional Victoria.
Response by type of service provision
Fifty-five percent of those who responded (573 persons) stated their role provides services across multiple locations, with only 29% (300 persons) stating that their role provides services only in the location they work (Table 4). 8% (84 persons) stated their role provides state-wide services, with 3% (35 persons) stating their role provides Melbourne-wide services, 3% (27 persons) stating their role provides regional Victoria wide services and 2% (22 persons) stating their role provides national services.
Table 4: In your main role, which location/s do you provide services to?
| Count | Percentage | |
| My role provides services across multiple locations | 573 | 55% |
| My role provides services in the location I work in (i.e. the location of the office where I work) | 300 | 29% |
| My role provides state-wide services | 84 | 8% |
| My role provides metropolitan Melbourne-wide services | 35 | 3% |
| My role provides regional Victoria-wide services | 27 | 3% |
| My role provides national services | 22 | 2% |
| Don’t know/unsure (Please list postcode(s)) | 6 | <1% |
| Grand total | 1,047 | |
| Missing/skipped question | 2 |
Source. Question 4, WP Survey 2022
People working for organisations delivering services in the regions were more likely to provide services across multiple locations. 59% of people in regional Victoria stated their role provides services across multiple locations compared to 53% in metropolitan Melbourne. People who were securely employed were also more likely to deliver services for organisations across multiple locations. 56% of those employed on an ongoing basis delivered services for organisations across multiple locations, compared to 47% of those employed on an insecure basis.
Response by organisation size
48% of those who responded (501 persons) stated they worked in an organisation where 200 or more individuals were employed, followed by 19% (202 persons) who stated they worked in an organisation with 20-49 individuals, and 13% (133 persons) who stated they worked in an organisation with 100-199 individuals (Table 5).
Table 5: How many individuals are employed in the organisation you work for (for this role)?
| Count | Percentage | |
| 1 to 4 | 13 | 1% |
| 5 to 19 | 96 | 9% |
| 20 to 49 | 202 | 19% |
| 50 to 99 | 96 | 9% |
| 100 to 199 | 133 | 13% |
| 200 or more | 501 | 48% |
| I am self-employed | <5 | <1% |
| Other | <5 | <1% |
| Don’t know/unsure | 6 | <1% |
| Grand total | 1,049 | |
| Missing/skipped question | 0 |
Source. Question 2, WP Survey 2022
Notes
[9] Family violence perpetrator intervention organisation combines workers within specialist family violence services organisations (services for adults using violence) and Men's Behaviour Change Program providers.
[10] For a detailed definition of the specialist target population, please refer to the Appendix.
[11] The distribution across regional and metropolitan Victoria provides some assurance that the survey sample contains a diversity of workforce views on the basis of the geographical location of the delivery of services. See the Appendix for further detail.
Employment conditions
The 2022 WP Survey explored the employment conditions of family violence and sexual assault specialists, including questions about type of employment, hours of work, preference for work hours, annual salary range and responsibilities at work.
Job title
The survey invited respondents to nominate their job title in open text. The responses to this question provided an opportunity to explore the nominated occupation of respondents.
The 5 most common job titles were Counsellor Advocate, Specialist Family Violence Practitioner, Team Leader, Family Violence Case Manager and Child Wellbeing Practitioner (Table 6), noting that the large majority of respondents (77%) reported a job title that was relatively less common or entirely unique amongst survey respondents.
Table 6: What is your job title in your main role? – Top five responses
| Count | Percentage | |
| Counsellor Advocate | 79 | 8% |
| Specialist Family Violence Practitioner | 58 | 6% |
| Team Leader | 49 | 5% |
| Family Violence Case Manager | 32 | 3% |
| Child Wellbeing Practitioner | 22 | 2% |
| Other | 739 | 77% |
| Grand total | 1,033 | |
| Skipped/missing question | 16 |
Source. Question 5, WP Survey 2022 [12]
Primary responsibility
The survey asked about the job responsibilities and kinds of work performed by family violence and sexual assault specialists, including their primary responsibility. From those who responded, the most common primary responsibility was case worker and / or case management which was nominated by 17% (181 persons) (Table 7). In addition, 14% (146 persons) identified their primary job responsibility as TOD practitioner, 12% (122 persons) as team leader / supervisor, 9% (99 persons) as manager, 9% (94 persons) as counsellor advocate and 9% (89 persons) as working in intake and assessment.
Table 7: Which of the following categories best describes your primary responsibility?
| Count | Percentage | |
| Case worker and/or case management | 181 | 17% |
| The Orange Door practititoner | 146 | 14% |
| Team leader/supervisor | 122 | 12% |
| Manager | 99 | 9% |
| Counsellor advocate | 94 | 9% |
| Intake and assessment | 89 | 9% |
| Individual counselling and/or therapeutic support | 74 | 7% |
| Practice leadership and/or capacity building | 65 | 6% |
| Support worker | 44 | 4% |
| Other | 131 | 12% |
| Prefer not to say | <5 | <1% |
| Grand total | 1,047 | |
| Skipped/missing question | 2 |
Source. Question 6, 7 and 8, WP Survey 2022
A higher proportion of people working in regions identified their primary job responsibility as a case worker or an Orange Door practitioner. A total of 43% of workers delivering services to the regions were either a case worker or Orange Door practitioner, compared to 34% of workers delivering services into metropolitan Melbourne.
Larger proportions of young people (under 35) were employed in client-facing roles. 24% of the workforce under 35 identified as case workers, compared to 17% of those 35 and over. 26% of the workforce under 35 identified as an Orange Door practitioner compared to 12% 35 and over.
Secondary responsibilities
Respondents were also invited to nominate a secondary responsibility, including potentially multiple secondary responsibilities. 95% (960 persons) of those who identified a primary responsibility also identified at least one secondary responsibility. The 3 most common secondary responsibilities were intake and assessment (358 mentions), crisis or initial crisis response (265 mentions) and case worker and / or case management (185 mentions) (Table 8).
Table 8: Which of the following categories describes any other responsibilities you might have?
| Count | |
| Intake and assessment | 358 |
| Crisis and initial crisis response | 265 |
| Case worker and/or case management | 185 |
| Individual counselling and/or therapeutic support | 108 |
| The Orange Door practitioner | 102 |
| Practice leadership and/or capacity building | 101 |
| Team leader/supervisor | 96 |
| Support worker | 94 |
| I don't have any other responsibilities | 87 |
| Other | 425 |
| Prefer not to say | 5 |
Source. Question 6A, 7A and 8A, WP Survey 2022
Type of employment
From those who responded to the survey, the vast majority were employed on an ongoing basis with 84% (875 persons) in secure employment (Table 9). Half (517 persons) were employed ongoing and full time and 34% (358 persons) were employed ongoing part time. For those with less secure employment, 14% were employed on a fixed-term basis (144 persons) and only 2% (19 persons) were employed on a casual or sessional basis.
Combining ongoing and fixed term employees, 57% were employed on a full time basis (590 persons) and 41% were employed on a part time basis (429 persons).
Table 9: In relation to your main role, on what basis are you employed?
| Count | Percentage | |
| Ongoing full time | 517 | 50% |
| Ongoing part time | 358 | 34% |
| Fixed-term full time | 73 | 7% |
| Fixed-term part time | 71 | 7% |
| Casual or sessional | 19 | 2% |
| Other (Please specify) | 6 | <1% |
| Grand total | 1,044 | |
| Missing/skipped question | 5 |
Source. Question 9, WP Survey 2022
A greater proportion of people working in the regions were employed on a secure basis. 87% were employed ongoing full time or part time, compared with 82% in metropolitan Melbourne.
Young people (under 35) enjoyed job security at the same level as older workers (35 years and over), with 84% of those under 35 employed ongoing (full time or part time), the same as those 35 and over.
Organisation size also appeared to have little relation to whether respondents were employed on a secure or insecure basis. 81% of those working in other organisations were employed ongoing either full time or part time, the same as those employed in larger organisations.
Hours employed, worked and preferred
46% (474 persons) of those who responded to the survey stated that they were employed full time between 35-38 hours. A further 34% (347 persons) stated they were employed between 20-34 hours and 5% (56 persons) were employed between 1-19 hours (Table 10).
In comparison, 28% (272 persons) stated they worked between 35-38 hours, 21% (198 persons) stated they worked 39-44 hours and 9% (91 persons) stated they worked between 45-59 hours. Almost half (445 persons) stating they would prefer to work part time, between 20-34 hours, with 34% stating they would prefer to work 35-38 hours.
Table 10: In your main role, in an ordinary working week, how many hours: were you employed; did you work; and would you prefer to work (including unpaid)?
| Hours | Employed | Percentage | Worked | Percentage | Preferred | Percentage |
| 0 | <5 | <1% | 17 | 2% | 8 | <1% |
| 1 to 19 | 56 | 5% | 74 | 8% | 49 | 5% |
| 20 to 34 | 361 | 35% | 261 | 27% | 452 | 48% |
| 35 to 38 | 460 | 45% | 268 | 28% | 313 | 33% |
| 39 to 44 | 89 | 9% | 198 | 21% | 69 | 7% |
| 45 to 59 | <5 | <1% | 91 | 9% | 7 | <1% |
| 60+ | 54 | 5% | 50 | 5% | 52 | 5% |
| Other | <5 | <1% | 6 | <1% | <5 | <1% |
| Grand total | 1,031 | 965 | 951 | |||
| Missing/skipped question | 18 | 84 | 98 |
Source. Question 10, WP Survey 2022
For respondents who worked full time (ongoing or fixed-term), nearly half worked 39 hours or more per week (49%), with 29% working 39-44 hours per week and more than 1 in 5 (21%) working more than 45 hours per week (Table 11). In comparison, 74% of respondents indicated they would prefer to work 38 hours or less per week, with almost one quarter (24%) indicating they would prefer to work between 20 and 34 hours.
Table 11: In your main role, in an ordinary working week, how many hours: were you employed; did you work; and would you prefer to work (including unpaid)? (full time only)
| Hours | Employed | Percentage | Worked | Percentage | Preferred | Percentage |
| 0 | <5 | <1% | 10 | 2% | <5 | <1% |
| 1 to 19 | 9 | 2% | 20 | 3% | 10 | 2% |
| 20 to 34 | 14 | 2% | 12 | 2% | 143 | 24% |
| 35 to 38 | 433 | 73% | 206 | 35% | 280 | 47% |
| 39 to 44 | 84 | 14% | 172 | 29% | 60 | 10% |
| 45 to 59 | <5 | <1% | 81 | 14% | <5 | <1% |
| 60+ | 36 | 6% | 38 | 6% | 37 | 6% |
| Other | <5 | <1% | 5 | <1% | <5 | <1% |
| Total | 590 | 590 | 590 | |||
| Missing/skipped question | 11 | 46 | 53 |
Source. Question 10, WP Survey 2022
Salary range
The annual (individual) salary income band with the largest number of responses was $81,000-90,000 with 23% (238 persons), followed by 20% (204 persons) stating $91,000-100,000 and 13% stating $71,000-80,000 (Table 12). The median total annual (individual) salary was $81,000-90,000 with the majority (61%) of respondents having a total annual (individual) salary (before tax) above $81,000.
Table 12: In your main role, what is your total annual (individual) salary (before tax)?
| Count | Percentage | |
| Less than $30k | 17 | 2% |
| $30k to $40k | 25 | 2% |
| $41k to $50k | 44 | 4% |
| $51k to $60k | 60 | 6% |
| $61k to $70k | 86 | 8% |
| $71k to $80k | 139 | 13% |
| $81k to $90k | 238 | 23% |
| $91k to $100k | 204 | 20% |
| $101k to $110k | 116 | 11% |
| $111k to $120k | 31 | 3% |
| $121k to $130k | 19 | 2% |
| $131k to $140k | 12 | 1% |
| $141k to $150k | 8 | <1% |
| More than $150k | <5 | <1% |
| Prefer not to say | 40 | 4% |
| Grand total | 1,042 | |
| Missing/skipped question | 7 |
Source. Question 11, WP Survey 2022
The median income band was $81,000-$90,000. This was irrespective of whether survey respondents delivered services into metropolitan Melbourne or regional Victoria, were young or old, or were employed on a secure or insecure basis.
When focussing only on those working full time (ongoing or fixed term), the largest number of responses was $81,000-90,000 with 28% (163 persons) (Table 13). However, the median total annual (individual) salary (before tax) was higher at $91,000-100,000 for those working full time.
Table 13: In your main role, what is your total annual (individual) salary (before tax)? (full time only)
| Count | Percentage | |
| Less than $30k | <5 | <1% |
| $30k to $40k | <5 | <1% |
| $41k to $50k | <5 | <1% |
| $51k to $60k | 6 | <1% |
| $61k to $70k | 26 | 4% |
| $71k to $80k | 48 | 8% |
| $81k to $90k | 163 | 28% |
| $91k to $100k | 160 | 27% |
| $101k to $110k | 102 | 17% |
| $111k to $120k | 26 | 4% |
| $121k to $130k | 15 | 3% |
| $131k to $140k | 10 | 2% |
| $141k to $150k | 8 | <1% |
| More than $160k | <5 | <1% |
| Prefer not to say | 13 | 2% |
| Total | 587 |
Source. Question 11, WP Survey 2022
Notes
[12] Inside the ‘other’ category, many job titles were reported a small number of times, including 333 unique job titles reported only once each. This suggests the sector adopts a wide range of job titles across different organisations. This also indicates that the primary responsibilities of staff may not always match their formal job title.
Workplace barriers
The WP Survey explored barriers at work faced by family violence and sexual assault specialists. Respondents highlighted that staff vacancies were very common and had an impact upon the ability of staff to perform work well.
Most significant barriers at work
The survey asked respondents to nominate the 3 most significant barriers that prevent staff from performing optimally at work, including an option to state there were none.
2 of the most common barriers were ‘staff issues (short staffed)’ as nominated by over 41% of those who responded to the survey (434 mentions) and ‘too many competing priorities’ as nominated by over 35% of respondents (367 mentions) (Table 14).
Other common barriers reported by respondents included ‘corporate processes’ (317 mentions), ‘case loads’ (270 mentions) and ‘administrative process (including leave and HR processes)’ (183 mentions).
Table 14: Which of the following are currently the most significant barriers that prevent you performing optimally at work?
| Count | |
| Staff issues (short staffed) | 434 |
| Too many competing priorities | 367 |
| Corporate processes (including adminstrative burden) | 317 |
| Case loads | 270 |
| Administrative processes (including leave and HR requirements) | 183 |
| Decision making and authorisation processes | 171 |
| There are no noticeable barriers | 131 |
| Communication processes | 125 |
| Poor work-life balance | 106 |
| Technology limitations | 86 |
| Other | 581 |
Source. Question 12, WP Survey 2022
Impact of vacancies on service provision
Staff vacancies were identified as very common in the family violence and sexual assault sector, with 81% stating that their current employer had staff vacancies, and only a small proportion (10%) stating their current employer did not have staff vacancies (Table 15).
Table 15: As far as you know, does your employer currently have staff vacancies?
| Count | Percentage | |
| Yes | 854 | 81% |
| No | 109 | 10% |
| Don't know/unsure | 85 | 8% |
| Grand Total | 1,048 | |
| Missing/skipped question | 1 |
Source. Question 13, WP Survey 2022
The impact of staff vacancies was widely felt. Of those that stated their current employer had staff vacancies, 83% stated that staff vacancies were having a moderate, high or very high impact in terms of hindering their team’s ability to meet service delivery targets (Table 16).
Across all respondents, 83% stated that staff vacancies were having a ‘moderate’, ‘high’ or ‘very high’ impact in terms of hindering their team’s ability to meet service delivery targets.
Table 16: What impact do current staff vacancies have in hindering your team’s ability to meet service delivery targets?
| Count | Oercentage | |
| No impact | 33 | 4% |
| Low impact | 109 | 13% |
| Moderate impact | 282 | 33% |
| High impact | 265 | 31% |
| Very high impact | 165 | 19% |
| Total | 854 | |
| Missing/skipped questions | 0 |
Source. Question 13A, WP Survey 2022
A similar proportion of young people (under 35) and older people were aware of vacancies at their workplace. However, a greater proportion of young people believed vacancies had a ‘high’ or ‘very high’ impact on their team’s ability to meet service delivery targets. 54% of people under 35 stated it had a ‘high’ or ‘very high’ impact, compared to 48% of 35 and over.
A larger proportion of people working in regions were aware of vacancies at their workplace. 86% of people delivering services into regions were aware of vacancies, compared to 79% in metropolitan Melbourne. However, fewer people working in the regions thought that the impact of vacancies was high or very high. 48% delivering services into the regions stated it had a high or very high impact, compared to 52% in metropolitan Melbourne.
People in secure employment were more aware of vacancies at their workplace. 83% of people working in ongoing full time or part time roles were aware of vacancies at their workplace, compared to 73% of those in insecure employment. However, job security did not have a significant effect upon whether vacancies in the workplace were considered as having a ‘high’ or ‘very high’ impact.
Career and future intentions
The WP Survey explored the employment experiences and career trajectories of family violence and sexual assault specialists, including questions on their future career intentions.
Length of employment
Results from the survey indicate that the vast majority of people who responded were new in their roles, and many were new to their sector.
31% of those who responded (327 persons) had less than one year's experience working in their current role within their organisation. 63% (663 persons) had only been employed in their current role for 2 years or less, with 89% (941 persons) employed in their current role for 6 years or less (Table 17).
Table 17: Overall, how many years' experience do you have working in your current role within your organisation?
| Count | Percentage | |
| Less than 1 year | 327 | 31% |
| 1 to 2 years | 336 | 32% |
| 3 to 4 years | 182 | 17% |
| 5 to 6 years | 96 | 9% |
| 7 to 8 years | 36 | 3% |
| 9 to 10 years | 17 | 2% |
| 11 to 15 years | 36 | 3% |
| 16 to 20 years | 6 | <1% |
| More than 20 years | 9 | <1% |
| Grand total | 1,045 | |
| Missing/skipped question | 4 |
Source. Question 14, WP Survey 2022
In comparison, 31% (322 persons) had been employed in their current sector for 2 years or less, with 63% (654 persons) employed in their current sector for 6 years or less (Table 18).
Table 18: Overall, how many years' experience do you have working in your sector?
| Count | Percentage | |
| Less than 1 year | 131 | 13% |
| 1 to 2 years | 191 | 18% |
| 3 to 4 years | 192 | 18% |
| 5 to 6 years | 140 | 13% |
| 7 to 8 years | 91 | 9% |
| 9 to 10 years | 76 | 7% |
| 11 to 15 years | 113 | 11% |
| 16 to 20 years | 55 | 5% |
| More than 20 years | 52 | 5% |
| Grand total | 1,041 | |
| Missing/skipped question | 8 |
Source. Questions 15A, 15B, 15C and 15D, WP Survey 2022
85% of young people (under 35) had worked in their current role for 2 years or less, compared to 52% of those 35 and over. 52% of young people had worked in the sector for 2 years or less, compared to 19% of those 35 and over.
Prior to their current employment, 20% of young people (under 35) were studying, compared to only 10% of those 35 and over. 44% of young people (under 35) were working in a related sector prior to their current role, compared to 52% of those 35 and over.
62% of people working in large organisations had 2 years or less experience in their current roles, compared to 56% of those working in ‘other’ organisations. However, fewer people employed in large organisations had 2 years or less experience in the sector (25%), compared to 29% people working in ‘other’ organisations.
A larger proportion of people without job security had less experience in their current role. 61% of those securely employed had 2 years or less experience, compared to 76% of those insecurely employed. 34% of people employed on an insecure basis had 2 years or less experience in the sector, compared to 30% employed on a secure basis.
Prior employment or study
Prior to their current role, the most common role identified amongst those who responded was work in a related sector, with 48% (502 persons) stating they worked in a related sector (Table 19). 14% (150 persons) stated they worked for another organisation in the same sector, 13% (136 persons) stated they were studying and 13% (135 persons) stated they were working in an unrelated sector.
Table 19: Immediately before commencing employment in your family violence role, were you…
| Count | Percentage | |
| Working in a related sector | 502 | 48% |
| Working for another organisation or agency in the same sector | 150 | 14% |
| Studying | 136 | 13% |
| Working in an unrelated sector | 135 | 13% |
| Undertaking a student placement | 71 | 7% |
| Parental or carer’s responsibilities | 29 | 3% |
| Unemployed | 12 | 1% |
| Working in the same sector | 7 | <1% |
| Volunteer | <5 | <1% |
| Prefer not to say | <5 | <1% |
| Grand total | 1,044 | |
| Missing/skipped question | 5 |
Source. Questions 16A, 16B, 16C, 16D, WP Survey 2022
People in secure employment were more likely to have worked in a related sector prior to their current role. 49% of those working in secure employment were working in a related sector prior to their current role, compared to 41% of people not in secure employment. In contrast, 21% of those in insecure employment were previously working for another family violence organisation or agency, higher than 14% of those in secure employment.
49% of those delivering services into the regions were working in a related sector prior to their current role, about the same as those in metropolitan Melbourne. 53% of those working in a large organisation were working in a related sector prior to their current role, compared to 47% of those working in an ‘other’ organisation.
Amongst those undertaking a student placement prior to their current role, 70% (50 persons) were undertaking a student placement in the same organisation or in another organisation from the same sector (Table 20).
Table 20: Were you undertaking a student placement…
| Count | Percentage | |
| Student placement in the same organisation | 27 | 38% |
| Student placement in another organisation in the sector | 23 | 32% |
| Student placement in another organisation in a related sector | 16 | 23% |
| Student placement in an unrelated sector | 5 | 7% |
| Total | 71 | |
| Missing/skipped question | 0 |
Source. Question 16E, WP Survey 2022
Amongst those working in another organisation, 89% (131 persons) worked for another organisation in Victoria (Table 21).
Table 21: Were you working in another organisation or agency…
| Count | Percentage | |
| Work for another organisation or agency in Victoria | 131 | 89% |
| Work for another organisation or agency outside Victoria (but in Australia) | 14 | 10% |
| Work for another organisation or agency in the sector overseas | <5 | <1% |
| Total | 147 | |
| Missing/skipped question | 23 |
Source. Question 16F, WP Survey 2022
Intention to leave
Almost a third (32%) of those who responded to the survey expressed an intention to leave their role at any time (Table 22), with another 4% likely to leave their role to due to expiration of their employment contract. Of those who responded, 22% stated their intention to leave their current role in the next 12 months.
Table 22: Thinking about your future, do you have plans to leave your current role?
| Count | Percentage | |
| No plans to leave my current role at this stage | 539 | 52% |
| Yes, within the next 6 months | 148 | 14% |
| Yes, in next 6 to 12 months | 87 | 8% |
| Yes, in more than 12 months’ time | 97 | 9% |
| Yes, leaving due to end of contract | 37 | 4% |
| Don’t know/unsure | 138 | 13% |
| Grand total | 1,046 | |
| Missing/skipped question | 3 |
Source. Question 17, WP Survey 2022
When respondents who expressed an intention to leave were asked further about what they intended to do, only 30% stated they intended to work outside the sector, with 35% stating they intended to continue to work within the sector and 24% stating they were unsure (Table 23).
Table 23: Do you intend to leave your current role for another role... (family violence, sexual assault, child and family services)
| Count | Percentage | |
| Within your sector | 129 | 35% |
| Outside your sector | 109 | 30% |
| Don’t know/unsure | 88 | 24% |
| I plan to cease work temporarily | 15 | 4% |
| I plan to cease work permanently (retire) | 12 | 3% |
| Other | 16 | 4% |
| Total | 369 | |
| Missing/skipped question |
Source. Questions 18A, 18B, 18C, 18D, WP Survey 2022
There was little difference whether persons worked in the Melbourne metropolitan area or the regions on whether those persons planned to leave their roles in the next 12 months. Although people in the regions were more likely to be looking for a role outside the sector. Of those who were looking to leave their role, 37% of those working in metropolitan Melbourne were looking to stay in the same sector, compared to 33% of those working in the regions.
A larger proportion of young people expressed an intention to leave their role in the next 12 months. 49% of people under 35 have no plans to leave their role, compared to 54% of those 35 and over. 24% of people under 35 intend to leave their role in the next 12 months, compared to 20% of those 35 years or older.
However, a larger proportion of young people were likely to look for another role in the sector. Of those who are looking to leave their role, 41% under 35 are looking to leave their current role for another role in the sector, compared to 32% of 35 and over who are looking to leave their role for another role in the sector. This difference was largely due to a much larger proportion of those 35 and over looking to retire.
A much larger proportion of people employed on an insecure basis were looking to move on from their roles. Only 38% of those employed on an insecure basis had no plans to leave their role, compared to 54% of those securely employed. Furthermore, 25% employed on an insecure basis planned to leave the sector in the next 12 months, compared to 20% of those employed on a secure basis.
Reasons for intention to leave
From respondents who indicated a voluntary intention to leave, the survey then asked to nominate the 3 top reasons they were planning to leave their current job. The top 3 reasons given for planning to leave their current role were career prospects (110 mentions), excessive levels of demand (103 mentions) and insufficient income/salary (82 mentions) (Table 24). The other top reasons included lack of advancement opportunities (82 mentions) and organisation not valuing my work (53 mentions).
Table 24: What are your top 3 reasons for planning to leave your current job in the time frame indicated?
| Count | |
| Career prospects | 110 |
| Excessive levels of demand | 103 |
| Insufficient income/salary | 82 |
| Lack of advancement opportunities | 82 |
| Organisation not valuing my work | 53 |
| Role requirements having a negative effect on my health and/or wellbeing | 52 |
| Lack of organisational resources to adequately undertake role | 50 |
| Location not favourable | 49 |
| Relationship with manager/colleagues | 44 |
| Further study | 39 |
| Other | 241 |
Source. Question 19, WP Survey 2022
About the participants
The WP Survey explored the demographic background of family violence and sexual assault specialists responding to the survey.
Gender
87% of those who responded (913 persons) identified as female, with 9% (91 persons) identifying as male and 2% (24 persons) identifying as self-described (Table 25).
Table 25: What gender do you identify as?
| Count | Percentage | |
| Female | 913 | 87% |
| Male | 91 | 9% |
| Self-described | 24 | 2% |
| Prefer not to say | 18 | 2% |
| Grand total | 1,046 | |
| Missing/skipped question | 3 |
Source. Question 20, WP Survey 2022[13]
While about the same proportion of young and older people identified as female, fewer young people identify as male. 6% of those under 35 identify as male, compared to 10% of those 35 or older.
Age
35% of those who responded (370 persons) were under 35 years, with the largest age group in the sample being 30-34 years, with 16% (170 persons), and 25-29 years being the second largest with 16% (167 persons) (Table 26).
Table 26: How old are you?
| Count | Percentage | |
| 20 to 24 years | 33 | 3% |
| 25 to 29 years | 167 | 16% |
| 30 to 34 years | 170 | 16% |
| 35 to 39 years | 132 | 13% |
| 40 to 44 years | 114 | 11% |
| 45 to 49 years | 119 | 11% |
| 50 to 54 years | 109 | 10% |
| 55 to 59 years | 80 | 8% |
| 60 to 64 years | 64 | 6% |
| 65 to 69 years | 16 | 2% |
| 70 to 74 years | <5 | <1% |
| 75 to 79 years | <5 | <1% |
| Prefer not to say | 37 | 4% |
| Grand total | 1,043 | |
| Missing/skipped question | 6 |
Source. Question 22, WP Survey 2022
Sexual orientation
68% of those who responded (715 persons) identified as heterosexual / other gender attracted, with 13% (135 persons) identifying as multi-gender attracted, 6% (67 persons) identifying as same sex / gender attracted and 1% (7 persons) identifying as asexual (Table 27).
Table 27: How would you describe your sexual orientation?
| Count | Percentage | |
| Heterosexual/other gender attracted | 715 | 68% |
| Same sex/gender attracted | 67 | 6% |
| Multi-gender attracted | 135 | 13% |
| Asexual | 7 | <1% |
| None of the above | 14 | 1% |
| Prefer not to say | 108 | 10% |
| Grand total | 1,046 | |
| Missing/skipped question | 3 |
Source. Question 21, WP Survey 2022[14]
Fewer young people identified as heterosexual. 66% of those under 35 identified as heterosexual, compared to 73% of those 35 and over. 20% of those under 35 identified as multigender attracted, compared to 9% of those 35 and over. In contrast, the same proportion (7%) identified as same sex attracted.
A larger proportion of people living in the regions identified as heterosexual, with 73% of those delivering service in regional Victoria identifying as heterosexual compared to 65% of those living in Melbourne.
Also, a larger proportion of people employed by large organisations identified as heterosexual, with 73% of those in large organisations identified as heterosexual compared to 65% of those in other organisations.
Finally, a larger proportion of people employed on an insecure basis identified as same sex attracted. 9% of those employed in insecure work identified as same sex attracted compared to 6% of those in secure employment. Likewise, 69% of those in secure employment identified as heterosexual, compared to 65% of those in insecure work.
Aboriginal and Torres Strait Islander status
5% of those who responded (48 persons) identified as Aboriginal and Torres Strait Islander, including 4% (45 persons) who identified as Aboriginal and others who identified as Torres Strait Islander or both Aboriginal and Torres Strait Islander (Table 28).
Table 28: Are you of Aboriginal or Torres Strait Islander origin?
| Count | Percentage | |
| Yes - Aboriginal | 45 | 4% |
| Yes - Torres Strait Islander | <5 | <1% |
| Yes - Aboriginal and Torres Strait Islander | <5 | <1% |
| No | 970 | 93% |
| Prefer not to say | 22 | 2% |
| Grand total | 1,040 | |
| Missing/skipped question | 9 |
Source. Question 24, WP Survey 2022[15]
A larger proportion of people working in regions identified as Aboriginal and or Torres Strait Islander. 7% of people delivering services into regional Victoria identified as Aboriginal and or Torres Strait Islander compared to 3% of people delivering services in metropolitan Melbourne.
Cultural or ethnic background
The WP Survey asked a series of questions to explore cultural diversity, given the complexities with which cultural and ethnic background is commonly understood. These included questions about birthplace and language spoken at home, as well as ancestry to account for cultural diversity across second and third generation migrants.
21% of those who responded (215 persons) were born overseas, with 77% (799 persons) born in Australia (Table 29). The 5 most common countries of birth other than Australia were the United Kingdom (5%), India (3%), New Zealand (2%), China (2%) and Sri Lanka (8%). All countries of birth with 5 persons or above are identified below in Table 29.
Table 29: In which country were you born?
| Count | Percentage | |
| Australia | 799 | 77% |
| United Kingdom | 48 | 5% |
| India | 27 | 3% |
| New Zealand | 21 | 2% |
| China | 14 | 1% |
| Sri Lanka | 8 | <1% |
| South Africa | 7 | <1% |
| Canada | 6 | <1% |
| Prefer not to say | 27 | 3% |
| Other | 71 | 7% |
| Grand total | 1,041 | |
| Missing/skipped question | 8 |
Source. Question 25, WP Survey 2022
A larger proportion of people working in regions were born in Australia. 85% of people delivering services into the regions identified as being born in Australia, compared to 71% of people delivering services in Melbourne.
Australian was the most common ancestry, with 67% of those who responded to this question identifying Australian as one of their 2 ancestries (Table 30).[16] The 5 most common ancestries other than Australian were English (11%), Irish (5%), Scottish (4%), Indian (3%) and Italian (3%). Compared with country of birth, ancestry responses indicated in many instances higher levels of cultural diversity in the sample with 3% (32 persons) identifying from Italian ancestry, 3% (28 persons) identifying from Chinese ancestry and 2% (21 persons) identifying from Greek ancestry.
Table 30: What cultural background or ethnicity do you identify with?
| Frequency | % Persons | |
| Australian | 698 | 67% |
| English | 114 | 11% |
| Irish | 57 | 5% |
| Scottish | 43 | 4% |
| Indian | 36 | 4% |
| Italian | 32 | 3% |
| Chinese | 28 | 3% |
| Greek | 21 | 2% |
| German | 16 | 2% |
| Other | 185 | 18% |
| Prefer not to say | 35 | 3% |
| Grand total | 1,265 |
Source. Question 26, WP Survey 2022[17]
Language spoken at home and work
91% of those who responded (956 persons) described English as either the only, or one of, the main languages spoken at home (Table 31). Other than English, the 5 most common languages spoken at home were Mandarin (2%), Spanish (1%), Arabic (1%), Hindi (1%) and an Aboriginal and/or Torres Strait Islander language (1%).
Table 31: Which language(s) do you mainly speak at home?
| Count | Percentage | |
| English | 956 | 91% |
| Mandarin | 17 | 2% |
| Spanish | 15 | 1% |
| Arabic | 11 | 1% |
| Hindi | 11 | 1% |
| Aboriginal and/or Torres Strait Islander language | 9 | <1% |
| Punjabi | 9 | <1% |
| Greek | 8 | <1% |
| Cantonese | 7 | <1% |
| Vietnamese | 8 | <1% |
| Other | 67 | 6% |
| Prefer not to say | 8 | <1% |
| Grand total | 1,034 |
Source. Question 27, WP Survey 2022[18]
Of the 145 respondents who spoke a language other than English at home, 78 stated they used that language in their family violence or sexual assault role or roles (Table 32).
While non-English language ability is reflected in a small proportion of the overall sample, 54% of specialists who did speak a language other than English at home were able to use these skills in the course of their employment.
Table 32: Do you use language(s) to carry out your role or roles?
| Count | Percentage | |
| Yes | 78 | 54% |
| No | 66 | 46% |
| Prefer not to say | <5 | <1% |
| Total | 145 | |
| Missing/skipped question | 8 |
Source. Question 27A, WP Survey 2022
From this small group who spoke a language other than English, 55% of those delivering services into the Melbourne metropolitan area used another language to carry out their role, compared to 49% delivering services into the regions.
A larger proportion of older people used another language in their capacity at work. 57% of those 35 and over, used another language to carry out their role, compared to 52% of those under 35.
Of the same group, only 46% of people working in a large organisation used it at work, where 64% of those who spoke another language in ‘other’ organisations used it at work. Also, a smaller proportion of those without job security used another language in their capacity at work. 55% of those in secure employment used another language to carry out their role, compared to 50% of those in insecure employment.
Disability or impairment impacting employment
10% of those who responded (104 persons) identified they had a long-term health condition or disability that affected their participation in work (Table 33).
Table 33: Does a long-term health condition or disability affect your participation in work (paid and/or volunteering)?
| Count | Percentage | |
| Yes | 104 | 10% |
| No | 904 | 87% |
| Don't know/unsure | 28 | 3% |
| Grand total | 1,036 | |
| Missing/skipped question | 13 |
Source. Question 28A, WP Survey 2022[19]
A larger proportion of young people identified as having a health condition or disability that affected their participation in work. 13% of those under 35 had a long-term health condition or disability that affected their participation in work, compared to 8% of those 35 and over.
There was little difference between workers who had a long-term health condition or disability that affected their participation in work based on organisational size.
Education attainment
81% reported a Bachelor qualification or above as their highest level of educational attainment (857 persons) (Table 34), with more than a half of those who responded (572 persons) listing a postgraduate qualification as their highest level of educational attainment.
Table 34: Which of the following have you completed?
| Count | Percentage | |
| Year 12 or below | 5 | <1% |
| Certificate I to IV | 22 | 2% |
| Diploma or advanced diploma | 160 | 15% |
| Bachelor’s degree | 276 | 26% |
| Graduate diploma or graduate certificate | 200 | 19% |
| Master’s degree | 349 | 33% |
| Doctorate degree | 23 | 2% |
| Prefer not to say | 9 | <1% |
| Grand total | 1,044 | |
| Missing/Skipped question | 5 |
Source. Question 23, WP Survey 2022[20]
Young people were much more likely to hold a post-secondary higher education qualification than older people. 87% of people under 35 stated their highest attainment was a Bachelor’s degree, a graduate certificate or diploma, a Master’s degree or Doctoral degree, compared to 80% of those 35 or older. 44% of people under 35 held a Master’s or doctoral degree, compared with 31% of those 35 or older.
Notably, there was little difference in post-secondary higher education attainment, based on the size of the organisation the person worked for.
Main field of study
The survey invited anyone who had attained a postsecondary qualification to nominate their field of study, including those who had attained a VET qualification. Amongst those who responded, 38% (395 persons) described social work as their main field of study. The other main fields of study included community services (141 persons), psychology (124 persons) and counselling (79 persons) (Table 35).
Table 35: What was your main field of study in your highest qualification?
| Count | Percentage | |
| Social work | 395 | 38% |
| Community services | 141 | 14% |
| Psychology | 124 | 12% |
| Counselling | 79 | 8% |
| Family Violence | 37 | 4% |
| Social science | 31 | 3% |
| Criminology/Legal studies | 17 | 2% |
| Arts / Humanities | 17 | 2% |
| Youth work | 13 | 1% |
| Community development | 12 | 1% |
| Client assessment and case management | 12 | 1% |
| Other | 142 | 14% |
| Prefer not to say | 7 | <1% |
| Grand total | 1,027 | |
| Missing/skipped question | 22 |
Source. Question 23A, WP Survey 2022
A larger proportion of young people had completed a social work qualification. 49% of people under 35 had completed a qualification in social work, compared to 35% of those 35 and over.
Notes
[13] The self-described category includes the following self-identified gender identities: non-binary, genderqueer, trans, agender, gender fluid and no specification.
[14] Options provided in the WP Survey's sexual orientation question were modified from the Victorian's Government's Data collection standards, based on preferences identified within the sector.
[15] The survey enabled respondents to click yes to Aboriginal, Torres Strait Islander or both Aboriginal and Torres Strait Islander.
[16] In the survey you were unable to nominate the same ancestry twice, but you could nominate 2 different ancestries and either one ancestry or none.
[17] In this question, those who responded were provided the opportunity to nominate up to 2 ancestries.
[18] This question allowed for more than one language spoken at home to be nominated.
[19] As many as 1 in 5 Australians identify as having a disability or impairment, according to the Australian Institute of Health and Welfare. The survey asked a more specific question about disability or impairment that impacts upon participation in work, similar to the language used in the ABS Census.
[20] The result has been modified from the original question and validated to address highest attainment instead of all qualifications completed.
Appendix - methodology
The Family Violence and Sexual Assault Workforce Pulse Survey was a survey of family violence and sexual assault specialists working in funded agencies and The Orange Door and included child wellbeing specialists at The Orange Door. It was conducted between September and October 2022.
Compared to the Family Violence Workforce Censuses conducted in 2017 and 2019,[21] the Family Violence and Sexual Assault Workforce Pulse Survey covered a narrower set of questions and did not extend to prevention or broader non-specialist workforces. It was also the first time a specialist workforce survey was conducted directly by Family Safety Victoria.
Similar to prior Censuses, the survey utilised a non-probability convenience sampling approach. A sampling frame based on type of employer was developed to better define the target population and track survey performance.
Target population
Understanding a survey’s target population can be important for a range of reasons. Defining the actual or probable size of the target population means a sampling method can be developed and/or the performance of a survey can be tracked according to sample size. For this survey, the target population was defined to include any worker in Victoria who provided services to clients through a:
- specialist family violence services (victim survivors) organisation
- sexual assault support services organisation
- Aboriginal Community Controlled Organisation
- Family Violence Perpetrator Interventions organisation (including specialist family violence services for adults using violence and Men's Behaviour Change Program providers)
- specialist services through The Orange Door network, including child wellbeing specialists.
The target population was defined to exclude workers employed:
- by a peak body, such as Safe and Equal
- from the Primary Prevention workforce
- to deliver administration services at a family violence or sexual assault organisation
- by Victoria Police, the Victorian Courts System or Corrections Victoria
- at Family Safety Victoria
- in a primary human services role that did not have a family violence or sexual assault intervention and/or support focus (e.g. employed by a homelessness service).
Family Safety Victoria used internal data to identify a headcount of workers employed by TOD network. Beyond TOD network, Family Safety Victoria used a formula to estimate the family violence and sexual assault workforces employed across non-government agencies based on funding allocated by the Victorian government to funded agencies in the 2021-22 financial year. This formula generated a headcount estimate, that was further qualified by approximate administration costs and vacancy rates.
Furthermore, the projected headcount for workers at funded agencies was reviewed against historical agency workforce data, as collected by the Australian Charities and Not-for-Profit Commission (ACNC) and Workplace Gender Equality Agency (WGEA).[22]
This process provided Family Safety Victoria a basis to track the performance of different target sub-populations and target communications while the survey was in-field. An example of its use is demonstrated below in the segmentation of the sample as a proportion of estimated target subpopulations (Table 36).
Table 36: Survey response segmented by estimated subpopulations
| Sector | Survey sample | Estimated population | % Estimated population |
| TOD network, including child wellbeing specialists | 289 | 1,028 | 28% |
| SFVS organisation | 426 | 1,079 | 40% |
| SASS organisation | 162 | 347 | 47% |
| FVPI organisation | 110 | 277 | 40% |
| ACCO | 62 | 272 | 23% |
| Grand total | 1,049 | 3,003 | 35% |
Source. WP Survey 2022
Response rate
At the close of the survey on 21 October 2022, 1,681 users had accessed the survey, with a completion rate of 62.4%. The raw data was cleaned to deidentify open text responses and improve data quality.
The final survey sample is 1,049 responses, representing a response rate of approximately 35% of the target population.[23] The final sample is composed of a combination of total and partial completions. Partial completions were included if 80% or more of the survey was completed. We note that due to the nature of the collection method, the response rate does not precisely reflect the workforce actually reached.
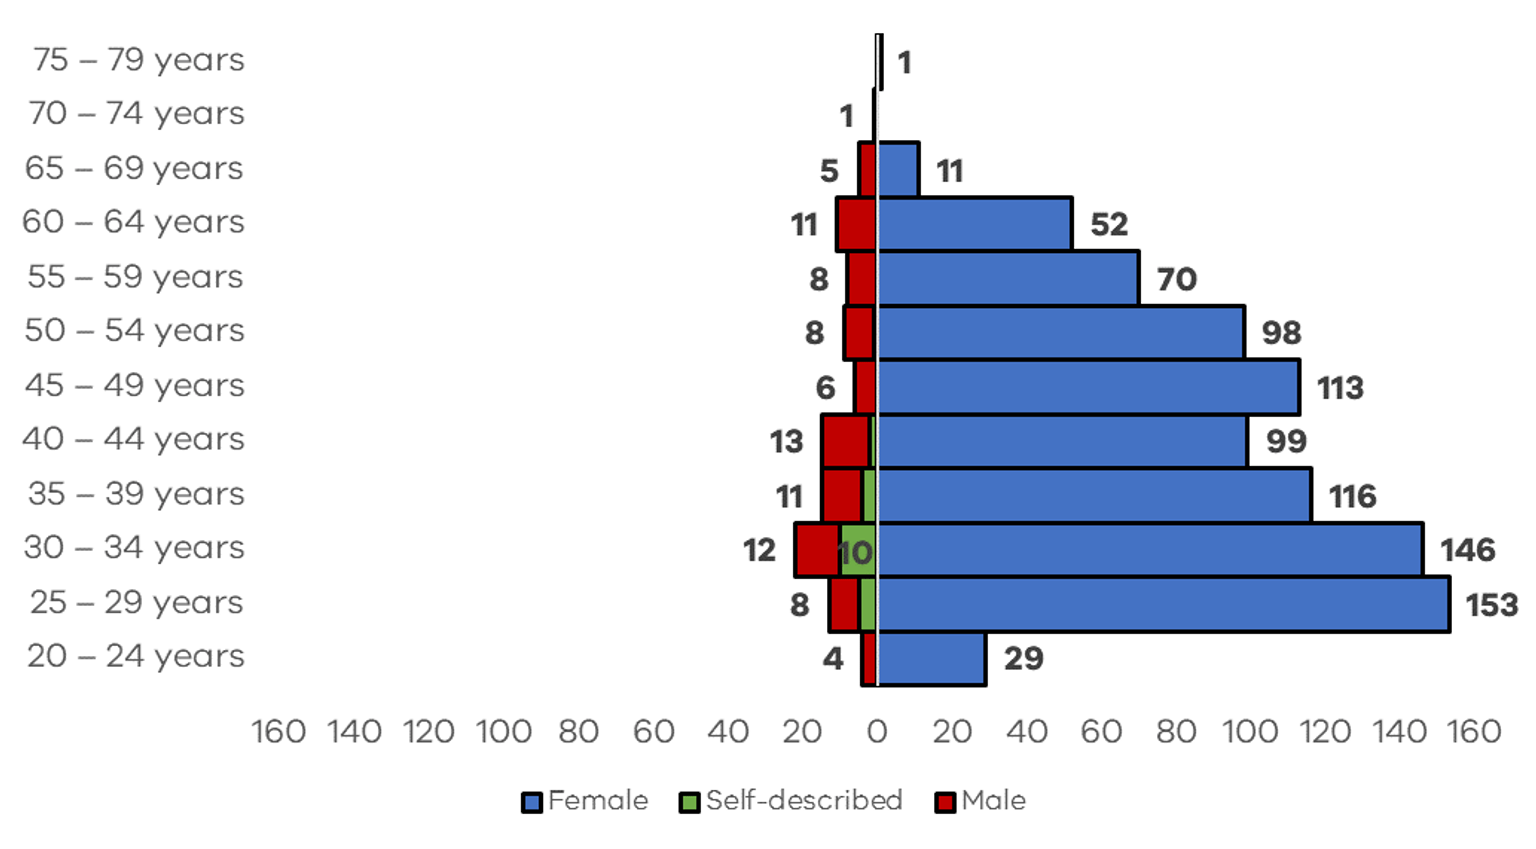
The age distribution for the survey sample is portrayed below (Figure 1).
Figure 1: Population pyramid for the Workforce Pulse Survey 2022
Validity assessment
While response rate is commonly considered the most important measure of a survey’s validity, research demonstrates there are conceptual and functional limitations for using response rate as an exclusive benchmark, and sample validation has emerged as relevant to understanding whether a survey sample is high quality, appropriate and representative.[25]
An alternative to focusing on whether a response rate is either high or low is to assess whether the responses are ‘functional’ or ‘dysfunctional’. The WP Survey, while not subject to random sampling, applied a number of measures to assess sample quality including clear eligibility questions within the survey, an extensive data cleaning process and data quality checks post-survey.
In order to assess sampling validity, Family Safety Victoria also undertook data quality checks by comparing characteristics of the survey sample to a workforce proxy derived from the 2021 ABS Census[26] and population data available from other comparable workforce surveys.[27]
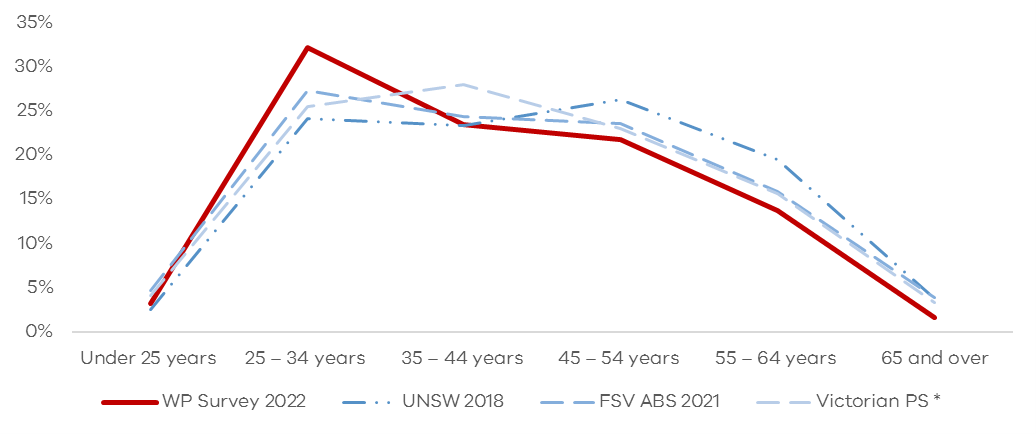
On the basis of age distribution, the sample was broadly consistent with comparable population surveys or data, although a concentration of younger workers were reflected in the 2022 Workforce Pulse Survey sample (Figure 2).
Figure 2: Age distribution of various workforce surveys

On the basis of geographic distribution, the sample reflects a diverse range of geographic locations for service delivery. In particular, the survey was well-represented by workers in regional Victoria, with 38% of the sample delivering services in a regional Local Government Area.[28] The sample distribution on the basis of the region where services were delivered also reflected a very high level of diversity, with a Simpsons Diversity Index score of 0.92.[29]
Based on distribution across employers, the sample similarly reflected a high level of diversity. While respondents in the sample did not identify coming from almost one quarter of funded organisations, the 738 individuals who identified where they worked were employed across 101 organisations, providing a very high Simpsons Diversity Index score of 0.98.
We caution there are certain areas where a true enumeration of the workforce might contribute stronger insights into the limitations in sample quality. For instance, analysis based on 2019 ACNC data for a proportion of funded agencies indicates there may potentially be an under-representation of part time and casual workers.
While this analysis does not lead Family Safety Victoria to make a categorical claim about the representativeness of the sample, the process provides greater assurance that the survey methodology was appropriately targeted at the family violence and sexual assault workforce, that there was limited sampling frame error, and therefore that both the survey methodology and findings are valid.
Communications and survey tracking
A communications strategy was developed to focus communications across the target population while the survey was in field. This strategy focused on contact with segmented populations through employers and peak bodies, through social media, as well as direct engagement with some of the target population through internal email lists and communications channels.
The communications strategy enabled the survey team to track and analyse in situ the impact of individual communications tactics, by reviewing on a periodic basis survey completions and relevant landing page views. It also enabled the survey team to modify and test appropriate language for the target audience.
Our broad observation is that a survey campaign over a period of time is required to build the target sample, given that the family violence and sexual assault workforces appear time poor.
Furthermore, periodic direct engagement via Family Safety Victoria mailing lists had the largest measurable impact upon the response rate and represented the most effective method of access to the target population within this campaign. This mode of contact was enhanced by engagement from the peak bodies and other sector intermediaries. In future surveys, alternative methods of direct engagement with the target population planned in advance of the survey’s delivery will likely have the largest effect on increasing the response rate.
Notes
[21] Family Safety Victoria, Family violence workforce census webpage, State Government of Victoria, accessed 15 February 2023.
[22] Australian Charities and Not-for-profits Commission, ACNC registered charities database webpage and Workforce Gender Equality Agency, WGEA data webpage, Australian Government data.gov.au, accessed 1 August 2022.
[23] Given the difference between the number of people who accessed the survey and the final sample size, future surveys may include further questions following the eligibility question to provide a clearer understanding of those who commenced but did not proceed through the survey.
[24] The self-described category included the following self-identified gender identities: non-binary, genderqueer, trans, agender, gender fluid and no specification.
[25] H Brooks Y Baruch, H Aguinis and G Ballinger (2002) “Survey response rates: Trends and a validity assessment framework”, Human Relations, Vol. 75, Issue. 8, pgs 1423-1643.
[26] Noting that there are no specific occupational (ANZSCO) or industry (ANZSIC) codes that identfy workers involved in family violence and sexual assault service delivery, a cross-tabulation of codes at the 4 and 6 digit level were used to reflect the breadth of relevant job roles or occupations specific to the target population for the WP Survey (for example, by excluding aged and disability carers, general administrative roles, registered nurses, etc). The 4-digit ANZSIC classes used were Other Health Care Services nec (8599); Other Allied Health Services (8539); Other Social Assistance Services (8790) and Religious Services (9540). The 6-digit ANZSCO occupations were Chief Executive or Managing Director (11111), Policy and Planning Manager (132411), Health and Welfare Services Managers nec (134299), Counsellors nfd (272100), Drug and Alcohol Counsellor (272112), Clinical Psychologists (272311), Social Worker (272511), Welfare Worker (272613), Community Worker (411711), Youth Worker (411716), Family Support Worker (411713), Program or Project Administrator (511112). This established a broad population proxy of approximately 18,000 workers in Victoria.
[27] UNSW Social Policy Research Centre, National survey of domestic violence and sexual assault workforces webpage, UNSW, accessed 1 August 2022; Victorian Public Sector Commission, Employee demographics and diversity webpage, Victorian Public Sector Commission, accessed 19 December 2022.
[28] This is compared to 33% who lived in a regional VIC Local Government Area according to the 2021 ABS Census.
[29] The Simpson’s Diversity Index is a way to measure the diversity of species in a community, with a value range between 0 and 1. Guajardo suggests a score range between 0.81 and 0.99 indicates a high degree diversity (heterogeneity). See SA Guajardo (2015) “Measuring Diversity in Police Agencies”, Journal of Ethnicity in Criminal Justice, Vol. 13, Issue 1, pgs 1-15.
Publication information
© State of Victoria, Australia, Family Safety Victoria, March 2023.

This work is licensed under a Creative Commons Attribution 4.0 licence. You are free to re‑use the work under that licence, on the condition that you credit the State Government of Victoria (Family Safety Victoria) as author, indicate if changes were made and comply with the other licence terms.
ISBN 978-1-76130-070-7 (pdf/online/MS word)