- Published by:
- Family Safety Victoria
- Date:
- 25 May 2021
Introduction
This report presents a brief summary of the findings from the Family Safety Victoria 2019-20 Census of Workforces that Intersect with Family Violence. For more detailed results per workforce, including a detailed methodology and survey approach, please see the following reports:
Background and research objectives
In July 2019, Family Safety Victoria (FSV) commissioned ORIMA Research to design and deliver the 2019-20 Census of Workforces that Intersect with Family Violence in Victoria. The overarching aim of the 2019-20 Census was to assist in deepening the Victorian Government’s understanding of a range of issues in the context of reforms recommended by the Royal Commission into Family Violence.
Three target audiences (workforces) were identified for the Census, as detailed in Table 1. This report presents the key topline findings across the three audiences. It should be noted that not all questions and sections were asked of each workforce. Request the full questionnaire by emailing the Centre for Workforce Excellence at cwe@familysafety.vic.gov.au.
| Workforce | Definition |
|---|---|
| Specialist family violence response |
|
| Primary prevention of family violence | Those who work to prevent family violence through systemic / organisational / community-level initiatives |
| Broader workforce that intersects with family violence |
|
Project development
Questionnaire development and sector consultation
The questionnaire (request a copy by emailing the Centre for Workforce Excellence at cwe@familysafety.vic.gov.au ) was developed by ORIMA Research and the FSV project team, with content informed by the previous Census.
Research approvals
Ethics approval was granted for this project by the ORIMA Research Human Research Ethics Committee on Thursday 31 October 2019 (Approval Number: 0112019). Research approvals were also granted by the Victoria Police Research Committee and the Victorian Department of Education and Training Research in Victorian Government Schools and Early Childhood settings committee.
Survey fieldwork
The survey was conducted between Monday 18 November 2019 and Friday 28 February 2020. A small extension was also granted for certain workforces until Friday 13 March 2020.
Survey dissemination
As there is no central or reliable record of contact details for all individuals employed in this sector ORIMA Research and the FSV project team relied on sector, departmental, and organisational (or similar) representatives to assist in a controlled dissemination of a generic Census survey link.
Response rate
A total of 5,021 responses were received for the Census across the 3 workforces (see Table 2). In advance of fieldwork, the FSV project team undertook an extensive data collection exercise to estimate the population size for each of the relevant workforces for this project. These figures were used to monitor response rates and are the basis for response rate figures below.
| Workforce | Population size (approx) | Number of responses | Response rate |
|---|---|---|---|
| Specialist family violence response | 2,491 | 1,575 | 63% |
| Primary prevention of family violence | 352 | 517 | 147%1
|
| Broader workforces that intersect with family violence | 222,070 | 2,929 | 1% |
Statistical precision and presentation of results
Statistical precision
As this survey was an attempted census of workforces that intersect with family violence (i.e. all those in scope for the survey were assumed to have been invited to participate, via either a personalised or generic survey link), the survey results are not subject to sampling error.
However, the survey is subject to potential non-sampling error, including coverage error and non-response error. Unlike sampling error, non-sampling error is generally not mathematically measurable. ORIMA Research uses several strategies to address sources of non-sampling error to the extent possible, including careful questionnaire construction and data processing quality control.
Presentation of results
Percentages in this report are based on the total number of valid responses made to the particular question being reported on. Results presented as percentages throughout the report may not add up to 100% due to rounding, or where participants were able to select more than one response. Suppression rules have been implemented throughout this report whereby groups of individuals with fewer than 10 respondents have not been reported on to protect respondent confidentiality.
All results are self-reported by respondents and have not been verified against any secondary data.
Footnotes
- The number of survey responses received for the primary prevention workforce was greater than the estimated population (147%). This may be due to several reasons, including the fact that population figures that were used to calculate response rates are estimates of the true population size. For more details please see the Survey findings report – Primary Prevention workforce.
Role requirements
In order to understand the role requirements across the three workforces, respondents were asked to report on the frequency with which they undertook various activities as part of their role. The most frequently undertaken core activities and family-violence related activities are presented below.
Core activities
Family violence response specialists and primary prevention practitioners reported that they undertook a range of ‘core’ activities as part of their role. The most frequently undertaken activities for each workforce were as follows:
| Workforce | #1 Most frequent | #2 Most frequent | #3 Most frequent |
|---|---|---|---|
| Specialist family violence response (n=1,436-1,468) |
Case advocacy (54% at least weekly) | Case management (47%) | Developing partnerships and fostering integration (42%) |
| Primary prevention (n=495-498) | Developing and maintaining partnerships and networks (64%) | Project management (56%) | Implementation of primary prevention initiatives (49%) |
Family violence response-specific activities
Table 4 illustrates the top 3 most frequently undertaken family violence response-specific activities for each workforce. Overall:
- Specialists generally undertook family violence response-specific activities more frequently than the core activities discussed above, whilst primary prevention practitioners generally undertook family violence response-specific activities less frequently than core activities.
- The activities that the aggregate broader workforce most frequently worked on were similar to those reported amongst specialists, though were undertaken less often (see Table 5 for detailed results by sub-groups).
| Workforce | #1 Most frequent | #2 Most frequent | #3 Most frequent |
|---|---|---|---|
| Specialist family violence response (n=1,509-1,526) |
Identification of family violence (70% at least weekly) | Screening for family violence risk (66%) | Monitoring on-going risk / changes in risk for a client (61%) |
| Primary prevention (n=498-502) | Proactive / voluntary family violence information sharing (29%) | Identification of family violence (28%) | Requesting information for FV risk assessment (14%) |
| Broader workforce aggregate (n=2,620-2,685) |
Screening for family violence risk (35%) | Identification of family violence (30%) | Family violence brief or intermediate risk assessment (20%) |
| Broader workforce sub-group | #1 Most frequently undertaken | #2 Most frequently undertaken | #3 Most frequently undertaken |
|---|---|---|---|
| Alcohol and Drug services (n=198-207) | Screening for FV risk (50%) | Identification of FV (45%) | FV brief or intermediate risk assessment (24%) |
| Ambulance services (n=145-148) | Screening for FV risk (13%) | Safety planning (12%) | Identification of FV (11%) |
| Broader community services (n=1,378-1,403) | Screening for FV risk (37%) | Identification of FV (33%) | Safety planning (21%) |
| Children, Families and Child Protection (n=392-397) | Identification of FV (42%) | Screening for FV risk (41%) | Safety planning (32%) |
| Community Health Services (n=295-300) | Screening for FV risk (39%) | Identification of FV (29%) | FV brief or intermediate risk assessment (19%) |
| Community Mental Health Services (n=196-200) | Screening for FV risk (43%) | Identification of FV (37%) | Safety planning (24%) |
| Court Services (n=82-86) | Identification of FV (43%) | Screening for FV risk (40%) | FV brief or intermediate risk assessment (32%) |
| Disability Services (n=109-112) | Screening for FV risk (14%) | Identification of FV (9%) | FV brief or intermediate risk assessment (7%) |
| Education (n=254-258) | Screening for FV risk (11%) | Identification of FV (10%) | Safety planning (8%) |
| Housing and Homelessness (n=168-169) | Screening for FV risk (35%) | Identification of FV (33%) | Safety planning (26%) |
| Justice (n=115-116) | Identification of FV (36%) | Screening for FV risk (26%) | Safety planning (22%) |
| Legal Services (n=56-58) | Identification of FV (48%) | Screening for FV risk (34%) |
FV brief or intermediate risk assessment (23%) Referring a client externally for family violence risk assessment or risk management (23%) |
| Maternal and Child Health (n=122-131) | Screening for FV risk (90%) | Identification of FV (40%) | FV brief or intermediate risk assessment (34%) |
| Other Community Services (n=257-264) | Screening for FV risk (38%) | Identification of FV (29%) | FV brief or intermediate risk assessment (22%) |
| Police (n=125-134) | Identification of FV (81%) | Screening for FV risk (80%) | FV brief or intermediate risk assessment (74%) |
| Public health (n=495-499) | Screening for FV risk (28%) | Identification of FV (16%) | FV brief or intermediate risk assessment (14%) |
| Settlement Services (n=32) |
Identification of FV (22%) Screening for FV risk (22%) |
FV brief or intermediate risk assessment (16%) Safety planning (16%) |
Requesting family violence secondary consultation internally (13%) |
| Youth Work (n=108-109) | Screening for FV risk (31%) | Identification of FV (26%) | Safety planning (23%) |
Employment conditions
This chapter details the employment conditions of the specialist and primary prevention workforces.
Employment type
Across the specialist and primary prevention workforces, over half of respondents indicated that they were employed on a full-time basis (ongoing or fixed term, 58% and 51% respectively - see Table 6); though primary prevention workers were less likely to hold ongoing full-time roles.
| Employment type | Specialist family violence response (n=1,532) | Primary prevention (n=504) |
|---|---|---|
| Ongoing full time | 46% | 34% |
| Fixed-term full time | 12% | 17% |
| Ongoing part time | 27% | 25% |
| Fixed-term part time | 10% | 18% |
| Casual / sessional | 3% | 4% |
| Other | 2% | 2% |
Hours and days worked
The majority of the specialist workforce indicated that they were generally paid to undertake their work during normal business hours (see Figure 1). Around one-in-five reported that they were frequently (‘often’ or ‘very often’) paid to undertake their work after hours on weekdays (19%), while 11% were frequently paid to work on weekends. A relatively smaller proportion of the primary prevention workforce reported frequently being paid to undertake their work after hours on weekdays (13%), whilst 7% reported doing so on weekends.
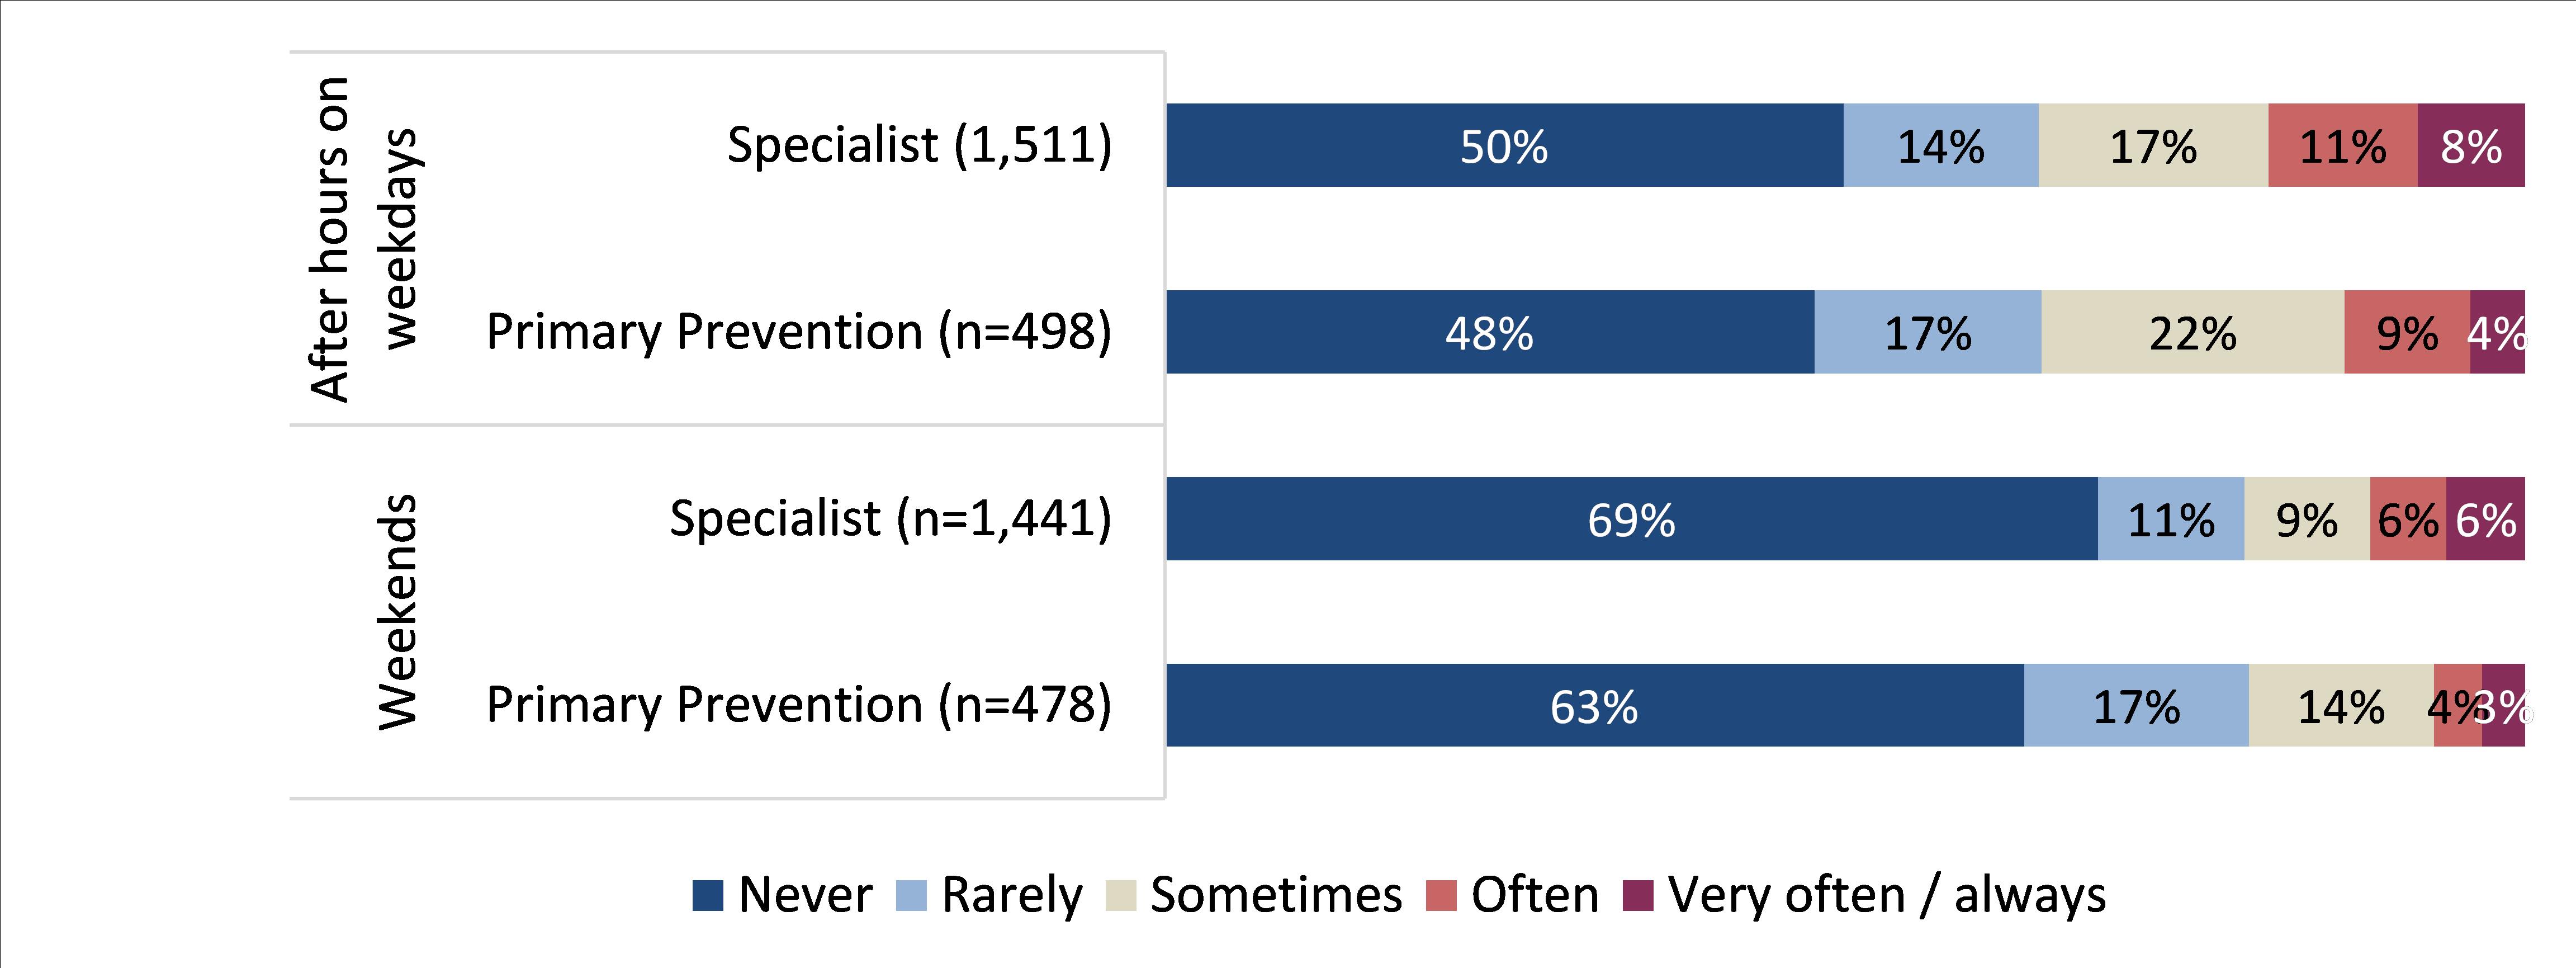
Unpaid work
Respondents were also asked to provide comment about any unpaid work that they undertook.
- Overall, fewer than one-in-three specialists indicated that they frequently worked additional unpaid hours (17% often and 14% very often / always), though a further 26% reported that they sometimes did so.
- Similarly, one-third of the primary prevention workforce reported that they often worked additional unpaid hours (21% often and 13% very often / always), whilst a further 30% noted that they sometimes did so.
Supervision
This chapter explores the extent to which the specialist and primary prevention workforces felt supported in the workplace, and the nature of their interactions with supervisors or managers.
Overall satisfaction
Most respondents from both the specialist and primary prevention workforces were satisfied with the quality of support provided by their supervisor or manager (75% and 72%, respectively). Very few reported being dissatisfied (14% of each workforce).
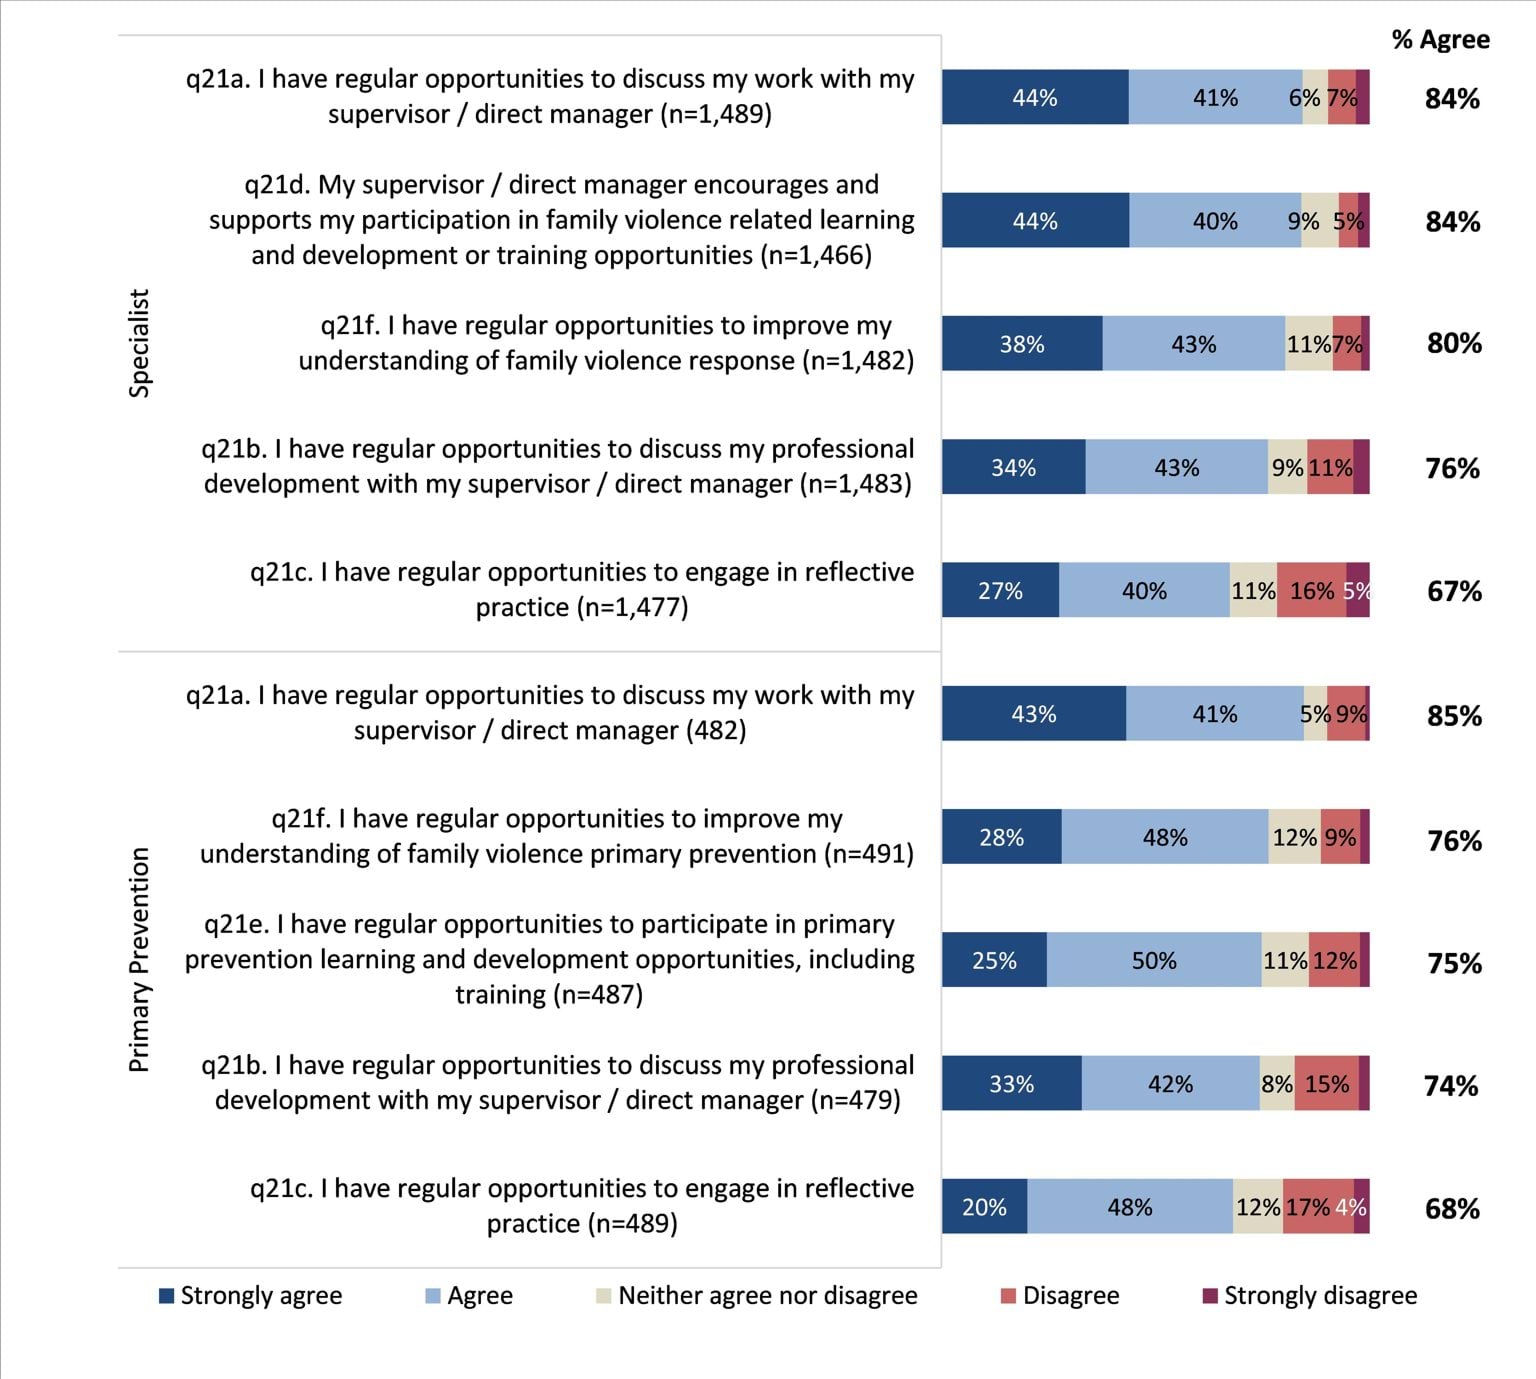
Both workforces were also asked about a range of more specific metrics associated with the support provided by their supervisors / managers, with respondents most frequently agreeing that they have regular opportunities to discuss their work with their supervisor / direct manager (see Figure 2 for detailed results).
Figure 2: Support/opportunity provided by manager
Professional supervision: Specialists
69% of the specialist family violence response workforce reported that they receive professional supervision in their current role1, with:
- 37% indicating that they received supervision from an external supervisor from outside their organisation; and
- 27% indicating that they received supervision from another internal supervisor.
Over three-quarters of these respondents reported being satisfied with the quality of the supervision they received from their line manager / internal supervisor (76%-78% satisfied) and 86% were satisfied with the quality of professional supervision they receive from an external supervisor.
26% of the specialist family violence response workforce indicated that they were responsible for providing professional supervision1, with:
- 70% providing supervision through individual / one-on-one sessions;
- 28% providing both individual and group supervision; and
- 2% providing supervision for groups only.
Most respondents who indicated that they provide professional supervision had been trained to provide such supervision (80%), though one-in-five had not received such training (20%).
Support: Primary prevention workforce
49% of the primary prevention workforce reported that there were fewer than five other primary prevention practitioners employed at their organisation; and 29% worked with just one, or no others.
As they often make up a small cohort within their organisations, the primary prevention workforce were also asked a series of additional questions regarding how they felt others viewed their role. Overall, the results suggested that many primary prevention practitioners felt that their role was not particularly well understood or valued within their organisation, with just:
- one-third (33%) feeling that their role was extremely or very well understood by others; and
- half (49%) that their role was extremely or very well valued by others in their organisation.
When asked about relationships that they held with others in the workforce, 46% reported that they were part of a regional primary prevention partnership or network, whilst just over half of respondents (51%) reported that they were a part of a community of practice for primary prevention practitioners; most of whom found it useful (85% of those who are part of such a community).
Footnotes
- Q23. In your current role, do you provide or receive professional supervision? Multiple responses accepted (n=1,475)
Training and confidence
This chapter explores the levels of confidence, understanding of the MARAM framework and perceptions of training across the three workforces. The information in this chapter may be used to inform potential future training and support requirements.
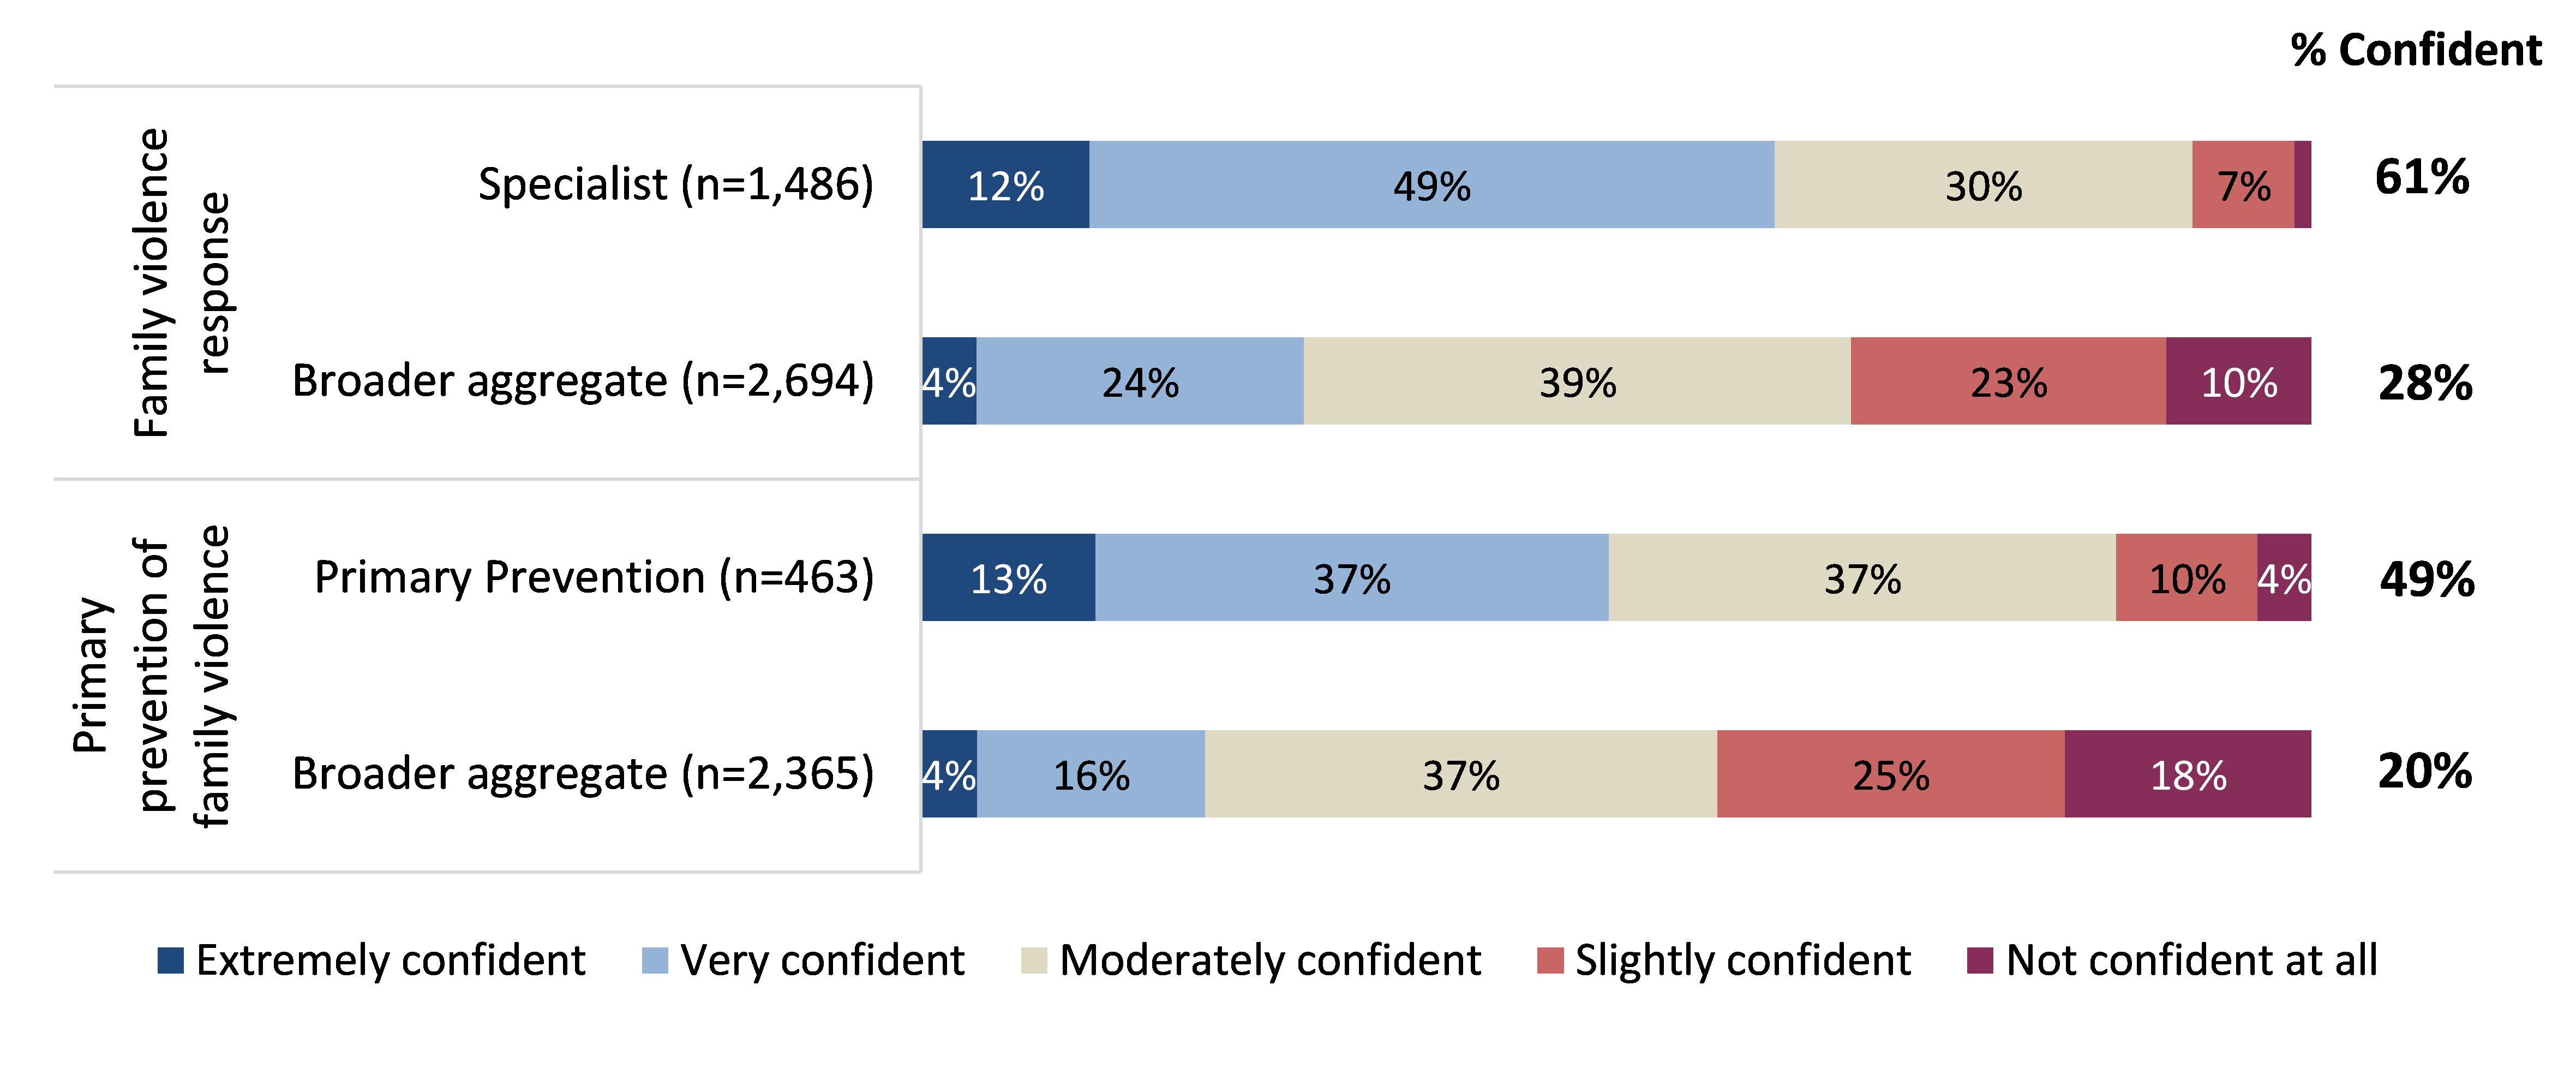
Confidence
Around three-in-five specialists indicated that they were ‘extremely’ or ‘very’ confident that they have had enough training and experience to effectively perform their role(s) in relation to family violence response (61%). Those in the broader workforce were also asked about their level of confidence, with only 28% indicating that they were confident.
In relation to the primary prevention of family violence, around half of primary prevention practitioners indicated they were at least very confident (49%), whilst just one-in-five respondents from the broader workforce indicated they were at least very confident (20%).
When asked about what additional support would increase their confidence in performing their role, all workforces indicated that information sharing and collaboration was most important.
MARAM
- 92% of the specialist workforce had heard of the MARAM framework.
- 79% of the primary prevention workforce had heard of the MARAM framework
- 53% of the aggregate broader workforce had heard of the MARAM framework.
The three broader workforce sub-groups with the greatest awareness of the MARAM framework were maternal and child health (95% were aware); alcohol and drug services (86%); and housing and homelessness (80%); whilst ambulance services reported the lowest awareness (7%, see Table 7).
| Workforce | Aware of the MARAM framework (% Yes) | Organisation prescribed to align with the MARAM framework (% Yes) | I have a good understanding of my professional responsibilities under the MARAM framework (% Agree) | In identifying or assessing FV risk, I always use MARAM tools, including a structured professional judgement approach (% Agree) |
|---|---|---|---|---|
| Specialist family violence response (n=946-1,482) |
92% | 81% | 79% | 62% |
| Primary prevention (n=131-474) |
79% | 52% | 56% | 34% |
| Broader workforce aggregate (n=838-2,711 |
53% | 67% | 63% | 39% |
| Alcohol and Drug services (n=119-202) |
86% | 76% | 63% | 35% |
| Ambulance services (n=5-149) |
7% | 55% | Supressed (low sample size) | Supressed (low sample size) |
| Broader community services (n=613-1,401) |
68% | 73% | 61% | 36% |
| Children, Families and Child Protection (n=213-388) |
80% | 78% | 68% | 44% |
| Community Health Services (n=119-306) |
62% | 72% | 53% | 34% |
| Community Mental Health Services (n=71-192) |
61% | 68% | 50% | 24% |
| Court Services (n=19-105) |
50% | 49% | 54% | 37% |
| Disability Services (n=10-119) |
24% | 38% | 73% | 40% |
| Education (n=12-259) |
25% | 23% | 57% | 17% |
| Housing and Homelessness (n=89-167) |
80% | 72% | 54% | 30% |
| Justice (n=33-112) |
61% | 66% | 67% | 45% |
| Legal Services (n=4-58) |
57% | 24% | Supressed (low sample size) | Supressed (low sample size) |
| Maternal and Child Health (n=90-126) |
95% | 90% | 70% | 46% |
| Other Community Services (n=79-269) |
59% | 61% | 60% | 29% |
| Police (n=39-129) |
57% | 60% | 81% | 72% |
| Public health (n=68-523) |
27% | 58% | 53% | 31% |
| Settlement Services (n=8-31) |
48% | 67% | Supressed (low sample size) | Supressed (low sample size) |
| Youth Work (n=57-111) |
78% | 72% | 65% | 32% |
Training
All three workforces were asked to identify the family violence prevention and response topics that they had completed training in, and those they would like further training in. Table 8 illustrates the key findings, by workforce. The top three barriers to accessing further training / development are also shown below.
| Training completed | Helpfulness of completed training (% Helpful) | Training desired in future | Main barriers in accessing further training and development |
|---|---|---|---|
|
Specialist FV response(n=1,415) |
(n=921-1,013) |
(n=1,155) |
(n=1,457) |
|
Family violence risk assessment and risk management (CRAF) (73%) |
75% |
Working with people with disabilities (50%) |
Lack of time (52%) |
|
Identifying and screening family violence (69%) |
82% |
Sexual assault in family violence (48%) |
Cost of study (42%) |
|
Trauma-informed practice (67%) |
88% |
Working with adolescents (48%) |
Location of training facility (32%) |
|
Primary prevention(n=433) |
(n=209-248) |
(n=376) |
(n=461) |
|
Gender equity (59%) |
80% |
Working with Aboriginal communities(52%) |
Lack of time (57%) |
|
Foundation / introductory primary prevention of violence against women (58%) |
75% |
Multi-Agency Risk Assessment and Management (MARAM) (50%) |
Cost of study (42%) |
|
Recognising and responding to disclosures (50%) |
76% |
Managing backlash and resistance(49%) |
Location of training facility (32%) |
|
Broader workforce aggregate*(n=2,477) |
(n=955-1,024) |
(n=1,941) |
(n=2,603) |
|
Identifying and screening family violence (43%) |
67% |
Multi-Agency Risk Assessment and Management (MARAM) (59%) |
Lack of time (44%) |
|
Trauma-informed practice (42%) |
83%
|
Legal issues for family violence (49%)
|
Cost of study (35%)
|
| Family violence risk assessment and risk management (CRAF) (39%) | 62% | Working with perpetrators of family violence (48%) | Location of training facility (27%) |
Health and wellbeing
This chapter explores the health and wellbeing of the three workforces. The information in this chapter may be used to improve understanding of the health and wellbeing of the workforce as a whole, assist in identifying any specific areas of focus, and inform forward-looking strategies to support its workers.
Satisfaction with role
75% of the specialist family violence response workforce indicated that they were satisfied in their current role, and 66% felt that their work makes a significant difference to people affected by family violence.1
75% of the primary prevention workforce also reported being satisfied in their current role, and 45% felt that their work makes a significant difference to those affected by family violence.2
Workplace stressors
Work-related stress is an important consideration when exploring the health and wellbeing of staff, and there are various elements of an individual’s role that may contribute to such stress. Overall:
- 78% of the specialist family violence response workforce reported that they experienced at least moderate work-related stress, and 33% experienced high, very high or severe levels;
- 76% of the primary prevention workforce indicated that they experienced at least moderate work-related stress, and 31% experienced high, very high or severe levels; and
- 78% of the broader workforce (aggregate) experienced at least moderate work-related stress, and 32% experienced high, very high or severe levels.
Table 9 illustrates the top three causes of work-related stress amongst each workforce.
| Workforce | #1 Cause of workplace stress | #2 Cause of workplace stress | #3 Cause of workplace stress |
|---|---|---|---|
|
Specialist family violence response (n=482) |
High volume of work / high demands of their role (84%) | Poor management or organisational issues (48%) | Vicarious trauma (43%) |
|
Primary prevention (n=142) |
High volume of work / high demands of their role (76%) | Poor management or organisational issues (61%) | Staff turnover (41%) |
|
Broader workforce aggregate (n=790) |
High volume of work / high demands of their role (83%) | Poor management or organisational issues (43%) | Vicarious trauma (38%) |
*Percentages are based out of those who had experienced at least ‘high’ levels of work-related stress.
Across the various sub-groups within the broader workforce, most cited the same top three causes of workplace stress as the aggregate (see Table 9), though there were some differences to note:
- Education workers cited ‘external pressures’ as their third cause (in addition to high volume of work / demands and poor management or organisational issues).
- Maternal and child health and settlement services cited ‘staff turnover’ (after high volume of work / demands and poor management or organisational issues).
Support for negative encounters
Vicarious trauma amongst specialists
As outlined earlier, although high volume of work and poor management were the most cited causes of workplace stress, 27-43% of those who experienced at least high levels of stress across each workforce also mentioned vicarious trauma.
59% of the specialist family violence response workforce understood that their organisation had processes or policies and procedures in place to recognise and manage vicarious trauma.3
Of these individuals:
- 35% felt that these measures were very or extremely effective in assisting them to recognise that they are experiencing vicarious trauma4; and
- 31% felt that these measures were very or extremely effective in assisting them to manage vicarious trauma.5
Backlash / resistance as an issue amongst primary prevention and broader workforces
Similarly, given the unique type of work that the primary prevention and broader workforces undertake, backlash / resistance6 is a particularly important factor to consider when exploring workplace stress amongst these audiences.
22% of the primary prevention workforce reported that they often or always experience backlash or resistance in undertaking their work.7
Additionally:
- 64% reported that they have access to support if they encounter resistance or backlash in their work and 80% indicated that they have access to support if they encounter cases of family violence or disclosures in their work.8; and
- Of those who had access to such support, 55% felt it was very or extremely effective overall.9
Overall, just 9% of the aggregate broader workforce reported that they often or always experience backlash or resistance in undertaking their work.10 Results for each sub-group under the broader workforce are also presented in Table 10 below.
|
Broader workforce sub-group |
Experience backlash / resistance often or always |
Access to support - if encounter cases of FV or disclosures (% Yes) |
Access to support - if encounter resistance or backlash (% Yes) |
Support provided is very / extremely effective |
|---|---|---|---|---|
|
Alcohol and Drug services (n=153-188) |
10% |
95% |
56% |
61% |
|
Ambulance services (n=76-136) |
10% |
88% |
45% |
53% |
|
Broader community services (n=954-1,324) |
10% |
91% |
55% |
61% |
|
Children, Families and Child Protection (n=280-362) |
11% |
94% |
58% |
64% |
|
Community Health Services (n=211-292) |
9% |
93% |
52% |
61% |
|
Community Mental Health Services (n=124-184) |
11% |
88% |
46% |
60% |
|
Court Services (n=41-98) |
6% |
79% |
49% |
44% |
|
Disability Services (n=68-111) |
10% |
85% |
46% |
40% |
|
Education (n=155-244) |
10% |
87% |
53% |
52% |
|
Housing and Homelessness (n=115-160) |
9% |
91% |
55% |
63% |
|
Justice (n=45-95) |
14% |
82% |
46% |
42% |
|
Legal Services (n=49-81) |
14% |
88% |
55% |
61% |
|
Maternal and Child Health (n=101-115) |
4% |
97% |
56% |
61% |
|
Other Community Services (n=174-256) |
9% |
88% |
56% |
63% |
|
Public health (n=314-499) |
10% |
91% |
52% |
58% |
|
Settlement Services (n=33-45) |
7% |
86% |
52% |
52% |
| Youth Work (n=74-104) | 8% | 92% | 59% | 49% |
Note: Police were not asked this section of the survey.
Footnotes
- Q66. Overall, how satisfied are you in your current role in the specialist family violence response workforce? (n=1,406). Q67. How much difference do you think your work makes to people affected by family violence? (n=1,352)
- Q66. Overall, how satisfied are you in your current role in the primary prevention workforce? (n=442). Q67. How much difference do you think your work makes to people affected by family violence? (n397)
- Q58. Does your organisation have processes in place or policies and procedures to recognise and manage vicarious trauma? (n=1,436)
- Q59. Overall, how effective are these processes, policies and / or procedures in assisting you to recognise that you are experiencing vicarious trauma? (n=744)
- Q60. Overall, how effective are these processes, policies and / or procedures in assisting you to manage vicarious trauma? (n=731)
- Backlash and resistance refer to any form of resistance toward gender equality.
- Q61. In your role, how often do you experience resistance or backlash in undertaking your work? (n=454)
- Q63. Do you have access to support to assist you if you encounter cases of family violence or disclosures, or resistance or backlash in your work? (n=400)
- Q64. Overall, how effective is this support? (n=276)
- Q61. In your role, how often do you experience resistance or backlash in undertaking your work? (n=2,424)
Career and future intentions
This chapter outlines the key motivators for working in both the specialist family violence response and primary prevention workforces and explores the future plans / intentions of these groups. This information may be useful to inform recruitment and retention strategies.
Motivations in current role
As illustrated in Figure 4, the results illustrated that both the specialist family violence response and primary prevention workforces were highly motivated by a commitment to preventing / responding to family violence.
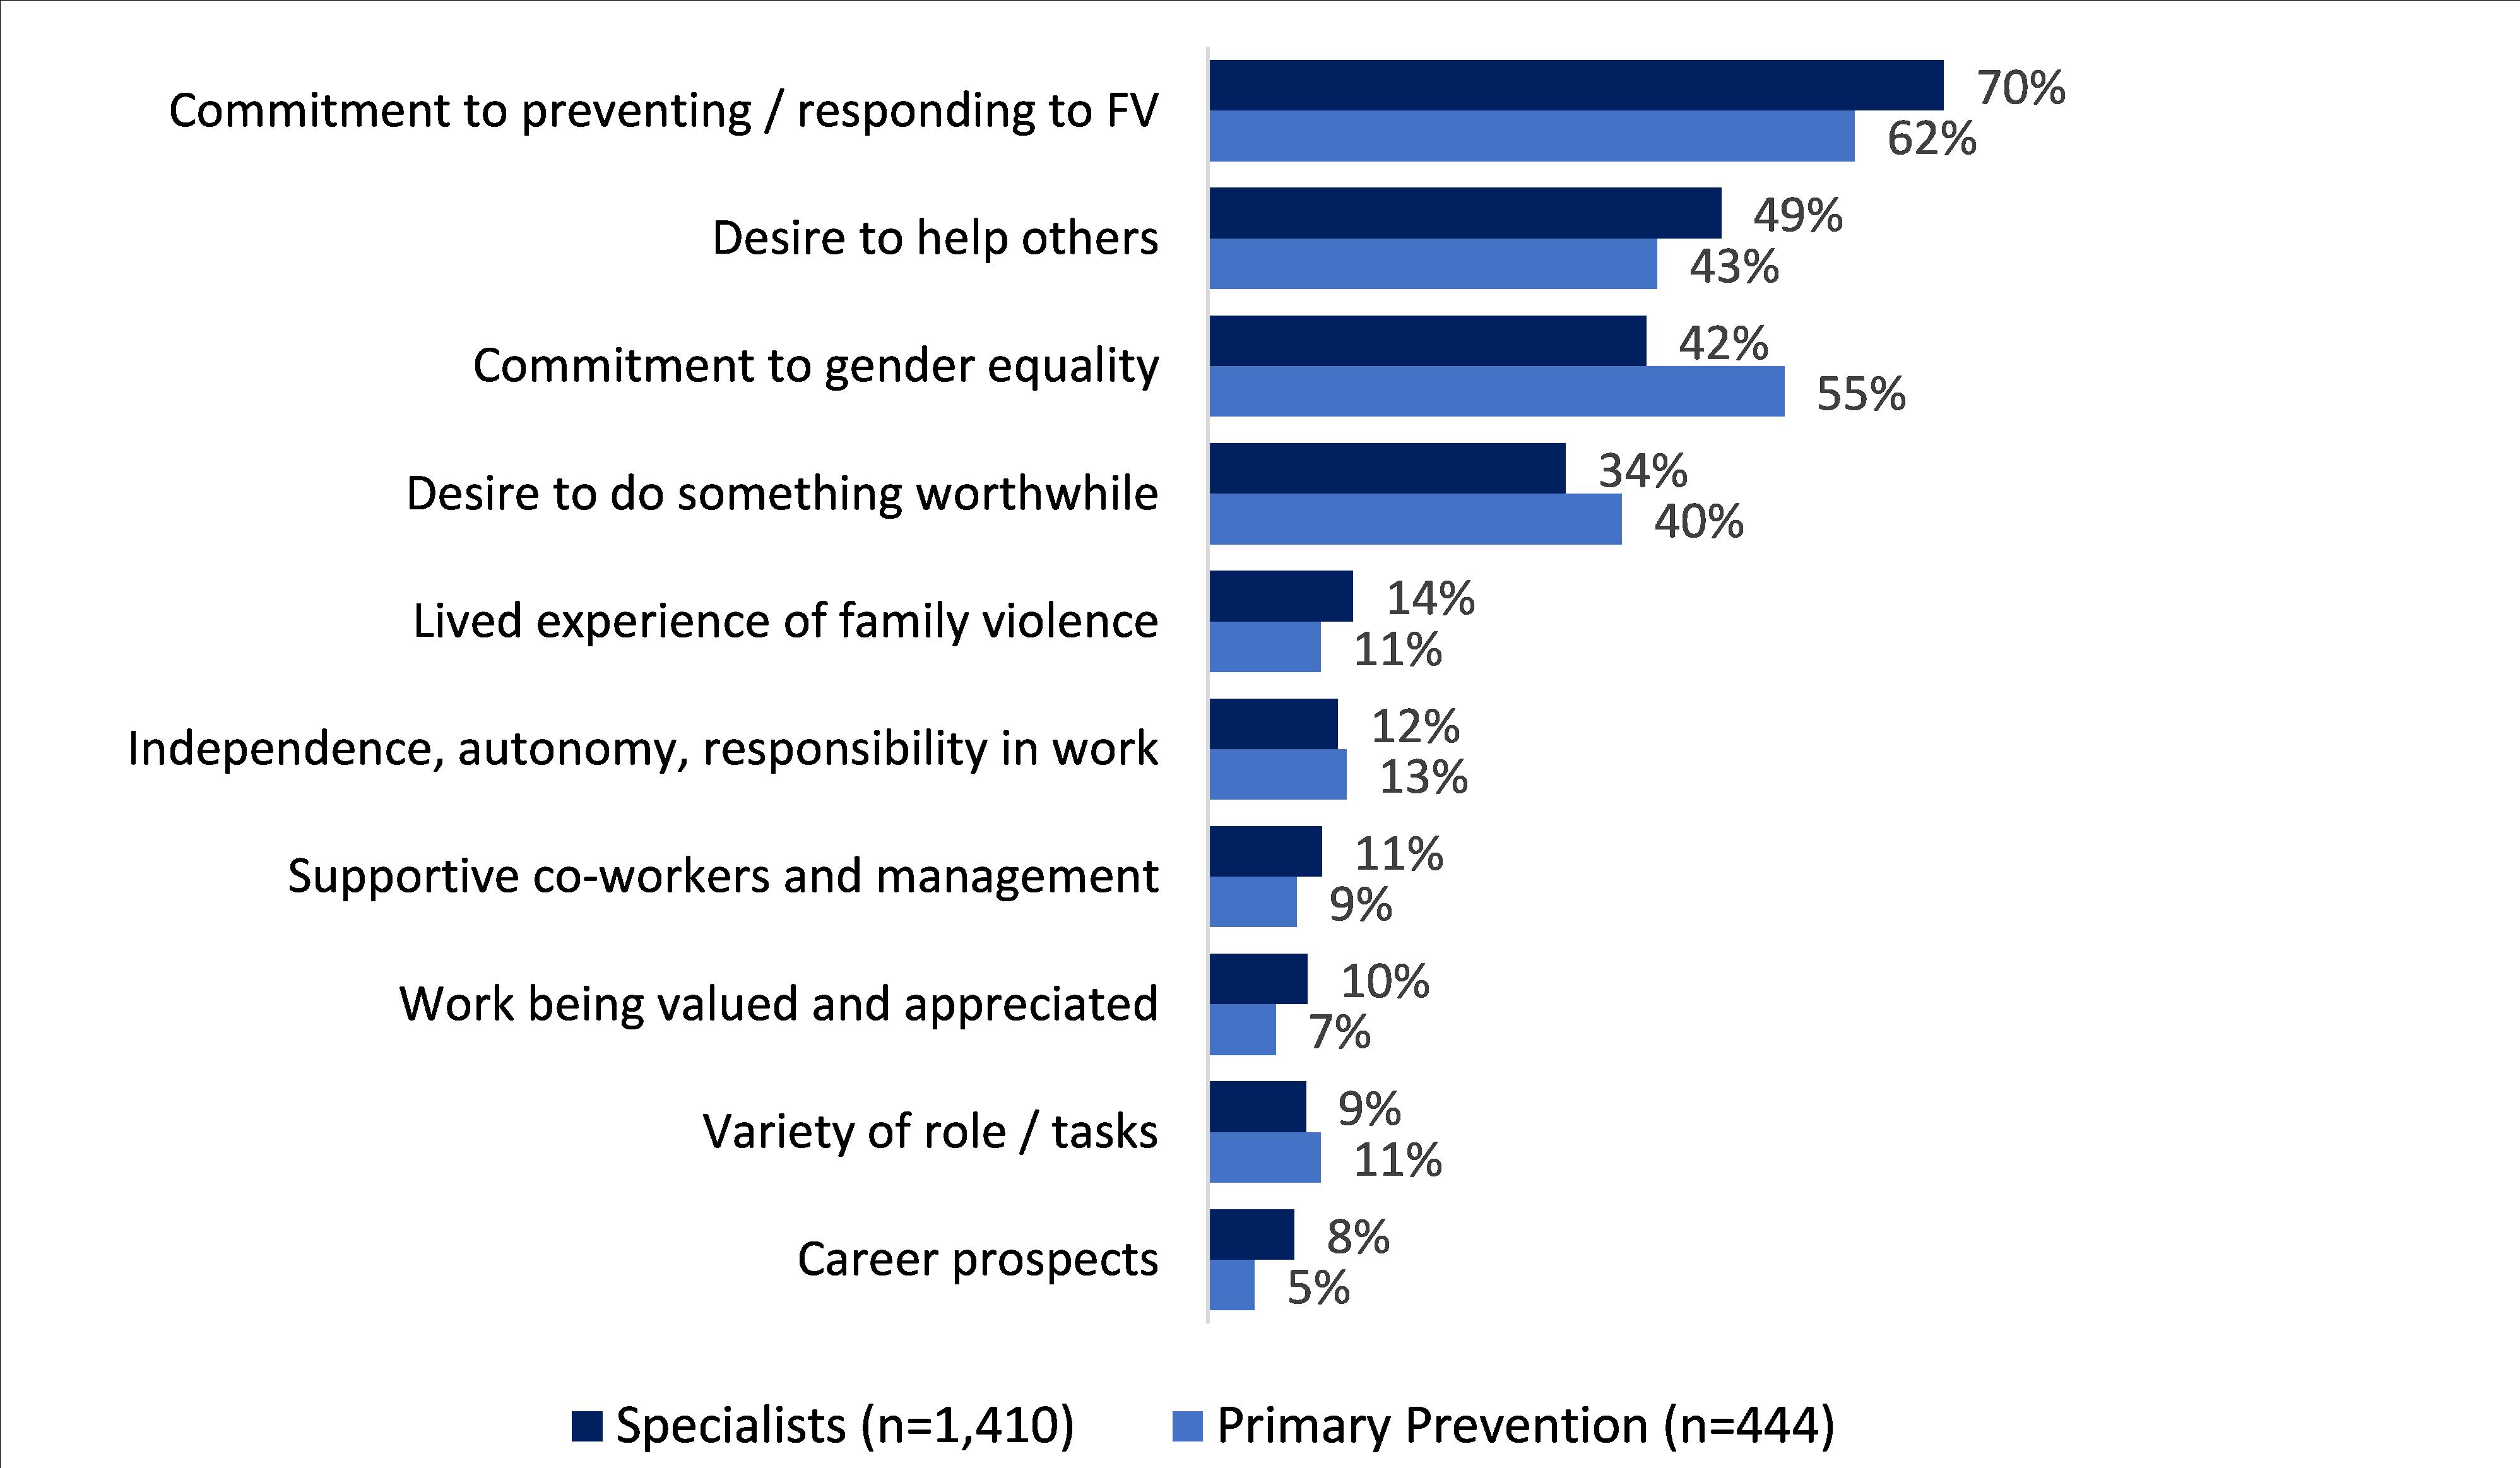
Respondents were also asked to comment on what they were doing immediately prior to commencing employment in their current role. The main responses from those working in the specialist and primary prevention workforces were that they were ‘working for another organisation or agency in the sector’ (41% and 35%), or ‘working in a related sector’ (23% and 26%).
Future intentions
Specialist Family Violence response
When asked about their future intentions, responses across the specialist and primary prevention workforces were broadly similar. Just over half (51%) of specialists did not have plans to leave their current role at this stage, whilst 40% did plan to leave their current role and 10% were unsure.1
Of those who did intend to leave their current role, 44% were planning to leave for another role within the specialist family violence response workforce. A similar proportion (40%) were planning to leave their current role for another role outside of this workforce.
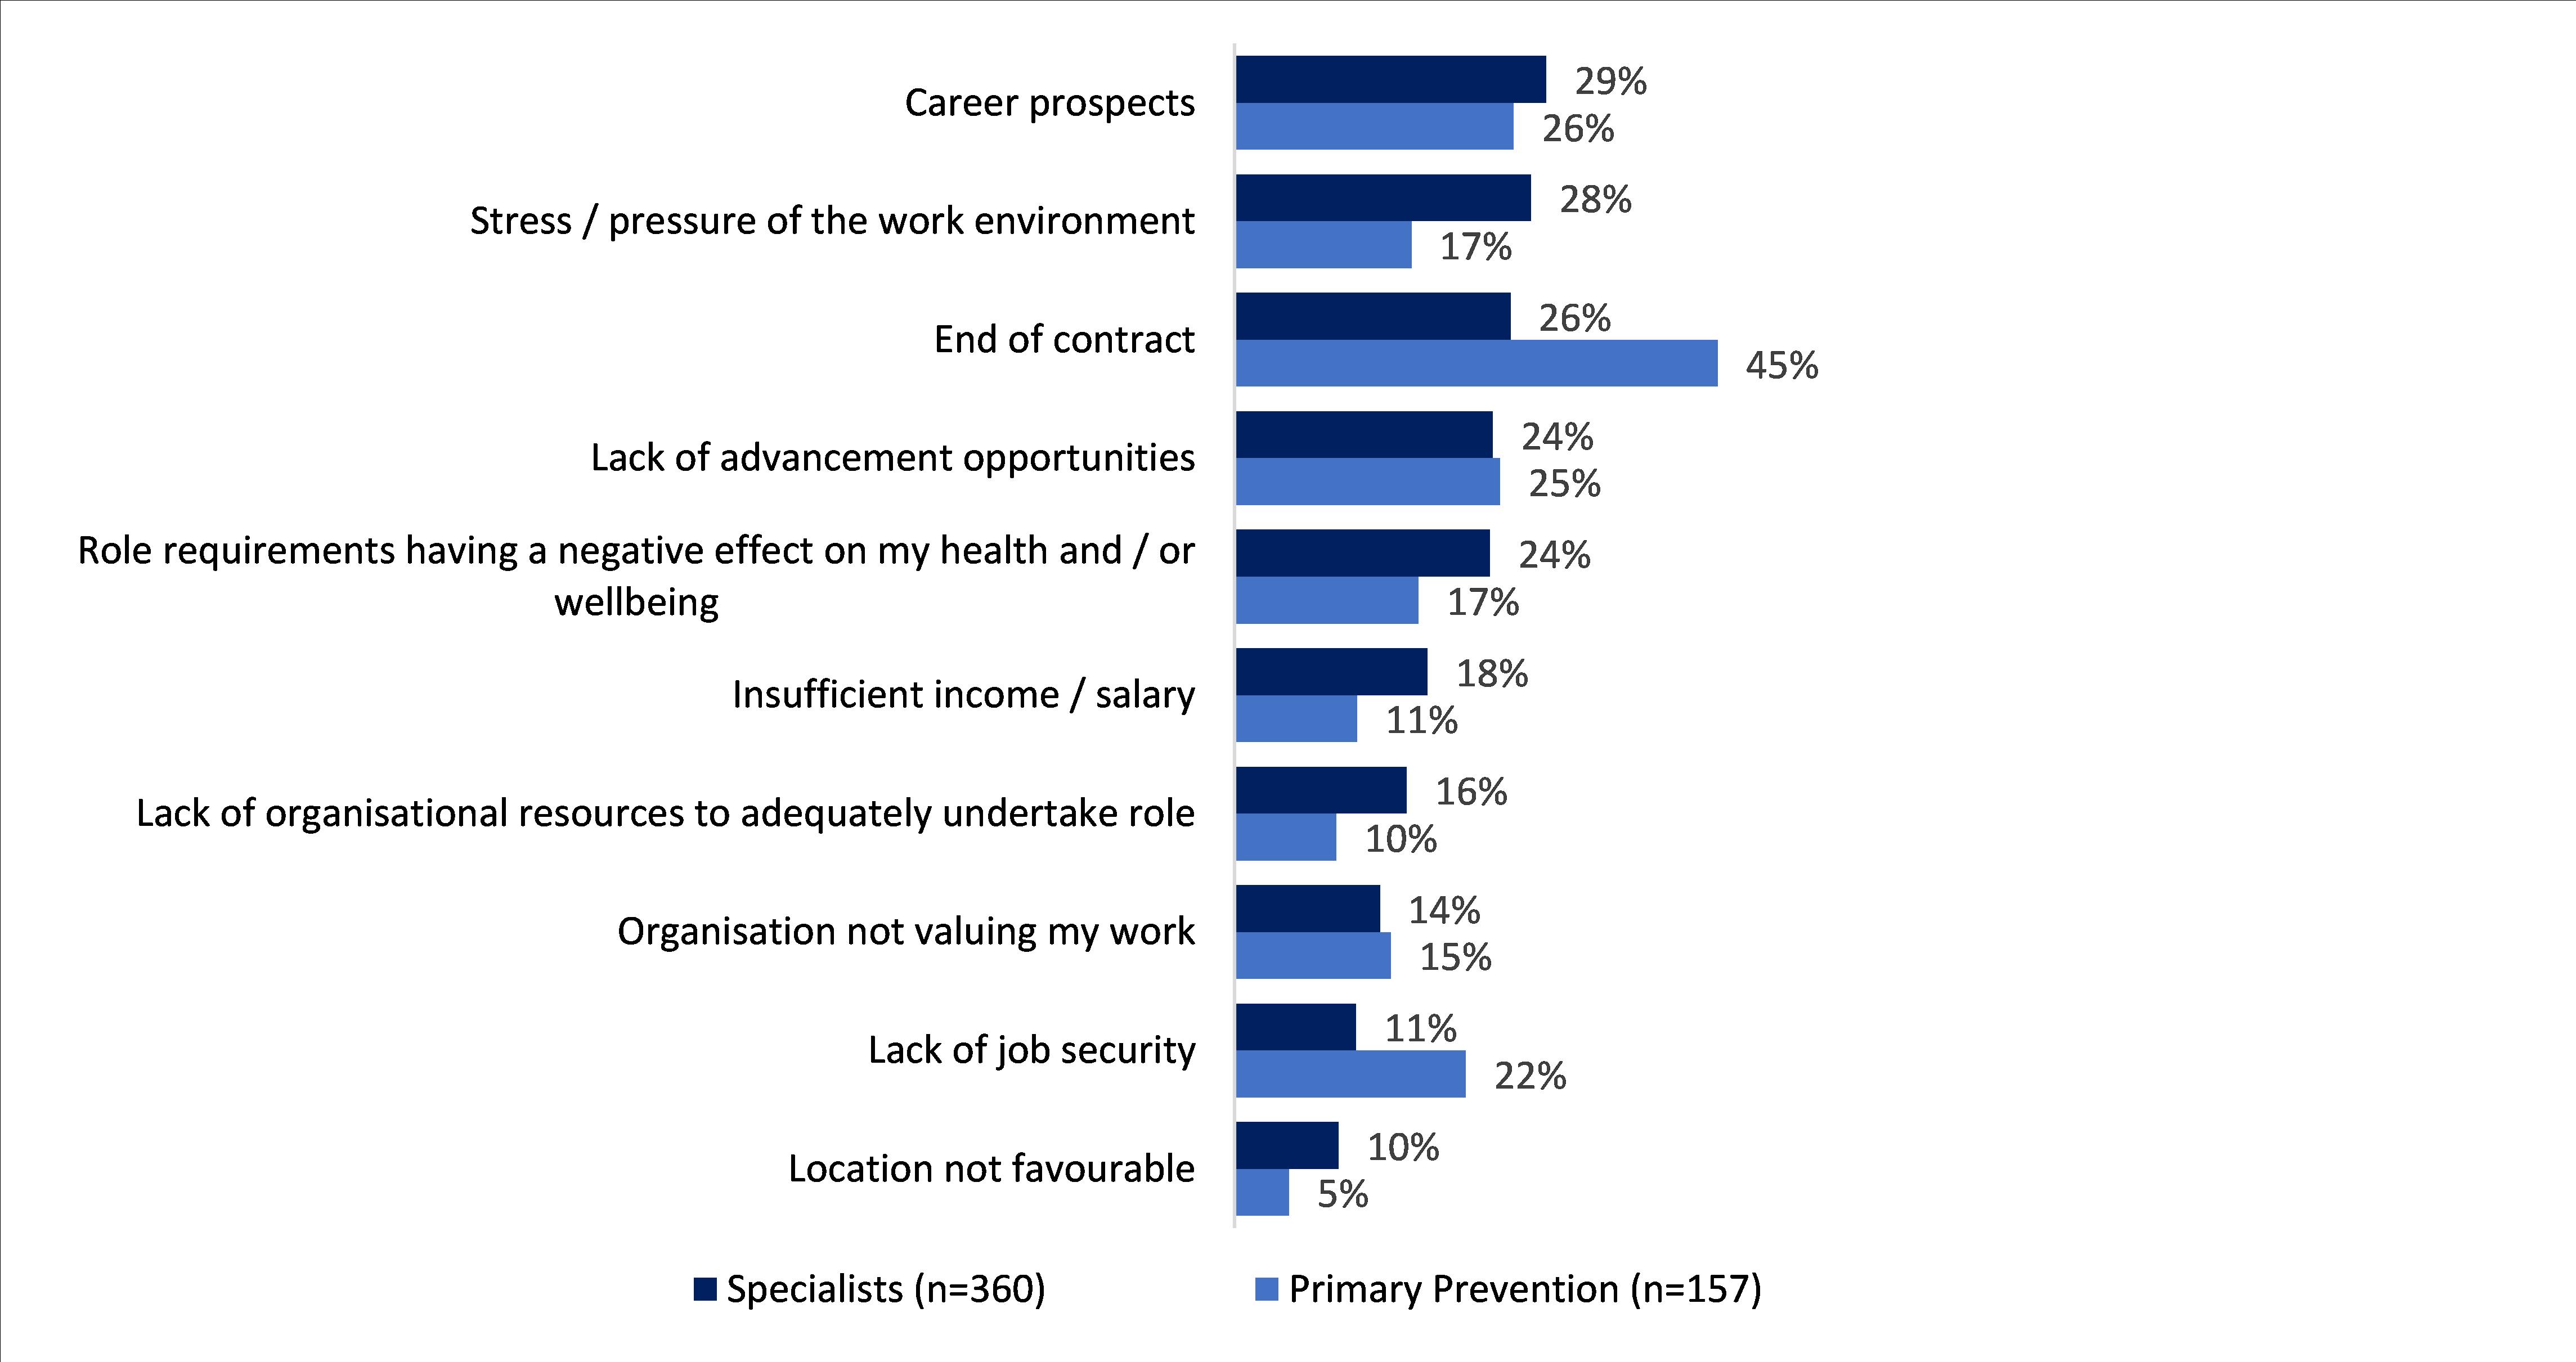
The main reasons that had driven specialists to consider leaving their role within the next 12 months included career prospects or lack of advancement opportunities (24%-29%); and stress / pressure or the role having a negative effect on respondents’ health and wellbeing (24%-28%). Furthermore, 26% also cited an end of contract (see Figure 5).
Primary Prevention practitioners
Amongst Primary Prevention practitioners, 43% did not have plans to leave their current role at this stage, whilst 48% did have plans to leave their current role, and 9% were unsure.2
Of those who intended to leave their current role, 31% planned to leave their current role for another role within the family violence primary prevention workforce and 41% planned to leave their current role for another role outside of the family violence primary prevention workforce.
The main reason cited by this cohort for intending to leave their role in the next 12 months was due to an end of contract (45% - see Figure 5), though 25-26% also cited career prospects and a lack of advancement opportunities.
Furthermore, most specialists indicated that they would consider taking on a role in the primary prevention of family violence workforce in the future (81%), and just over half of those working in primary prevention reported that they would be open to a role in the specialist family violence response workforce (53%). This suggests that there is potentially an opportunity for shared resources across the specialist family violence response and primary prevention workforces. Table 11 below presents the education levels of those who participated, to assist in broadly understanding the backgrounds of each workforce and future planning.
| Specialist family violence workforce (n=1,409) | Primary prevention n=448) |
Broader workforce aggregate (n=2,587) |
|
|---|---|---|---|
|
Year 11 or below |
5% |
5% |
9% |
|
Year 12 |
22% |
22% |
24% |
|
Certificate I |
0% | 0% |
1% |
| Certificate II | 1% | 0% |
2% |
| Certificate III | 4% | 2% |
6% |
| Certificate IV | 11% |
12% |
14% |
| Diploma or Advanced Diploma | 25% | 19% | 27% |
| Bachelor's Degree | 49% | 51% | 47% |
| Graduate Diploma or Graduate Certificate | 23% | 20% | 21% |
| Postgraduate Degree | 32% | 38% |
25% |
| PhD | 2% | 3% | 1% |
| Prefer not to say | 1% | 1% | 1% |
Footnotes
- Q71. Thinking about your future, do you have plans to leave your current role? (n=1,409)
- Q71. Thinking about your future, do you have plans to leave your current role? (n=446)
- Q74. Which of the following have you completed?