- Published by:
- Department of Energy, Environment and Climate Action
- Date:
- 18 Jan 2023
Welcome to Victoria’s Bushfire Risk Management Report 2021–22.
This is the 10th annual report on Victoria’s fuel management program, but the first to be delivered by the newly established Office of Bushfire Risk Management (OBRM) and to encompass reporting on bushfire risk reduction activities conducted across public and private land.
View just the facts
Foreword from the Head of the Office of Bushfire Risk Management
Victoria’s bushfire management sector is committed to leading the world in bushfire risk management.
It uses the best-available knowledge to inform decisions so that our collective efforts have the greatest impact in reducing bushfire risk and protecting Victorians and the values our community holds dear.
This includes protecting human life, private property, the natural environment, cultural heritage, critical infrastructure and industries that contribute to the livelihoods of Victorians.
While fire is a natural part of many Victorian environments, climate change is increasing the severity and frequency of bushfires.
The 2019–20 bushfires were a tangible reminder that Victoria’s climate is rapidly changing, and we need to continue to improve and adapt our approaches to keep communities safe and maintain the resilience of our natural ecosystems.
The sector strives to continuously learn and improve the way we manage bushfire risk.
We know our land and fire management practices need to respond to current and future challenges, including climate change, population growth and demographic changes.
Government inquiries after the 2019–20 bushfire season made recommendations about key opportunities to improve the way the sector manages bushfire risk.
This – together with significant new investment by the Victorian Government – has shaped a significant program of reform currently underway to drive improvements in our approach and deliver better outcomes for Victorians.
Establishment of the Office of Bushfire Risk Management
Central to these reforms was the establishment of the Office of Bushfire Risk Management (OBRM) within the Department of Energy, Environment and Climate Action to lead and coordinate the implementation of evidence-based bushfire risk management policy, practice, assurance and reporting across all public and private land in Victoria.
OBRM is reviewing and identifying opportunities to improve Victoria’s end-to-end framework for bushfire risk management, ensuring the sector is working effectively together to achieve shared outcomes and strengthening credibility and assurance over the sector’s work.
OBRM works closely with land and fire management agencies across the state, although responsibility for on-ground delivery remains with the respective agencies.
One of the roles of OBRM is to strengthen monitoring, evaluation and reporting on the management of bushfire risk.
From this year, this report begins its transition from being a Forest Fire Management Victoria (FFMVic) publication focussed on fuel management in national parks, State forests and protected public land, to being an OBRM publication that reports on a broad range of interventions undertaken to manage bushfire risk across all agencies and all land tenures.
Victoria's Bushfire Risk Management Report 2021–22
As a first step, this year’s report includes information about the Country Fire Authority’s (CFA) fuel management program and the broad fuel management program delivered by FFMVic, which includes not only planned burning, but other critically important actions such as construction and maintenance of strategic fuel breaks, and clearing of hazardous trees and storm debris following the widespread storm impacts in 2021.
Victoria’s approach to bushfire risk management is underpinned by shared responsibility and brings together Traditional Owners, land and fire agencies, councils, landowners and the community to deliver tailored bushfire risk reduction approaches that draw on our collective knowledge and strengths and reflect local needs.
These partnerships continue to be vital in enabling effective on-ground delivery, regardless of challenging circumstances such as COVID-19, and storm and flood recovery.
In addition to pursuing strong partnerships with Traditional Owners to manage bushfire risk, the Victorian Government and its land and fire management agencies are deeply committed to supporting self-determination, including supporting Traditional Owners to implement the Traditional Owner Cultural Fire Strategy and lead the reintroduction of cultural fire to heal Country.
I am pleased to present Victoria’s Bushfire Risk Management Report for the year ending 30 June 2022.

Georgie Foster
Head of the Victorian Office of Bushfire Risk Management
Introduction
Welcome to Victoria’s Bushfire Risk Management Report 2021–22. This is the 10th annual report on Victoria’s fuel management program, but the first to be delivered by the newly established Office of Bushfire Risk Management (OBRM) and to encompass reporting on bushfire risk reduction activities conducted across public and private land.
The Victorian Government recognises the significant threat that climate change poses to communities, the economy and the environment through more frequent and severe bushfire emergencies.
Through the 2021–22 State budget, the Victorian Government allocated an unprecedented $517 million to continue advancing Victoria’s approach to managing bushfire risk under a changing climate.
This included funding for firefighters to deliver an enhanced fuel management program and expand Victoria’s network of strategic fuel breaks, as well as funding to upgrade the digital radio network for Forest Fire Management Victoria (FFMVic) staff and Country Fire Authority (CFA) members to support safe and effective firefighting.
A further $96 million investment was provided through the 2022–23 State budget to strengthen preparedness arrangements, replace and renew critical fire and emergency assets, and fund aerial firefighting that is critical for supporting safe and effective bushfire suppression.
In addition, $28.9 million has recently been committed to bolstering the FFMVic forest firefighting workforce by transitioning 50 seasonal contract forest firefighters into full-time roles.
Victoria's risk-based approach to bushfire management
Victoria’s risk-based approach to bushfire management means that the resources invested in bushfire management are directed where they will have the greatest impact in safeguarding human life, property and the environment.
This approach has been repeatedly reviewed by experts and inquiries, and consistently found to be leading practice both nationally and internationally.
Bushfire risk is managed through a wide range of interventions including planned burning, mechanical fuel treatment, construction and maintenance of strategic fuel breaks, community education, compliance patrols, and aggressive first attack to bring bushfires rapidly under control while they are still small.
Importantly, this approach is underpinned by shared responsibility and brings together land and fire agencies, councils, landowners and the community through the Safer Together program to work together to manage bushfire risk.
Safer Together achieves this through investment in research and modelling to continuously improve the evidence base that informs a risk-based approach and strengthen engagement between land and fire agencies and communities to have meaningful conversations and identify more mutually acceptable approaches to risk reduction.
In response to the Inspector-General for Emergency Management’s (IGEM) Phase 1 Inquiry into the 2019-20 Victorian fire season, in July 2021 the Victorian Government established the Office of Bushfire Risk Management (OBRM) to lead a coordinated approach to evidence-based bushfire risk management policy, practice, assurance, and reporting across all public and private land in Victoria.
Changes to public reporting on bushfire risk management
This year’s Victoria’s Bushfire Risk Management Report 2021–22 marks the start of a transition to public reporting on the performance of Victoria’s bushfire risk management program across all agencies and tenures.
In addition to information on FFMVic’s fuel management program, this report also includes information on the CFA fuel management program.
Fuel management across Victoria's public and private land
Fuel management is a key strategy for reducing bushfire risk and one of the key activities to protect communities from bushfires. Fuel management includes:
- planned burning (lighting and managing planned fires in the landscape)
- mechanical treatments, such as mowing, slashing and mulching, and
- other non-burn treatments like spraying.
It makes suppression more achievable and safer for firefighters and helps to reduce the impact of bushfires on communities and the environment.
FFMVic and CFA work closely with other sector partners and the community to plan and deliver fuel management across public and private land in Victoria to manage bushfire risk. FFMVic is responsible for managing bushfire risk in State forests, national parks and other protected public lands in Victoria, and CFA supports the delivery of fire prevention works on private land.
Agencies in Victoria take a year-round approach to reducing bushfire risk. All year, the sector:
- plans and delivers planned burning and non-burn fuel treatments
- constructs and maintains strategic fuel breaks
- maintains and improves strategic fire access road networks
- undertakes other bushfire risk-reduction activities, such as using predictive weather and fire behaviour advice to strategically position air and ground resources on days when bushfire risk is increased, and
- engages with the community to support placed-based programs to reduce bushfire risk at the local level and to increase community understanding of bushfire risk.
To deliver these fuel management activities FFMVic and the CFA undertake joint planning at both the strategic and local levels.
The fuel management strategy for each region is outlined in each of Victoria’s 6 regional bushfire management strategies, reflected in fire management zoning on public land, and translated locally through the Joint Fuel Management Program (JFMP) which sets out the prioritised annual schedule of fuel management works.
While the majority of the state’s annual fuel management program focuses on reducing the risk of bushfires to human life and property, the JFMP also includes burns which are undertaken for ecological purposes. The JFMP also includes cultural burns nominated and led by Traditional Owners.
While this year’s report largely focuses on fuel management activities, future editions will be expanded to cover other bushfire risk management activities. The outcomes of other agencies' bushfire risk management activities will also continue to be incorporated over time.
Reporting scale
This report provides information on fuel management delivery and outcomes at both the statewide and regional scale. At the statewide scale, this report provides information on performance against the statewide target to maintain fuel-driven bushfire risk at or below 70% of maximum levels.
The report also provides information on performance against long-term regional planning targets derived from the statewide target. Regional long-term planning targets are designed to ensure the planning and delivery of a bushfire risk reduction program across the State's six regions that collectively delivers on the Government's statewide target to maintain fuel-driven bushfire risk at or below 70% through fuel management on public land.
Data and model output improvements
Victoria’s bushfire management sector invests in and uses the best-available evidence-based models and data to calculate the results presented in the bushfire risk management report each year.
Models for metrics, such as fuel-driven bushfire risk or reported costs, are updated regularly when technology improves, better data becomes available, the research program provides new knowledge or mapping accuracy improves.
For example, improvements to mapping a specific bushfire area may result in a recalculation of risk measures, or improvements in the ways investment is calculated on fuel management and non-fuel management activities, may change cost estimates from year to year.
Appendix A explains these specific changes.
Improving the data and science behind decisions happens continuously and is reflected through updates to reporting. Consequently, direct comparisons between this report and past or future reports can not necessarily be made. For the most accurate view of current and historic figures, always consult the most recent bushfire risk management report.
Overview of the 2021–22 fire season
Bushfires are a natural part of the Victorian environment and although fire agencies prepare for and respond rapidly to suppress bushfires with aggressive first attack, it is often not possible to control every bushfire at a small size.
The area burnt during bushfires can contribute to a reduction in fuel-driven bushfire risk for the specific areas affected. This can therefore contribute to a reduction in the state and respective regional overall risk profiles, which take into account the areas burnt by bushfires.
The 2021–22 fire season had a lower-than-average number of fires when compared to the previous 20 years, due to the wetter-than-usual conditions associated with a La Niña weather pattern.
During the 2021–22 bushfire season, FFMVic crews:
- attended 1,066 fires impacting 12,589 hectares, of which about 59% were unattended campfires
- contained 97.5% of fires at the first attack, and
- limited the spread of 92.7% of fires to less than 5 hectares in area.
During the 2021–22 bushfire season, CFA crews:
- attended 2,875 fires impacting 18,221 hectares, of which 20% were natural ignition events, and
- limited the spread of 93% of fires to less than 5 hectares in area.
Performance summary
Fuel management
Forest Fire Management Victoria performance summary
Forest Fire Management Victoria's (FFMVic) fuel management target is to maintain fuel-driven bushfire risk at or below 70% of Victoria’s potential maximum level through fuel management in State forests, national parks, and other protected public lands.
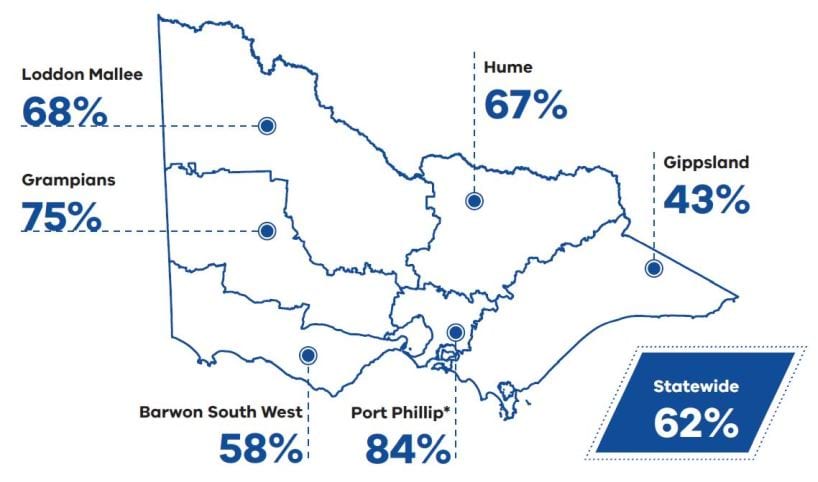
Statewide fuel-driven bushfire risk on 30 June 2022 was 62%, which achieves the target (Table 1). This continues the downward trajectory from 63% in 2020–21 and 64% in 2019–20.
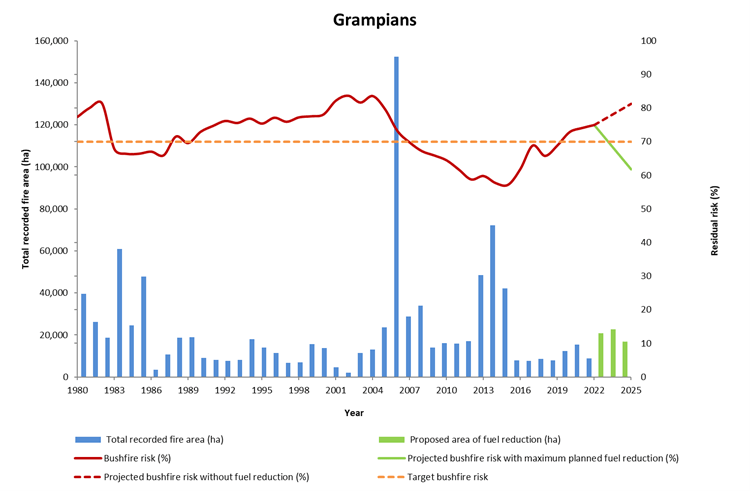
The fuel-driven bushfire risk level in 5 out of 6 regions on 30 June 2022 was below the respective long-term regional planning targets. However, the fuel-driven bushfire risk for the Grampians region was 75% which is 5 percentage points above the long-term regional planning target of 70%.
Delivery of planned burns to reduce fuel-driven bushfire risk in the Grampians region in 2021–22 was impacted by the significant storm event that impacted the Wombat State Forest in June 2021.
This was due to the need to prioritise emergency works to reopen the road network and undertake considerable additional preparation works for burns in the Midlands District prior to ignition.
FFMVic’s bushfire risk reduction program will need to focus on reducing fuel-driven bushfire risk in the Grampians region back to target levels, subject to other statewide priorities and suitable weather conditions.
Table 1. Budget Paper 3 Service Delivery Results, 2021-22

Risk analysis
Every year, FFMVic undertakes a detailed risk analysis to determine preparedness levels for bushfire suppression which determines the number and location of firefighters, aircraft and plant and equipment positioned in each district across the State.
In undertaking this analysis, FFMVic takes into consideration the fuel-driven bushfire risk levels, the season outlook, and local conditions. The level of fuel-driven bushfire risk in the Grampians region will inform this analysis.
Communities always have an important role to play in managing bushfire risk.
Communities in the Grampians region and other parts of the State can reduce their bushfire risk by preparing and practising their fire plans, abiding by relevant laws and regulations to prevent bushfires from starting, listening out for community warnings, and evacuating as advised.
The FFMVic fuel management program delivered 77,927 hectares of fuel reduction, including:
- 264 planned burns completed over 62,260 hectares, with significant burns to reduce fuel-driven bushfire risk in places like Narbethong, Cabbage Tree, Moggs Creek and the Wombat Forest
- mechanical fuel treatments completed over 15,667 hectares
- 741 kilometres of strategic fuel breaks built or upgraded across the state, and
- 6,696 kilometres of public land roads were cleared of storm debris.
Strategic fuel breaks
Strengthening and expanding Victoria’s network of strategic fuel breaks is a key strategy for making it easier, faster, and safer for firefighters to suppress bushfires and complements the planned burning and mechanical treatment programs. In 2021–22, FFMVic continued to deliver on the Victorian Government’s commitment to build and upgrade 1,447 kilometres of strategic fuel breaks and is due to complete this work in 2023.
FFMVic built or upgraded 741 kilometres of strategic fuel breaks in 2021–22, short of its target of 963 kilometres. Performance is below target due to some works having been brought forward and undertaken at the end of 2020–21, seasonal factors that delayed some works commencing in 2021–22, and COVID-19 impacts on contractor availability.
Victoria experienced significant storm and flood events in 2021. In some areas, the volume of fallen trees and debris increased fuel-driven bushfire risk, and hazardous trees created safety risks.
The clearing of storm debris from 6,696 kilometres of public land roads ensures that fire crews can safely access the forest to rapidly suppress bushfires and undertake planned burning and other works to reduce risk.
Joint Fuel Management Plans were completed in October 2021, one month after the target deadline of September 2021, due to additional time required to finalise fire history spatial data.
Country Fire Authority performance summary
The Country Fire Authority (CFA) fuel management program delivered 171 planned burns and 47 non-burn fuel treatments totalling 3,611 hectares, across the five CFA regions. In the west and southwest of the state, this included 494 kilometres of burning along road and rail corridors to provide safer egress. Many of these were supported by the CFA’s Planned Burn Task Force with members from across the state.
Ecosystem resilience
To understand the effects of both bushfires and planned burning on the environment, FFMVic measures and monitors the timing and number of fires in different types of vegetation.
Tolerable fire intervals across the state
The time taken for vegetation types to reach reproductive maturity following the fire is referred to as the Tolerable Fire Interval (TFI).
There have been some areas of improvement in the TFI status of vegetation on public land across Victoria since the 2020-21 report. There were 71,750 fewer hectares of vegetation below minimum TFI, which is now at 55% of Victoria’s public land estate, while the area within TFI increased to 23%.
Growth stage structure across the state
FFMVic measures and tracks the distribution of the age classes of different types of vegetation - referred to as the Growth Stage Structure (GSS) - across the landscape, to ensure an optimal mix of plant developmental stages is maintained.
The proportion of vegetation on public land in the mature and adolescent growth stages increased while the proportion in the juvenile stage decreased. The area of vegetation in the oldest growth stage remained the same.
Traditional Owner cultural burns
In 2021–22, Traditional Owners led the delivery of 14 cultural burns.
5 Traditional Owner groups led these burns across three regions (Loddon Mallee, Grampians, and Barwon South West) with planning, delivery, and post-fire management support from FFMVic and the CFA.
Through the support of a Cultural Fire Grants Program for Traditional Owners, it is projected that the number of cultural burns delivered throughout the state will increase in the coming years.
Statewide outcomes and delivery
Statewide outcomes and delivery in 2021–22
- Bushfire risk was modelled at 62%, well below the 70% state target.
- Forest Fire Management Victoria (FFMVic) and the Country Fire Authority (CFA) completed 435 planned burns across 65,480 hectares.
- FFMVic and CFA used mechanical treatments, such as slashing and mowing, to treat a further 16,058 hectares.
- FFMVic and the CFA delivered 32 cross-tenure burns to reduce risk across both public and private land.
- FFMVic built or upgraded 741 km of strategic fuel breaks.
- FFMVic invested $151 million on reducing bushfire risk.
- 23% of vegetation on public land was within tolerable fire interval.
- 37% of vegetation on public land was in the mature or old growth stages.
- 14 Traditional owner-led cultural burns were supported by FFMVic and CFA.
View Infographic
Joint Fuel Management Program
The Joint Fuel Management Program is a statewide program that manages bushfire fuels on public and private land over a three-year timeframe. The program integrates a risk-based bushfire management approach that the sector works within and shares personnel, resources, vehicles, and other equipment to maximise the delivery of priority fuel management activities.
FFMVic and CFA staff have developed the program in consultation with local councils, the viticulture and tourism industries, beekeepers, flora and fauna specialists, and drawing on knowledge from local communities including Traditional Owners, key stakeholders, local community leaders and other interested parties.
Bushfire risk
In Victoria, the landscape, climate and dispersed communities mean that there will always be a need to live with the risk of bushfires.
Therefore, it is necessary to understand what creates bushfire risk, where it exists in the environment and what the government, communities and individuals can do to reduce the likelihood and impact of bushfires.
Bushfire risk refers to the likelihood and consequence of something being impacted by a bushfire. It includes the likelihood of a bushfire starting, growing and spreading across a landscape, and the likelihood of things being in the path of the fire (such as houses, farms, roads, the natural environment and people).
Victoria is particularly susceptible to large and intense bushfires that can spread up to 30 kilometres or more across landscapes due to Victoria's terrain, naturally flammable vegetation and frequent exposure to hot, dry and windy weather.
Bushfire risk is affected by factors including the weather, the type and condition of fuels in the location and its topography, the location of people and assets, and the ability to prevent fires from igniting and to suppress them once they ignite.
Fuel-driven bushfire risk is the component of bushfire risk that is attributable to bushfire fuels, that is, vegetation that influences fire behaviour, such as the speed and intensity of a bushfire.
Fuel (vegetation) is a key element of fire behaviour and therefore is a major component of overall bushfire risk.
However, it is not a full measure of bushfire risk, because fuel is not the only factor that affects fire behaviour, or the likelihood and consequence of bushfires impacting people and the things they care about.
In general, the influence of fuel on fire behaviour decreases as fire weather conditions become more severe.
The sector models (using a computer program called Phoenix RapidFire) what impact fuel management activities have on reducing fuel-driven bushfire risk to inform fuel management planning and performance evaluation.
This impact is calculated and expressed as the percentage of fuel-driven bushfire risk ‘left over’ after bushfire fuels have been reduced, either through fuel management activities or bushfires (noting that currently, this calculation can only consider the contribution of planned burning and not non-burn fuel treatments such as slashing and mowing).
This approach focuses on the role that planned burns have in moderating the severity of bushfires at large scales and the consequential likely reduction in impacts.
In previous years’ reports, fuel-driven bushfire risk was referred to as residual risk.
Changes to reported fuel-driven bushfire risk
Victoria’s bushfire management sector continually works to improve the data and science that inform its decisions. As technology improves, better data becomes available for mapping accuracy improves and therefore the models improve. As such our metrics, such as fuel-driven bushfire risk or ecosystem metrics, are recalculated.
Each year, updates are made to this report to respond to these improvements - ensuring the best-available models and data inform public reporting. Readers should compare this report and past and future reports in that context. For the most accurate view of current and historical figures, you should always consult the most recent bushfire risk management report.
This year’s report includes more accurate results from those reported in 2020–21 as improvements were made to both fire history data and the Phoenix RapidFire bushfire simulation software - leading to re-calculation of fuel-driven bushfire risk across multiple years. Further details of these changes, including comparisons with historic figures, are provided in Appendix 1.
In this year’s bushfire risk management report, fuel management activities conducted by the CFA have also been included in the risk calculations. In coming years, advances in modelling and changes to the approach in accounting for contributions will enable the sector to report on how a broader range of prevention, preparedness and response activities – including mechanical fuel treatment – have contributed to reducing the risk of bushfires.
Statewide fuel-driven bushfire risk
FFMVic’s target is to maintain statewide fuel-driven bushfire risk at or below 70% of Victoria’s potential maximum levels, through fuel management on public land. The ‘maximum risk’ is calculated as the risk that would be present across the state under catastrophic bushfire conditions and if no fuel reduction activities had been undertaken and no bushfires had impacted the landscape (i.e. fuel hazard is at its maximum level possible). The calculated fuel-driven bushfire risk is the percentage of risk remaining, relative to the potential maximum risk (set at 100%), following fuel management and/or bushfire.
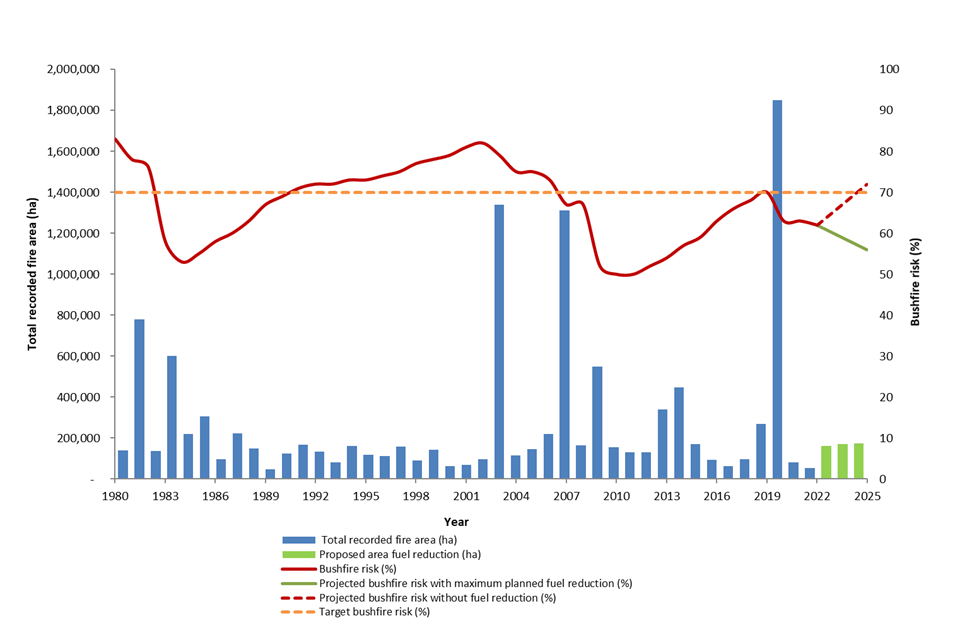
Figure 1 shows the profile of Victoria’s fuel-driven bushfire risk from 1980–2022, and its forecast risk to 2025. It shows how fuel-driven bushfire risk has and is projected to change over time, based on naturally occurring bushfires that planned fuel management activities.
This information is used to predict how future planned burning will reduce fuel-driven bushfire risk and to compare the effectiveness of different bushfire risk reduction strategies.
Figure 1: Fuel-driven bushfire risk profile, Victoria, 1980-2025. Data aligns with financial year.

Figure 1 shows the statewide fuel-driven bushfire risk:
- was 62% on 30 June 2022, down from a projected level of 65% in the absence of bushfires and fuel management
- was 1 percentage point lower than the 63% reported at the end of 2020–21, and
- decreased primarily because of planned burns offsetting the regrowth in fuels, with the sector maximising its fuel management program during spring 2021 and autumn 2022.
Re-accumulating fuel in Victoria’s forests can quickly increase fuel-driven bushfire risk if it is not properly managed through regular risk reduction activities. As Figure 1 shows, if the Joint Fuel Management Program (JFMP) is implemented in full (the ‘projected bushfire risk with maximum planned fuel reduction’ line), and there is little bushfire activity, modelling indicates bushfire risk will be 56% by 2025.
In the absence of fire (from planned burning or bushfires) the modelling indicates that bushfire risk is likely to rise to 72% over the next three years. The planned burning program will continue to be supported by an enhanced mechanical fuel treatment program, including treating areas in high-risk locations that are historically complex or difficult to treat with planned burning.
Relative contribution to risk reduction made by planned burning and bushfires
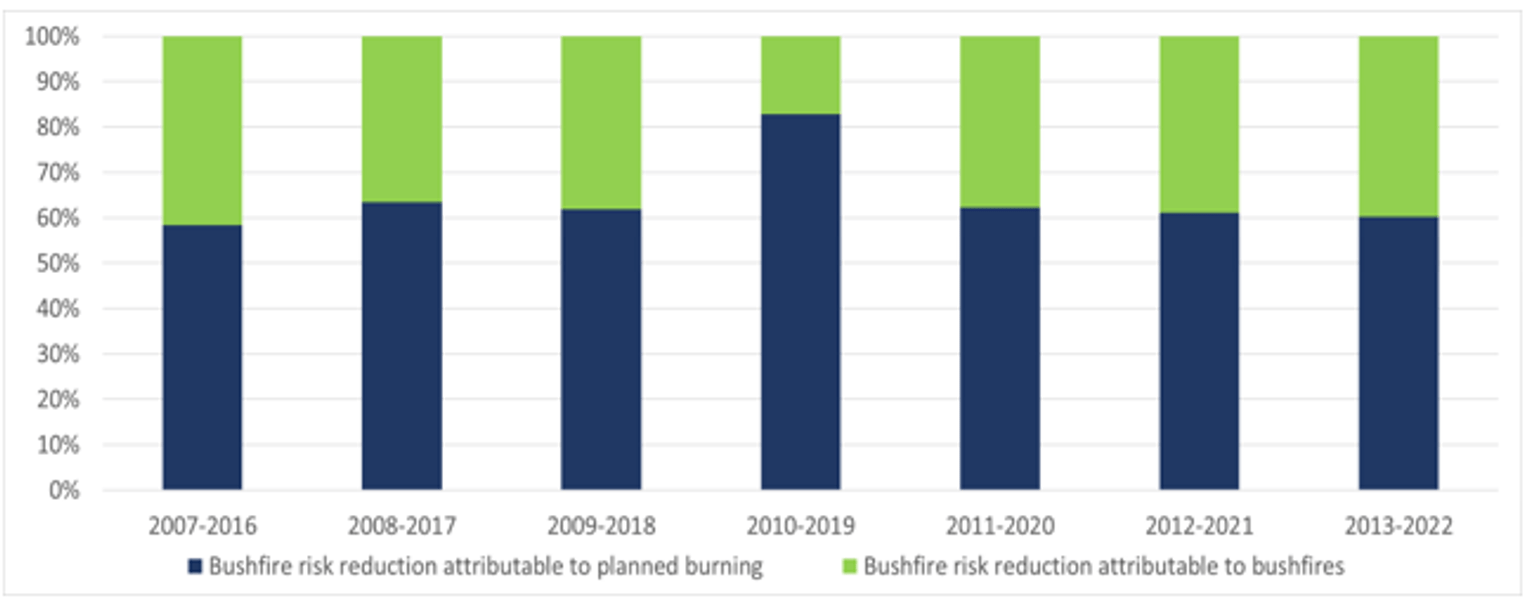
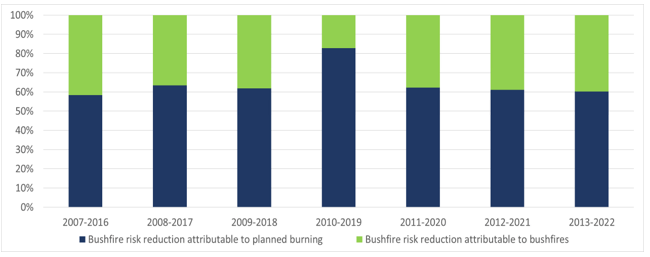
Modelling can be used to determine the relative contribution of planned burning and bushfires to risk reduction realised through the reduction of bushfire fuels. Presenting the contribution to risk reduction from planned burns and previous bushfires as a 10-year rolling average is a more meaningful and accurate way to present this data than doing it as a year-to-year contribution.
The reasons for this include:
- there is year-to-year variability in risk reduction contribution. For example, in years with very large bushfires, such as the 2019–20 fire season, the majority of risk reduction would be attributable to bushfires, whilst in years with minimal bushfire activity, almost 100% risk reduction is attributable to planned burning, and
- additionally, planned burns provide risk reduction benefits that last for several years. Reporting on risk reduction from planned burns on a rolling 10-year window captures the continued risk-reduction effect of burns conducted in previous years, as well as bushfires and planned burns from the reporting year.
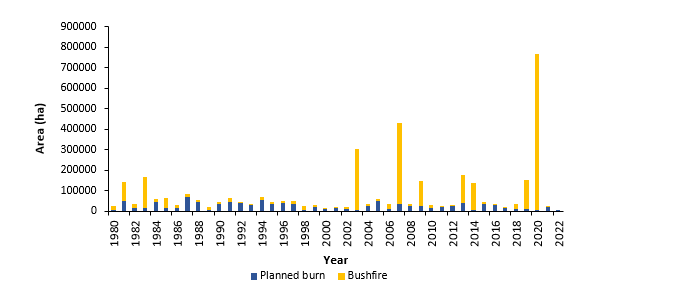
Although there is considerable variation from year to year, Figure 2 shows that most risk reduction has been achieved through planned burning, even when considering the influence of major bushfires (such as the 2009 Black Saturday bushfires and 2019–20 Black Summer bushfires).
Analysis shows that despite bushfires impacting a substantially greater area than planned burns over the last 10-year period, planned burning accounts for more risk reduction than bushfires.
From July 2013 to June 2022, planned burns accounted for approximately 22% of the total burnt area across the State, with bushfires contributing to the remaining 78 %. However, planned burning accounted for 60% of the total risk reduction across Victoria, compared to 40 % risk reduction from bushfires.
This is a result of using the best available science and data to identify and target areas for planned burning in strategic locations (such as close to high-value assets) to reduce the risk to life and property, whereas unplanned bushfires are indiscriminate and may occur anywhere in the landscape.
Figure 2 shows the rolling 10-year average of fuel-driven bushfire risk reduction attributable to planned burning and bushfires across Victoria since 2007.
Figure 2: Rolling 10-year average fuel-driven bushfire risk reduction attributable to planned burning and bushfires, Victoria, 2007–22.
Ecosystem resilience
The design and delivery of FFMVic’s fuel management program aim to meet the primary objectives for bushfire management outlined in the Code of Practice for Bushfire Management on Public Land 2012 (the Code):
- to minimise the impact of major bushfires on human life, communities, essential and community infrastructure, industries, the economy and the environment; human life will be afforded priority over all other considerations
- to maintain or improve the resilience of natural ecosystems and their ability to deliver services such as biodiversity, water, carbon storage and forest products.
Both objectives in the Code of Practice for Bushfire Management on Public Land 2012 have elements related to the protection and maintenance of environmental health.
FFMVic’s fuel management program considers how best to meet both objectives and recognises the need to manage these objectives over different temporal and geographic scales.
This is achieved by managing fuels and conducting burns to protect environmental values and promote ecosystem resilience. Fire is a natural and vital process for many of Victoria’s ecosystems. Ecosystem resilience reflects this natural relationship between fire, regeneration and ecosystem health.
To understand the effects of both natural bushfires and planned burning on the environment, FFMVic measures and monitors the timing and number of fires in different types of vegetation.
These are measured relative to:
- the time taken for vegetation types to reach reproductive maturity following fire – referred to as the tolerable fire interval (TFI), and
- the age classes of different types of vegetation – referred to as the growth stage structure (GSS).
FFMVic also partners with universities and other academic institutions to conduct research that improves how ecosystem resilience is represented and measured.
Changes to reported ecosystem resilience
Between this report and the 2020–21 report, a range of improvements were made to the mapping of past fires. This included mapping improvements that identified additional areas impacted by past fires.
This resulted in changes to calculated values of TFI and GSS for 2020–21 relative to those reported last year, including an increase in vegetation within the juvenile age class and a reduction in the amount of vegetation without known fire history.
The below-reported values for 2021–22 incorporate these mapping improvements. Appendix 1 provides detail of changes to 2020–21 values.
Tolerable fire intervals across the state
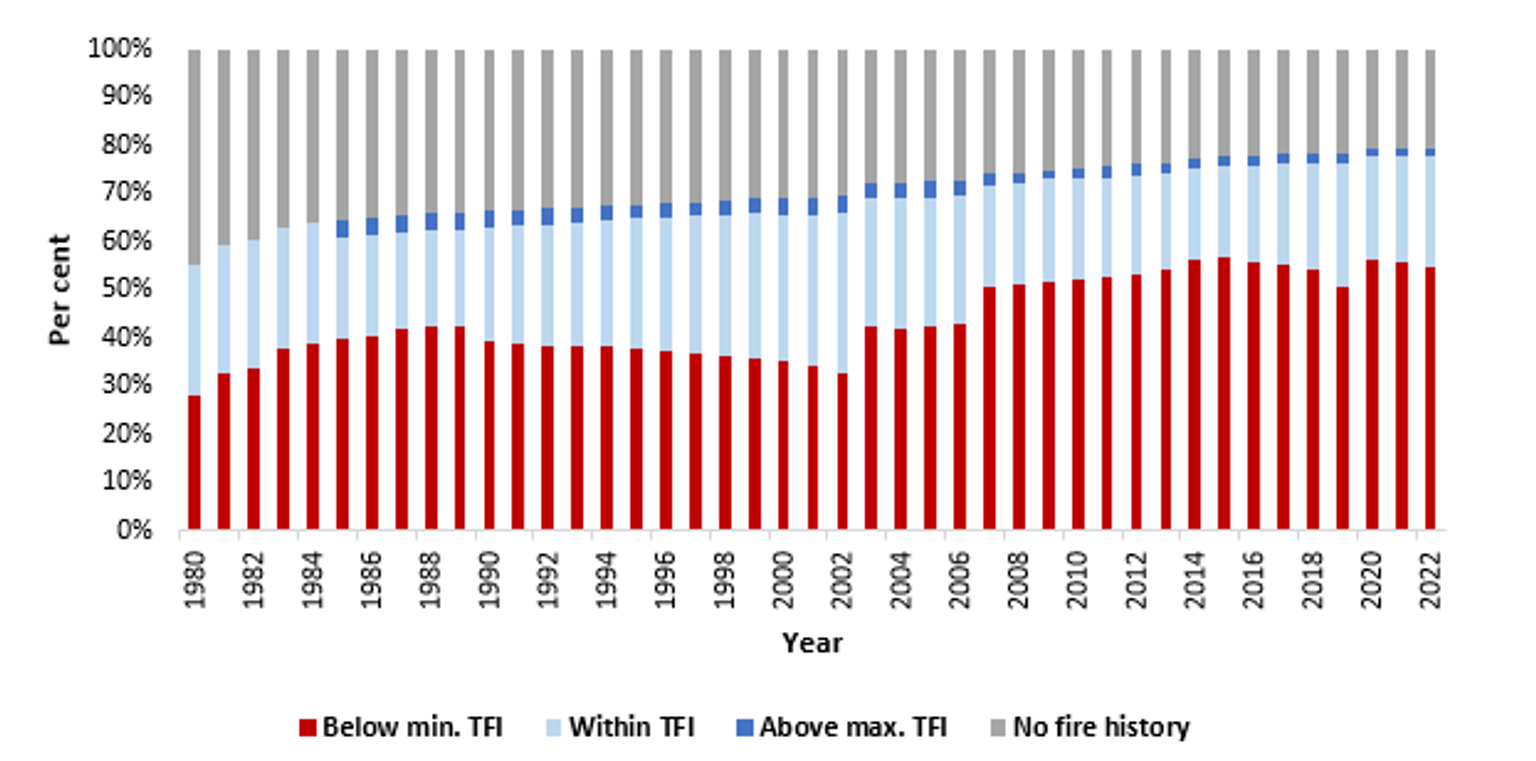
It is desirable to minimise the total area burnt while vegetation is below reproductive maturity (minimum TFI) because it might affect the vegetation’s ability to successfully regenerate. This is sometimes unavoidable, to reduce fuel-driven bushfire risk to human life, property or other important values.
Figure 3 shows the TFI status of vegetation on public land across Victoria since 1980. It shows that in 2021–22, the proportion of vegetation:
- below minimum TFI was 55%– although this was an improvement, with 71,750 fewer hectares than the previous year in this category, the proportion is still high because of the impacts of the 2019–20 bushfires
- within TFI increased to 23%
- above maximum TFI remained at 2%, and
- with no fire history data to enable assessment remained at 20%.
Figure 3: TFI status of vegetation on public land, Victoria, 1980–2022. Data aligns with financial year.
Figure 4: Area of public land burnt while below minimum TFI, Victoria, 1980-2022. Data aligns with Financial year.

Figure 4 shows the area of public land in Victoria burnt by bushfires and planned burning while below minimum TFI since 1980. It shows that in 2021–22:
- 12,808 hectares of vegetation on public land was burnt by planned burning or bushfire while below minimum TFI, less than half the area burnt under minimum TFI in 2020–21, and
- of this, 11,320 hectares were burnt through planned burns; this represents less than 0.2% of Victoria’s public land.
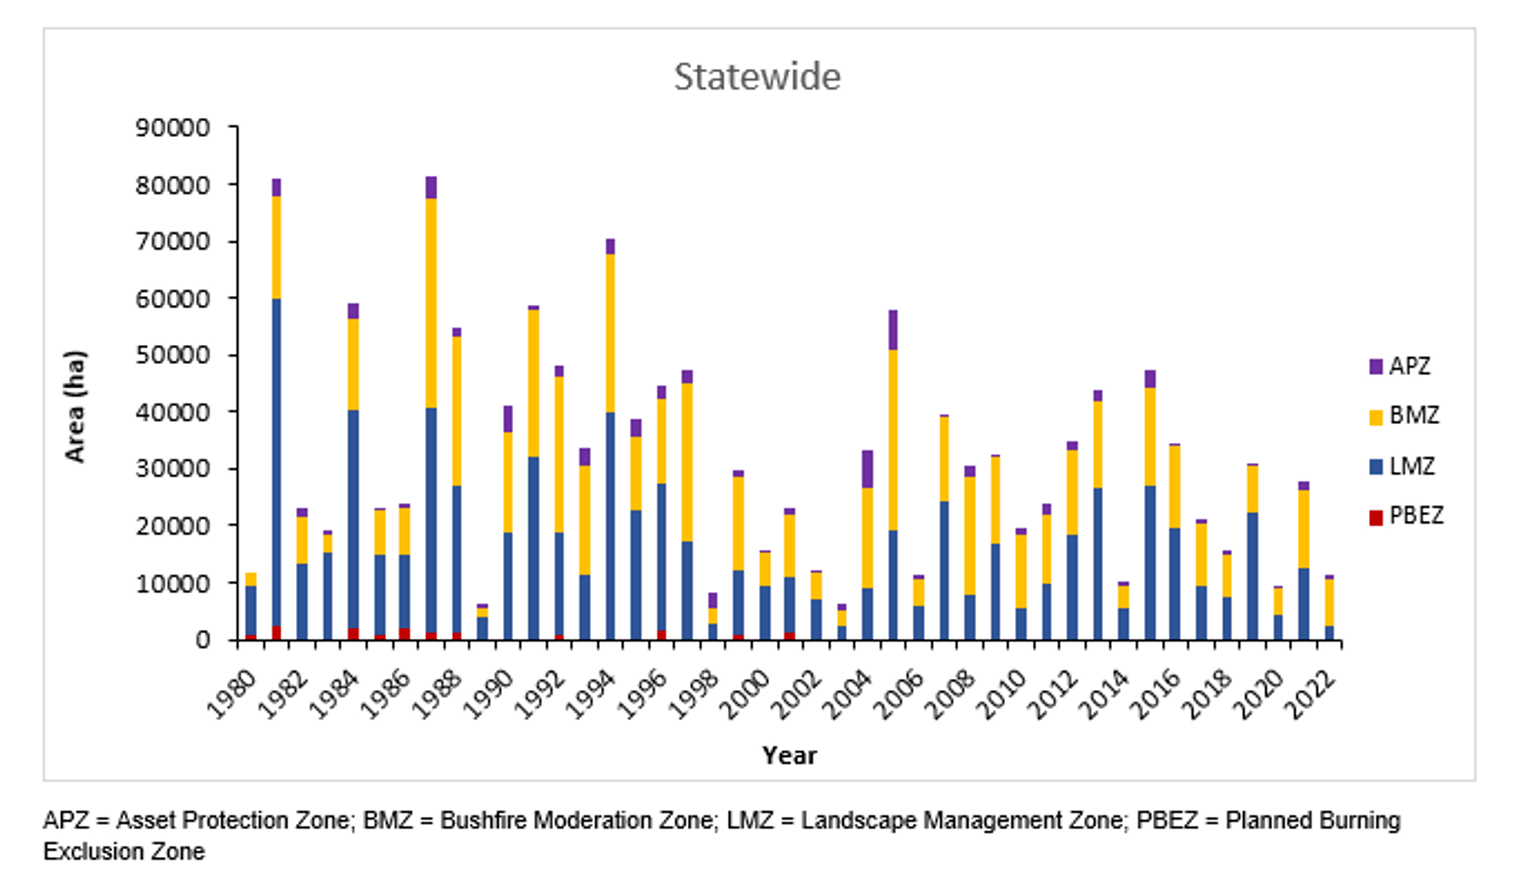
Figure 5: Area treated by planned burning while below minimum TFI, by fire management zone, 1980-22. Data aligns with financial year.
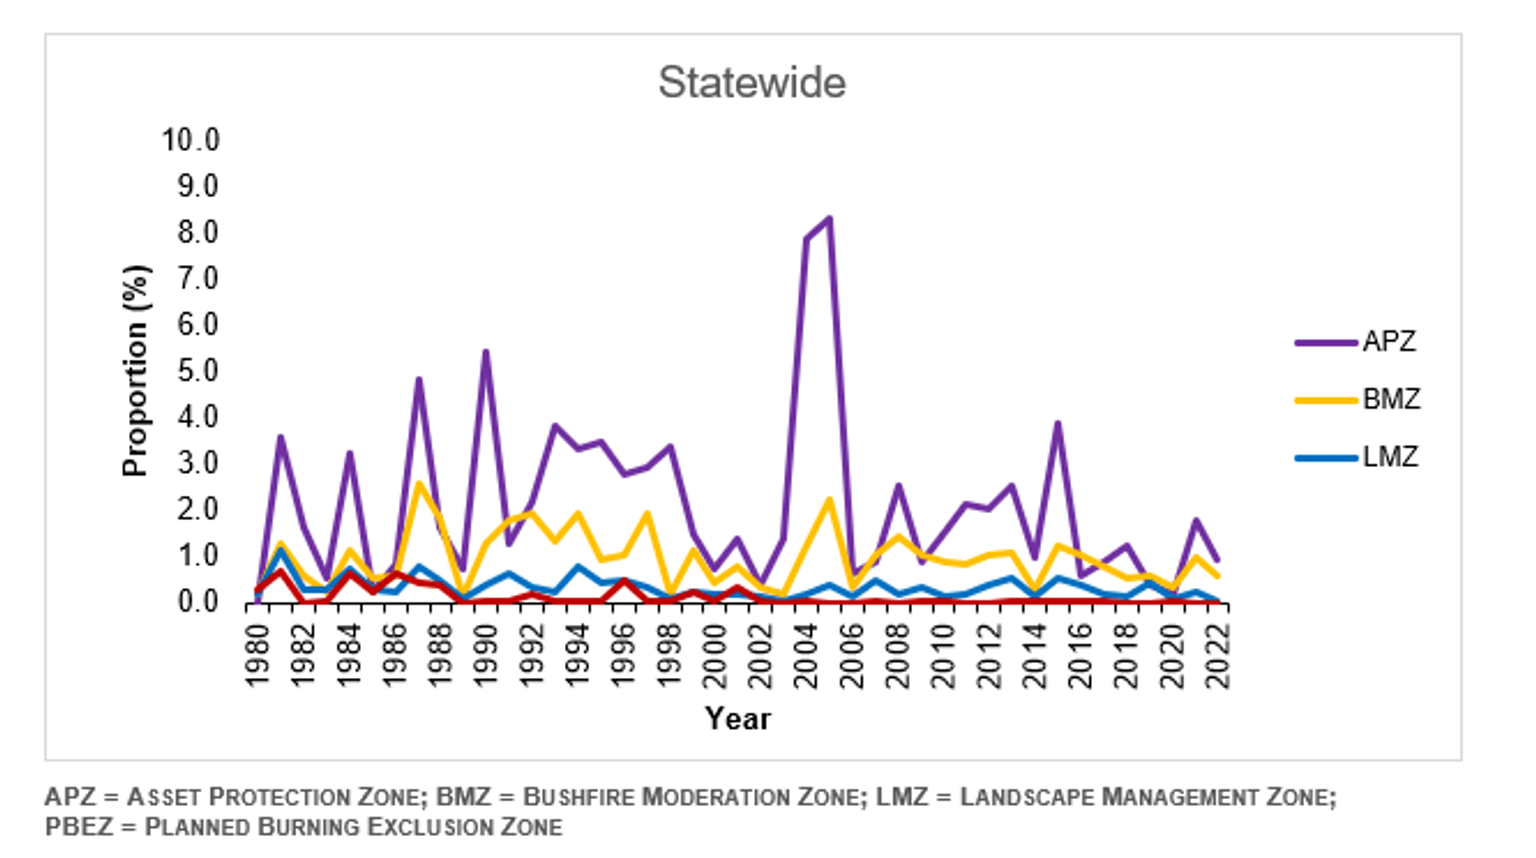
Figure 6: Proportion of fire management zone treated by planned burning while below minimum TFI, 1980-2022
Figure 5 shows the area of each fire management zone treated by planned burning while below minimum TFI, since 1980. In 2021–22:
- 754 hectares in Asset Protection Zones
- 7,989 hectares in Bushfire Moderation Zones
- 2,577 hectares in Landscape Management Zones
- 0 hectares in Planned Burn Exclusion Zones.
Figure 6 shows the proportion of the total hectares in each fire management zone treated by planned burning while below minimum TFI, since 1980. In 2021–22 there were:
- 0.9% in Asset Protection Zones
- 0.6%in Bushfire Moderation Zones
- 0.1% in Landscape Management Zones, and
- 0.0% in Planned Burn Exclusion Zones.
Understanding the impacts of planned burns and bushfires on TFI is useful to inform regional-scale decision-making. However, when considered in isolation, TFI may not account for finer-scale vegetation responses to fire, or the differing severity and patchiness of planned burn operations.
Regional bushfire management strategies aim to minimise areas burnt while below minimum TFI, while delivering on other priority objectives.
Victoria continues to improve:
- it's understanding of TFI by monitoring the responses of vegetation to fire and investing in research that improves the ability to predict these responses, and
- the accuracy of TFI mapping by updating distribution models for key flora species on which minimum TFIs are based.
Growth stage structure across the state
FFMVic measures and tracks the distribution of vegetation growth stage structure (GSS) on public land across the landscape to ensure an optimal mix of plant developmental stages is maintained. These different growth stages provide important resources and habitat structures for species.
Maintaining a desirable mix of GSS across the landscape is an important component of ecosystem resilience. It can take many years before the proportion of vegetation in older growth stages recovers to the levels it was before major bushfire events. Some vegetation communities can take more than 50 years to reach maturity.
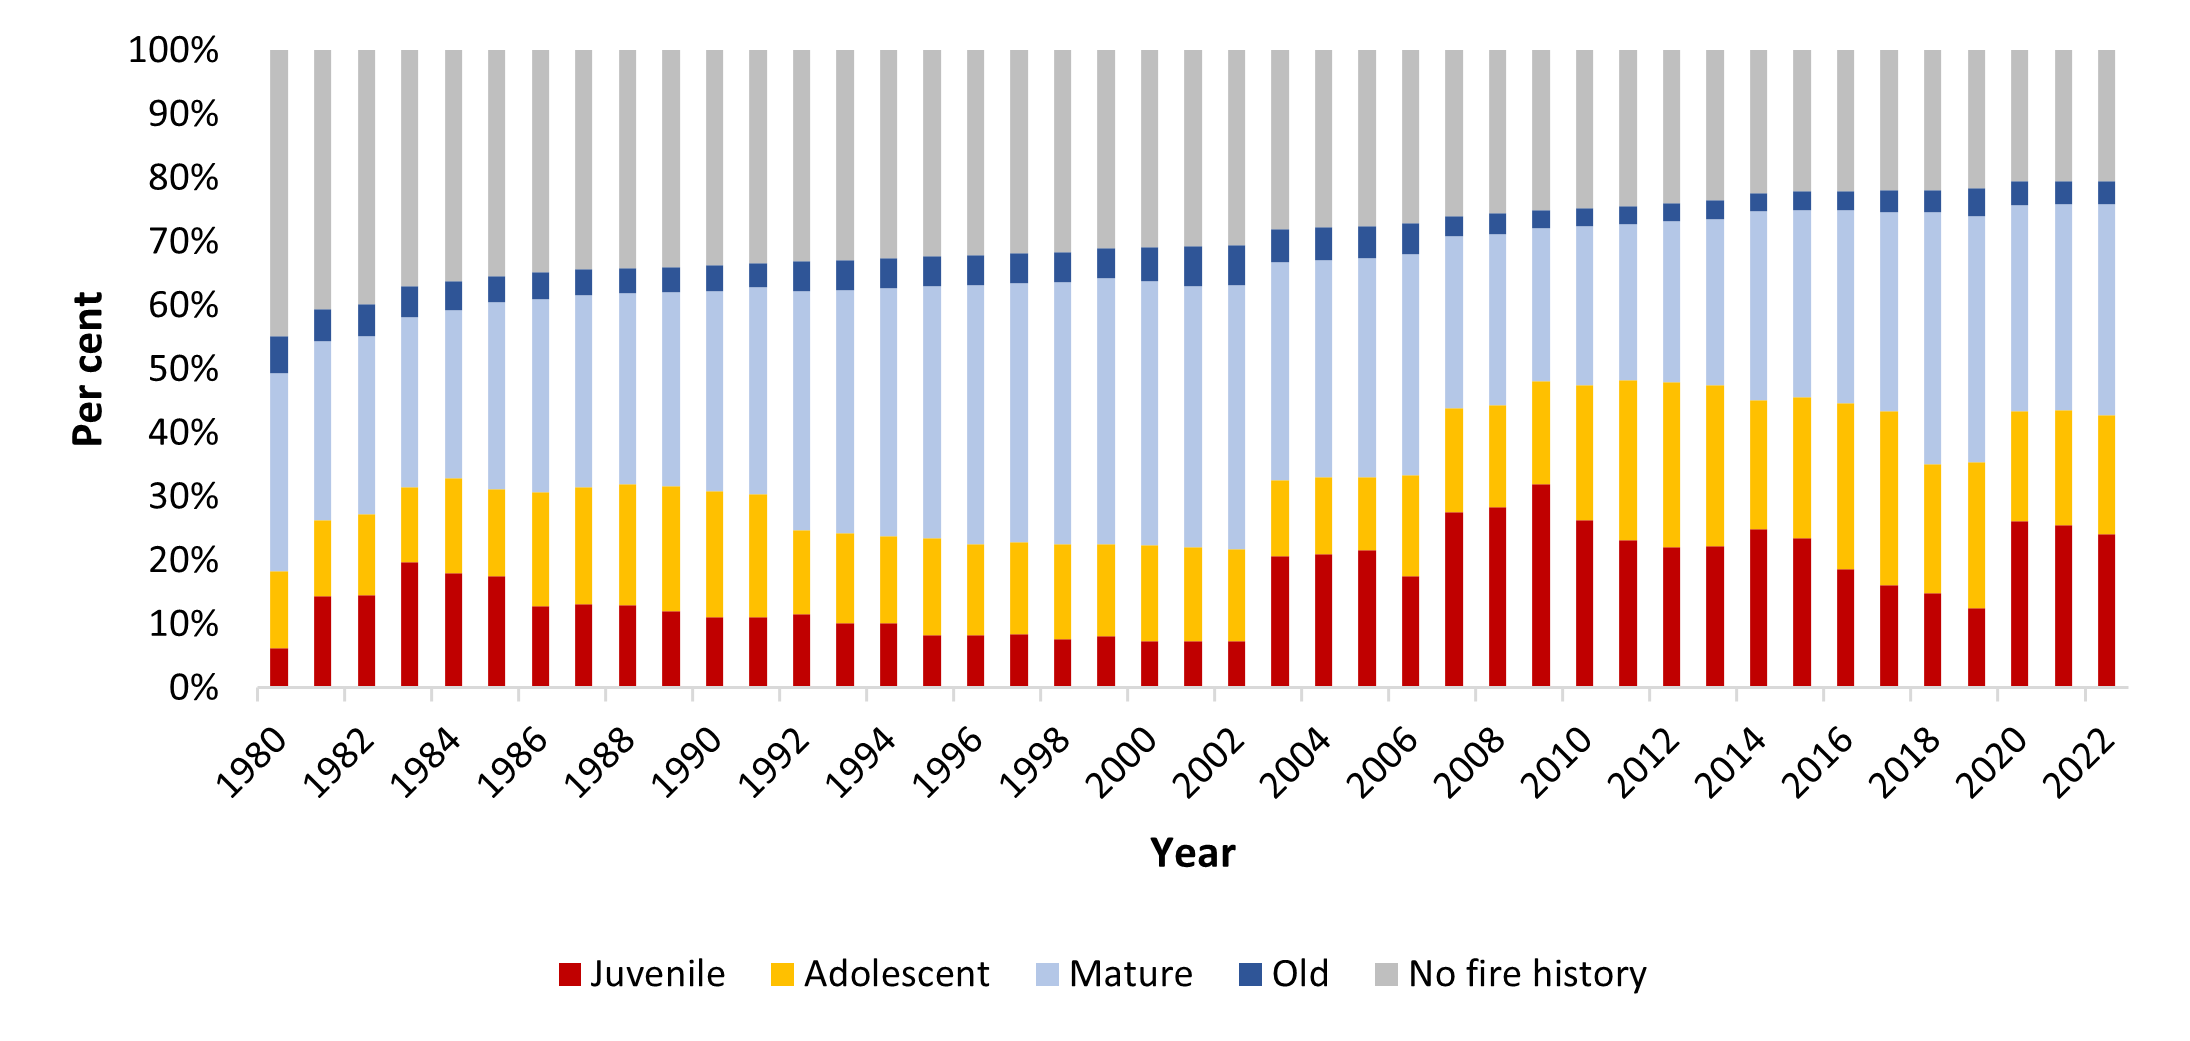
Figure 7 shows changes in statewide GSS since 1980. It shows the proportion of vegetation on public land in the:
- juvenile growth stage decreased from 26% in 2020–21 to 24% in 2021–22
- adolescent growth stage increased from 18% to 19%
- mature growth stage increased from 32% to 33%
- old growth stage remained at 4%.
The proportion of public land with no recorded fire history remained at 20% in 2021–22. This area has been declining steadily since 2003.
Figure 7: GSS status of vegetation on public land, Victoria, 1980–2022

FFMVic fuel management delivery
FFMVic approach to fuel management on public land
Under the Forests Act 1958, the Department of Energy, Environment and Climate Action (DEECA) is responsible for managing bushfire risk in State forests, national parks and other protected public land in Victoria. It does this through Forest Fire Management Victoria (FFMVic), which is led by DEECA and draws on partnership arrangements with Parks Victoria, VicForests and Melbourne Water to manage bushfire risk.
The Code of Practice for Bushfire Management on Public Land 2012 (The Code) specifies the objectives of fuel management and informs the planning and delivery of fuel management on public land.
A bushfire management strategy for each of DEECA’s six regions (Barwon South West, Grampians, Loddon Mallee, Hume, Gippsland and Port Phillip) informs fire management zoning which is a key tool to implement local bushfire management objectives.
Each fire management zone has its own intended fuel treatment aims and associated performance measures, although multiple goals can be achieved when undertaking activities in a zone.
The Code defines four fire management zones:
Asset Protection Zone (APZ)
Using intensive fuel treatment, the APZ aims to provide the highest level of localised protection to human life and property and key community assets. The goal of fuel treatment is to reduce radiant heat and ember attacks from a bushfire. Fuel treatments in the APZ include planned burning and non-burn fuel treatments (such as mowing, slashing, mulching and spraying).
Bushfire Moderation Zone (BMZ)
This zone aims to reduce the speed and intensity of bushfires. This zone complements the APZ, as planned burning in the BMZ aims to protect nearby assets, particularly from ember spotting during a bushfire. Where practicable, FFMVic aims to achieve ecological outcomes through ecologically desirable fire regimes, if bushfire protection objectives – including fuel reduction through non-burn fuel treatments – can be met.
Landscape Management Zone (LMZ)
Within this zone, planned burning is used for the three broad aims of:
- bushfire protection outcomes by reducing the overall fuel and bushfire hazard in the landscape
- ecological resilience through appropriate fire regimes, and
- management of the land for specific values, including forest regeneration and protection of water catchments at a landscape level.
Other fuel reduction methods are used within this zone as appropriate.
Planned Burning Exclusion Zone (PBEZ)
This zone excludes the use of planned burning, primarily in areas where the vegetation is intolerant to fire.
2021-22 FFMVic fuel management
Fuel management activities
In 2021–22, Victoria experienced a La Niña weather pattern, which resulted in cool, wet conditions through autumn. This limited FFMVic’s ability to deliver planned burns, particularly for areas in the east of Victoria, where planned burn sites were too wet for preparation works.
FFMVic responded to this by moving 1,600 firefighters and 240 support staff to priority risk-reduction areas of the state where planned burning remained viable. More than 13,000 shifts were worked by staff outside of their base location, to ensure continuation of the Joint Fuel Management Program (JFMP) delivery. CFA resources also assisted with the delivery of a number of FFMVic fuel management activities providing both personnel and equipment.
Table 2 provides a snapshot of FFMVic’s statewide outcomes and delivery for 2021-22. The year-round FFMVic fuel-driven bushfire risk reduction program treated 77,927 hectares, with 264 planned burns across 62,260 hectares and non-burn treatments across 15,667 hectares. The planned burns included significant risk-reducing burns across Narbethong, Cabbage Tree, Moggs Creek and the Wombat Forest.
Table 2. Performance snapshot of FFMVic Statewide outcomes and delivery, 2021-22.
| Performance measures | Unit of measure | 2021-22 Target | 2020-21 Actual | 2021-22 Actual | Projected actual in 2021-22, in the absence of bushfires and fuel management |
|---|---|---|---|---|---|
| Outcome: Statewide fuel-driven bushfire risk | % | 70 | 63 | 62 | 65 |
| Activity: Area treated with fuel management | ha | n/a | 152,083 | 77,297 | n/a |
| Activity: Cross-tenure burns | number | n/a | 37 | 32 | n/a |
| Activity: Strategic fuel breaks built or upgraded | km | 963 | 545 | 741.3 | n/a |
| Activity: Joint Fuel Management Plans completed | date | Sept 2021 | Sept 2020 | Oct 2021 | n/a |
| Outcome: Vegetation on public land within tolerable fire interval | % | n/a | 22' | 23 | - |
| Outcome: Vegetation on public land in the mature or old-growth stages | % | n/a | 36 | 37 | - |
| Activity: Traditional Owner led cultural burns supported | number | n/a | 15 | 13 | n/a |
| Investment: Total cost of FFMVic fuel management program | $M | n/a | 155.9 | 151.0 | n/a |
i: Note that data and modelling improvements led to some 2020-21 figures being recalculated. Vegetation on public land in the mature or old growth stages for 2020-21 was revised from 34% to 36%. Further information on these changes is provided in Appendix 1.
From 505 burns listed on the JFMP for 2021–22, FFMVic identified 135 priority planned burns, with the state and regions identifying which burns would reduce risk the most. This prioritisation focuses FFMVic efforts on the burns that deliver the greatest risk reduction when weather conditions that suit those areas are predicted. In 2021–22, this focus delivered 89 of the identified 135 priority burns (66%).
This year, FFMVic continued to partner with Traditional Owners to implement the Victorian Traditional Owner Cultural Fire Strategy. Over the season, five Traditional Owner groups across three regions (Loddon Mallee, Grampians and Barwon South West) led 13 cultural burns across 366 hectares with planning, delivery and post-fire management support from FFMVic.
The groups were the:
- Dja Dja Wurrung Aboriginal Corporation
- Barengi Gadjin Land Council
- Barapa Land and Water Corporation
- Gunditj Mirring Traditional Owners Aboriginal Corporation
- Wadawarrung Traditional Owners Aboriginal Corporation.
Through the support of a Cultural Fire Grants Program for Traditional Owners, it is projected that the number of cultural burns delivered throughout the state will increase in the coming years.
FFMVic also continued to put procedures in place to ensure COVID-19 risks were mitigated for staff and the community and recognised community concerns about how potentially increased levels of smoke from planned burning might affect businesses recovering from the impacts of COVID-19.
FFMVic worked closely with communities, stakeholders, and other government agencies – including the Environment Protection Authority and Department of Health – to minimise the impacts of planned burns on communities.
This included scheduling burns in weather conditions that minimised impact, or rescheduling burns to outside peak holiday times.
In addition to planned burning and non-burn fuel treatment activities, FFMVic also undertook a range of other activities that contributed to reducing bushfire risk, including:
- 741 kilometres of strategic fuel breaks built or upgraded across the state
- 6,696 kilometres of public land roads cleared of storm debris
- maintenance of tracks and roads, and
- management of hazardous trees to enable safe and rapid access for firefighting.
In 2021–22, no burning was done for regeneration purposes following timber harvesting.
Table 3 shows key statistics about FFMVic fuel management activities that kept fuel-driven bushfire risk below 70% for Victoria.
Table 3: Fuel-driven bushfire risk for Victoria at 30 June 2022.
Bushfire risk
| Measurement | Outcome |
|---|---|
| Statewide fuel-driven bushfire risk at or below | 70% |
| Fuel-driven bushfire risk for Victoria in 2021–22 | 62% |
Fuel management activities
| Treatment description | Size |
|---|---|
|
Area treated by planned burning By fire management zone:
By planned burn type:
|
62,260 hectares, 264 burns |
|
Area treated by non-burn fuel treatments By treatment types:
|
15,667 hectares, 1,785 treatments |
| Total area treated to reduce fuel-driven bushfire risk | 77,927 hectares |
Cultural fire
| Traditional Owner led cultural burns | |
| Cultural burns | 366 hectares, 13 burns |
* FFMVic is a land manager, with bushfire risk being one target, currently set at 70%. Bushfire management strategies outline the many outcomes of the fuel management program. Activities such as the number of burns and hectares planned for treatment are not targets but illustrate the scale of work funded to achieve the outcomes of bushfire management strategies.
Cross-tenure fuel management delivery
FFMVic’s fuel management program is strengthened by the Victorian Government’s Safer Together program, which ensures FFMVic works in partnership with CFA, Fire Rescue Victoria (FRV), the Department of Transport and Planning (DTP) and local government to support integrated, evidence-based bushfire risk management across all public and private land in Victoria.
In 2021–22, 32 cross-tenure planned burns were delivered by FFMVic and CFA, shown in Table 4, including on large areas of private land.
The majority of these burns were regionally critical due to being aligned to regional bushfire management strategies and providing high levels of risk reduction value. All cross-tenure planned burns are included in the fuel-driven bushfire risk calculations.
Table 4: Cross-tenure planned burns, by region, Victoria, 2021–22
| Region | Number of burns | Hectares |
|---|---|---|
| Barwon South West | 12 | 9,172 |
| Gippsland | 5 | 3,858 |
| Grampians | 6 | 1,031 |
| Hume | 1 | 2,693 |
| Loddon Mallee | 0 | 0 |
| Port Phillip | 8 | 227 |
| Total | 32 | 16,981 |
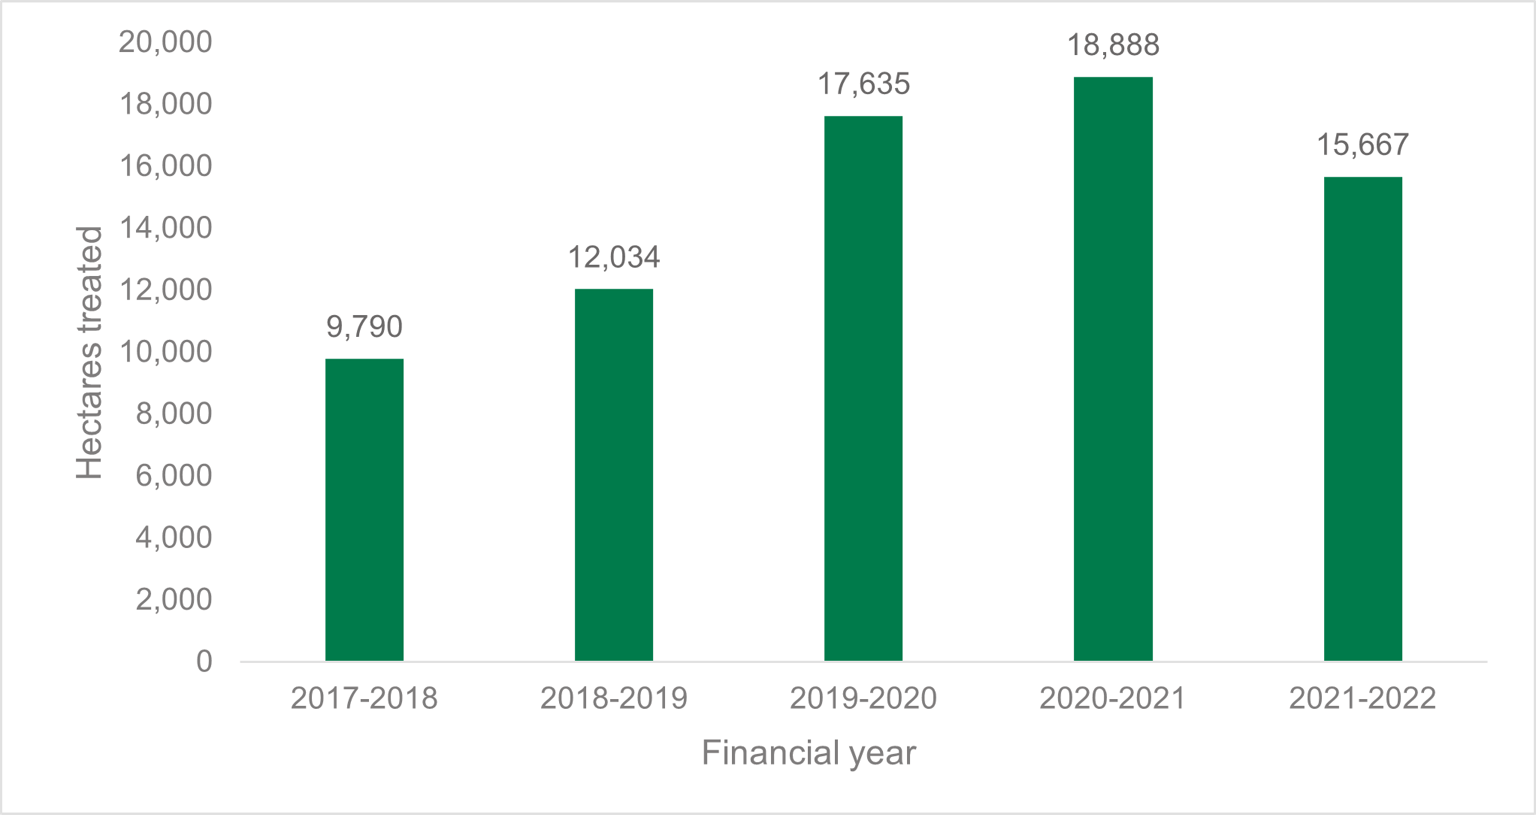
Figure 8 shows that FFMVic undertook mechanical fuel treatments across 15,667 hectares in 2021–22.
Figure 8: Comparison of total area treated by non-burn fuel treatments, Victoria, 2017–18 to 2021–22
Planned burn ignitions
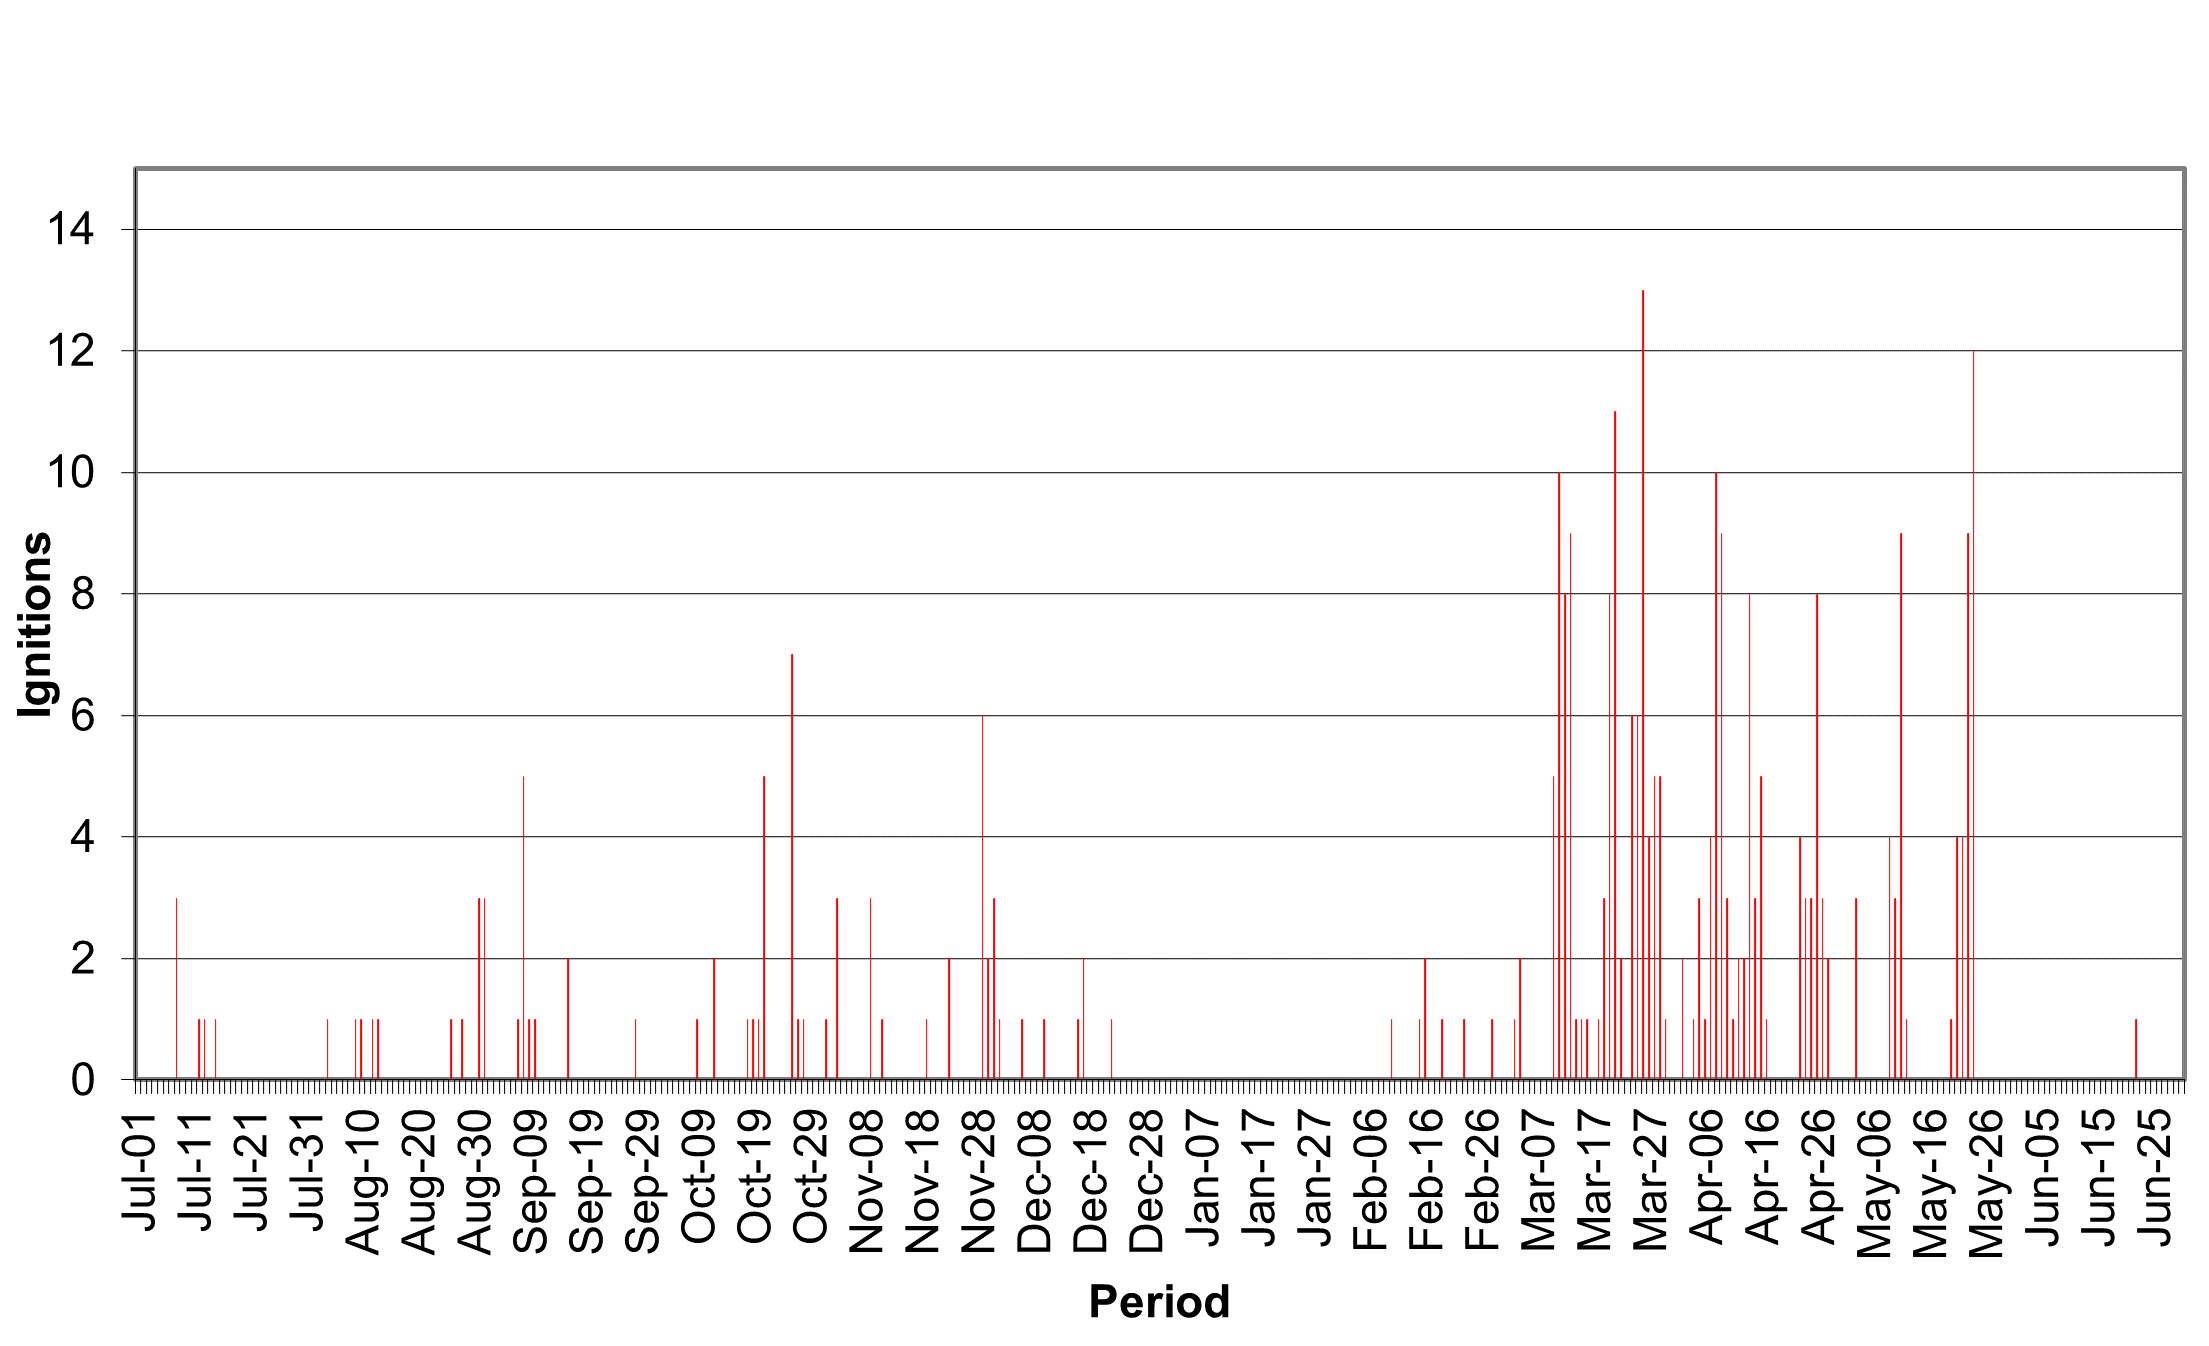
FFMVic continues to identify when conditions are favourable and takes every opportunity to complete planned burning, including during the winter months. Figure 9 shows the number of planned burns ignited each day across 2021–22. In some districts, La Niña’s impact resulted in shorter windows between the passing unstable weather systems for planned burning. Despite this impact, burns were ignited on 58 days in autumn, consistent with longer-term averages, demonstrating that opportunities continue to be taken where they exist.
Figure 9: Number of daily ignitions of planned burns, Victoria, 2021–22

The vast majority of the planned burning program continues to be delivered in the late summer and autumn when weather conditions are typically more stable, fire behaviour is generally more manageable and predictable, there is a lower risk of extreme fire danger days, and the fuel conditions are appropriate to achieve the desired burn objective.
Planned burn opportunities
In 2021, FFMVic released a prototype tool to track ignition opportunities on a day-by-day basis and record why individual burns were not ignited as originally planned. The tool does not report on Traditional Owner or heap burns, (small debris pile burns at point locations) so numbers in this section will differ slightly from figures stated elsewhere in the report. This tool provides data from the beginning of the 2021-22 financial year.
In 2021–22, FFMVic planned to deliver 505 burns as a part of Year 1 of the JFMP. Another 22 burns were brought forward from Year 2 and Year 3 to take advantage of suitable opportunities. Of these burns:
- 194 (38%) of Year 1 burns were delivered
- all of Year 2 and Year 3 burns brought forward to 2021-22 were delivered, bringing the annual total to 216 burns delivered (does not include Traditional Owner cultural burns or heap burns)
- 311 (62%) of Year 1 burns were not delivered as intended, with 61 (20%) of those burns scheduled but not ignited.
Table 5 shows factors influencing the 311 planned burns on Year 1 of the JFMP that were not delivered.
Table 6 shows factors influencing the delivery of the 61 burns that were scheduled but not ignited.
Table 5, Factors influencing the delivery of planned burns not ignited, Victoria 2021–22
| Factors influencing delivery | Proportion (%) |
|---|---|
| Weather conditions not suitable | 52.7% |
| Fuel moisture not suitable | 18.9% |
| Burn planning or burn preparation not completed in time | 26.2% |
| Resources unavailable | 1.0% |
| Community or stakeholder related | 0.6% |
| Other | 0.5% |
Table 6: Factors influencing the delivery of planned burns scheduled but not ignited Victoria, 2021–22
| Factors influencing delivery | Proportion (%) |
|---|---|
| Fuel moisture not suitable | 27.8% |
| Weather conditions not suitable | 27.2% |
| Resources unavailable | 7% |
| Re-prioritised | 1.9% |
| Environment, community, stakeholder related | 1.2% |
| Other constraints | 5.1% |
| Removed from schedule, reason not specified1 | 29.8% |
1 Planned burns removed from schedule without a reason being provided. Future improvements to the tracking tool will require a reason to be entered for burns removed from the schedule.
In 2021-22, 311 burns (62%) in Year 1 of the Joint Fuel Management Program were not delivered as intended.
In most cases, burns were not scheduled or were cancelled because:
- weather conditions were unsuitable
- the weather forecast changed, or
- fuels (vegetation) were either too wet or too dry to meet the objectives of the burn.
For 81 of the 311 burns (26.2%) which were not ignited, burn planning or site preparation works had not been completed.
Various activities need to be completed for a burn to be considered fully planned and prepared, including things that can take time, such as checking the values within a burn unit, notifying neighbouring landholders and holding community consultation activities.
Significant rainfall and average to cooler-than-average conditions across much of the state impacted FFMVic’s ability to prepare and deliver burns on Year 1 of the JFMP, particularly in areas where planned burn sites were too wet for preparation works or subject to storm damage, such as in the Wombat State Forest and Dandenong Ranges.
Burns scheduled for 2021–22 delivery was not fully planned and prepared if conditions indicated low confidence of suitable weather and forest conditions for delivery. Instead, burns scheduled for future years were brought forward.
This ability to adapt to variable conditions across the state is an important aspect of FFMVic’s bushfire risk reduction program.
Learnings from the Ignition Tool prototype
The Ignition Tool also showed that in 2021–22, resource availability was a moderate issue that occurred mostly in the Barwon South West region, where the level of burning was high compared with other regions.
Where burning activity is high, local resource availability becomes constrained, and resources are brought in from areas of the state that have fewer opportunities to deliver priority planned burns.
Despite this movement of resources, shortfalls can still be experienced, because the correct burning conditions are often right for many burns at the same time.
As a result, FFMVic prioritises allocation of resources to the priority burns that will achieve the greatest risk reduction. The sustained burn windows in Barwon South West also required careful management of operational fatigue.
FFMVic has indicated it will continue to improve the information captured in relation to burn planning, scheduling and operational delivery in 2022–23.
Traditional Owner-led cultural burning
DEECA is committed to reconciliation and a Treaty for Victoria’s Traditional Owners. In response to the needs of Traditional Owners and Aboriginal Victorians, DEECA developed Pupangarli Marnmarnepu 'Owning Our Future’ Aboriginal Self-Determination Reform Strategy 2020-2025 (the Strategy).
The Strategy is a five-year roadmap that enables self-determination at DEECA by fostering an environment that honours the rights and dignity of Traditional Owners and Aboriginal Victorians.
The Strategy is founded on cultural authority that sets the strategic direction and actions for us to advance Aboriginal self-determination.
FFMVic acknowledges the diversity of ways Traditional Owner groups want to use cultural fire and participate in land management.
FFMVic continues to build partnerships with Traditional Owner groups to deliver cultural burning on public land, build capacity through the Cultural Fire Grants Program, and provide operational support for the implementation of the Victorian Traditional Owner Cultural Fire Strategy.
During 2021–22, FFMVic provided operational and planning support to Traditional Owner groups across Victoria to plan and undertake 13 cultural burns. These were additional to planned burning for bushfire risk management purposes.
While cultural burns may reduce fuel-driven bushfire risk (and are included in risk calculations), the objectives of cultural burns are varied and are defined by the Traditional Owners leading the burn.
Table 7 shows the total area and number of Traditional Owner cultural burns completed in 2021–22.
Traditional Owners have a strong interest in burning, and there is an expectation the number of cultural burns will continue to increase in 2022–23.
Table 7: Traditional Owner cultural burns, by region, 2021–22.
| Region | Number of burns | Hectares |
|---|---|---|
| Barwon South West | 3 | 95 |
| Gippsland | 0 | 0 |
| Grampians | 5 | 62 |
| Hume | 0 | 0 |
| Loddon Mallee | 5 | 209 |
| Port Phillip | 0 | 0 |
| Total | 13 | 366 |
Fuel management investment
FFMVic invested $151.0 million on fuel management in 2021–22, a 3% decrease from $155.9 million in 2020–21.
Table 8 provides a breakdown of this investment by region and type of investment.
Direct investment totalled $37.3 million, with indirect investment totalling $113.7 million.
Table 9 provides a further breakdown of indirect investment.
A large proportion of the indirect fuel management costs are associated with resource management (42%) and equipment and infrastructure (16%) costs.
Appendix 1 summarises year-on-year costs.
Table 8: Fuel management investment, by region and group, Victoria, 2021–22
| Region | Fuel management $ (direct) | Fuel management $ (indirect) | Total ($) |
|---|---|---|---|
| Barwon South West | 9,498,735 | 8,410,795 | 17,909,530 |
| Gippsland | 4,464,226 | 17,810,783 | 22,275,009 |
| Grampians | 4,749,695 | 8,215,953 | 12,965,648 |
| Hume | 7,538,986 | 17,129,979 | 24,668,965 |
| Loddon Mallee | 2,850,209 | 8,724,855 | 11,575,064 |
| Port Phillip | 5,117,731 | 6,125,340 | 11,243,071 |
| Statewide | 3,032,264 | 47,311,791 | 50,344,056 |
| Total fuel management investment | 37,251,846 | 113,729,496 | 150,981,343 |
Table 9: Indirect fuel management investment, by items, Victoria 2021–22
| Item | Indirect investment (%) | Total ($) |
|---|---|---|
| Business management | 5 | 5,507,634 |
| Capability | 11 | 12,247,137 |
| Engagement | 6 | 7,352,872 |
| Equipment and infrastructure | 16 | 18,378,101 |
| Monitoring, evaluation, and reporting | 7 | 7,864,637 |
| Native vegetation framework | 0 | 30,142 |
| Operational planning | 5 | 5,400,420 |
| Research | 1 | 1,286,836 |
| Resource management | 42 | 48,750,136 |
| Strategic planning | 6 | 6,911,581 |
| Total indirect investment | 100 | 113,729,496 |
Victorian Bushfire Monitoring Program
In 2021–22, the Monitoring, Evaluation and Reporting Framework for Bushfire Management on Public Land (PDF, 1.32 MB) continued to be delivered through the Victorian Bushfire Monitoring Program (VBMP).
This included monitoring fuel levels, ecosystem resilience measures, research projects and location-specific activities to support improvement.
The data from monitoring enables FFMVic to understand how effectively planned burning reduces bushfire fuels and to evaluate performance in reducing fuel-driven bushfire risk.
Fuel hazard monitoring
Fuel hazard monitoring provides important information about:
- planned burns, including the severity and coverage of each burn
- how each planned burn has reduced fuel hazard
- the success of each planned burn in achieving ecological burn objectives, where appropriate, and
- whether follow-up actions are required.
Burn objectives are set to achieve a balance between fuel reduction and preserving important values. For example, a burn objective may be to achieve 70% burn coverage within the footprint of a planned burn to ensure that sufficient refugia, habitat and food sources are left for flora and fauna.
When evaluating a planned burn, a series of plots are measured. In some instances, these are in areas intentionally left unburnt to provide refuge for animals in the planned burn area.
Table 10 shows the overall fuel hazard monitoring effort for 2021–22.
Table 10: Fuel hazard sites monitored, by region, Victoria, 2021–22
| Region | Number of pre-burn sites | Number of post-burn sites | Other | Total |
|---|---|---|---|---|
| Barwon South West | 421 1 | 358 1 | 0 | 779 |
| Gippsland | 83 | 71 | 400 2 | 554 |
| Grampians | 401 | 201 | 0 | 602 |
| Hume | 314 | 130 | 0 | 444 |
| Loddon Mallee | 50 | 50 | 0 | 100 |
| Port Phillip | 109 | 37 | 0 | 146 |
| Statewide | 957 | 847 | 400 | 2,625 |
1 This includes 100 monitoring points captured by the Conservation Ecology Centre as part of a collaborative research project.
2 This includes 200 permanent monitoring sites located in Asset Protection Zones in Gippsland. These sites are monitored whether they are burnt or not. Of these sites, 54 were in the Black Summer fire area.
Additional monitoring and improvement activities
In 2021–22, FFMVic continued to deliver the statewide ecosystem resilience monitoring program in partnership with Natural Hazards Research Australia (previously the Bushfire Natural Hazards Cooperative Research Centre), La Trobe University, Deakin University and the University of Melbourne.
To date, DEECA has invested more than $5.6 million in this monitoring, which is collecting data on habitat structure, flora, birds and mammals in 11 priority ecological fire groups across the state.
Victoria now has data for three of the highest-priority ecological fire groups, providing opportunities to replace expert datasets with empirically derived data in models and decision-making.
Data collection is underway in the remaining eight ecological fire groups.
This monitoring program is providing scientific evidence and recommendations for fire management and planning, improving the ecological basis underpinning Victoria’s ecosystem resilience metrics and future monitoring and research.
Table 11 shows additional VBMP activities undertaken across the state in 2021–22.
Table 11: Monitoring and improvement activities are undertaken, at a Statewide level and by region, Victoria, 2021–22
| Region | Monitoring activities |
|---|---|
| Statewide |
|
| Barwon South West |
|
| Gippsland |
|
| Grampians |
|
| Hume |
|
| Loddon Mallee |
|
| Port Phillip |
|
FFMVic regional outcomes and delivery – what’s happening near me?
Barwon South West
Fuel-driven bushfire risk
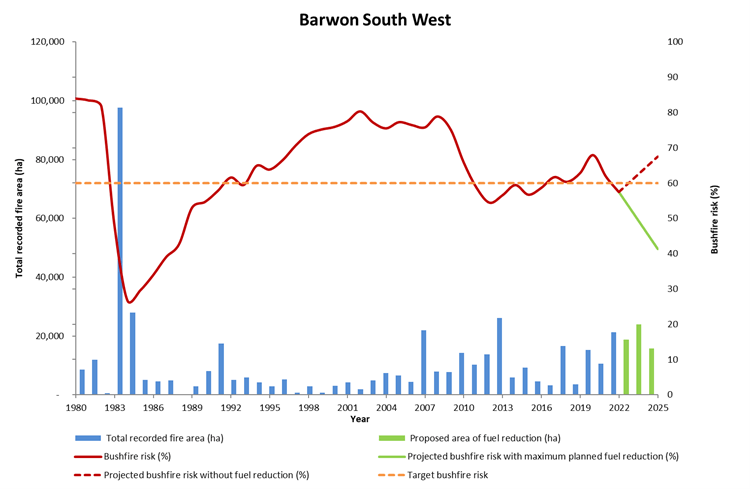
Barwon South West’s long-term regional planning target is to maintain fuel-driven bushfire risk at or below 60% maximum levels.
Fuel-driven bushfire risk in the Barwon South West region in 2021–22
- was 58% on 30 June 2022
- decreased by 4% from 62% at the end of 2020–21
- is projected to increase to 68% by 2025 in the absence of any fuel management activity or bushfires
- if implemented, the entire Joint Fuel Management Program would keep risk levels below the Barwon South West region's long-term regional planning target by 60%.
In 2021–22, fuel management was focused on providing the highest risk reduction possible within the constraints of seasonal weather conditions. Priority areas included the Surf Coast, Otway hinterland, and the Portland and Nelson areas.
Fuel treatments were predominantly planned burns, but mechanical treatments continue to be important to target difficult-to-burn areas along the Great Ocean Road.
Figure 10 shows the Barwon South West region’s risk profile from 1980 to 2022 and projected changes in fuel-driven bushfire risk until 2025.
Figure 10: Bushfire risk profile, Barwon South West region, 1980–2025. Data aligns with financial year.
Ecosystem resilience
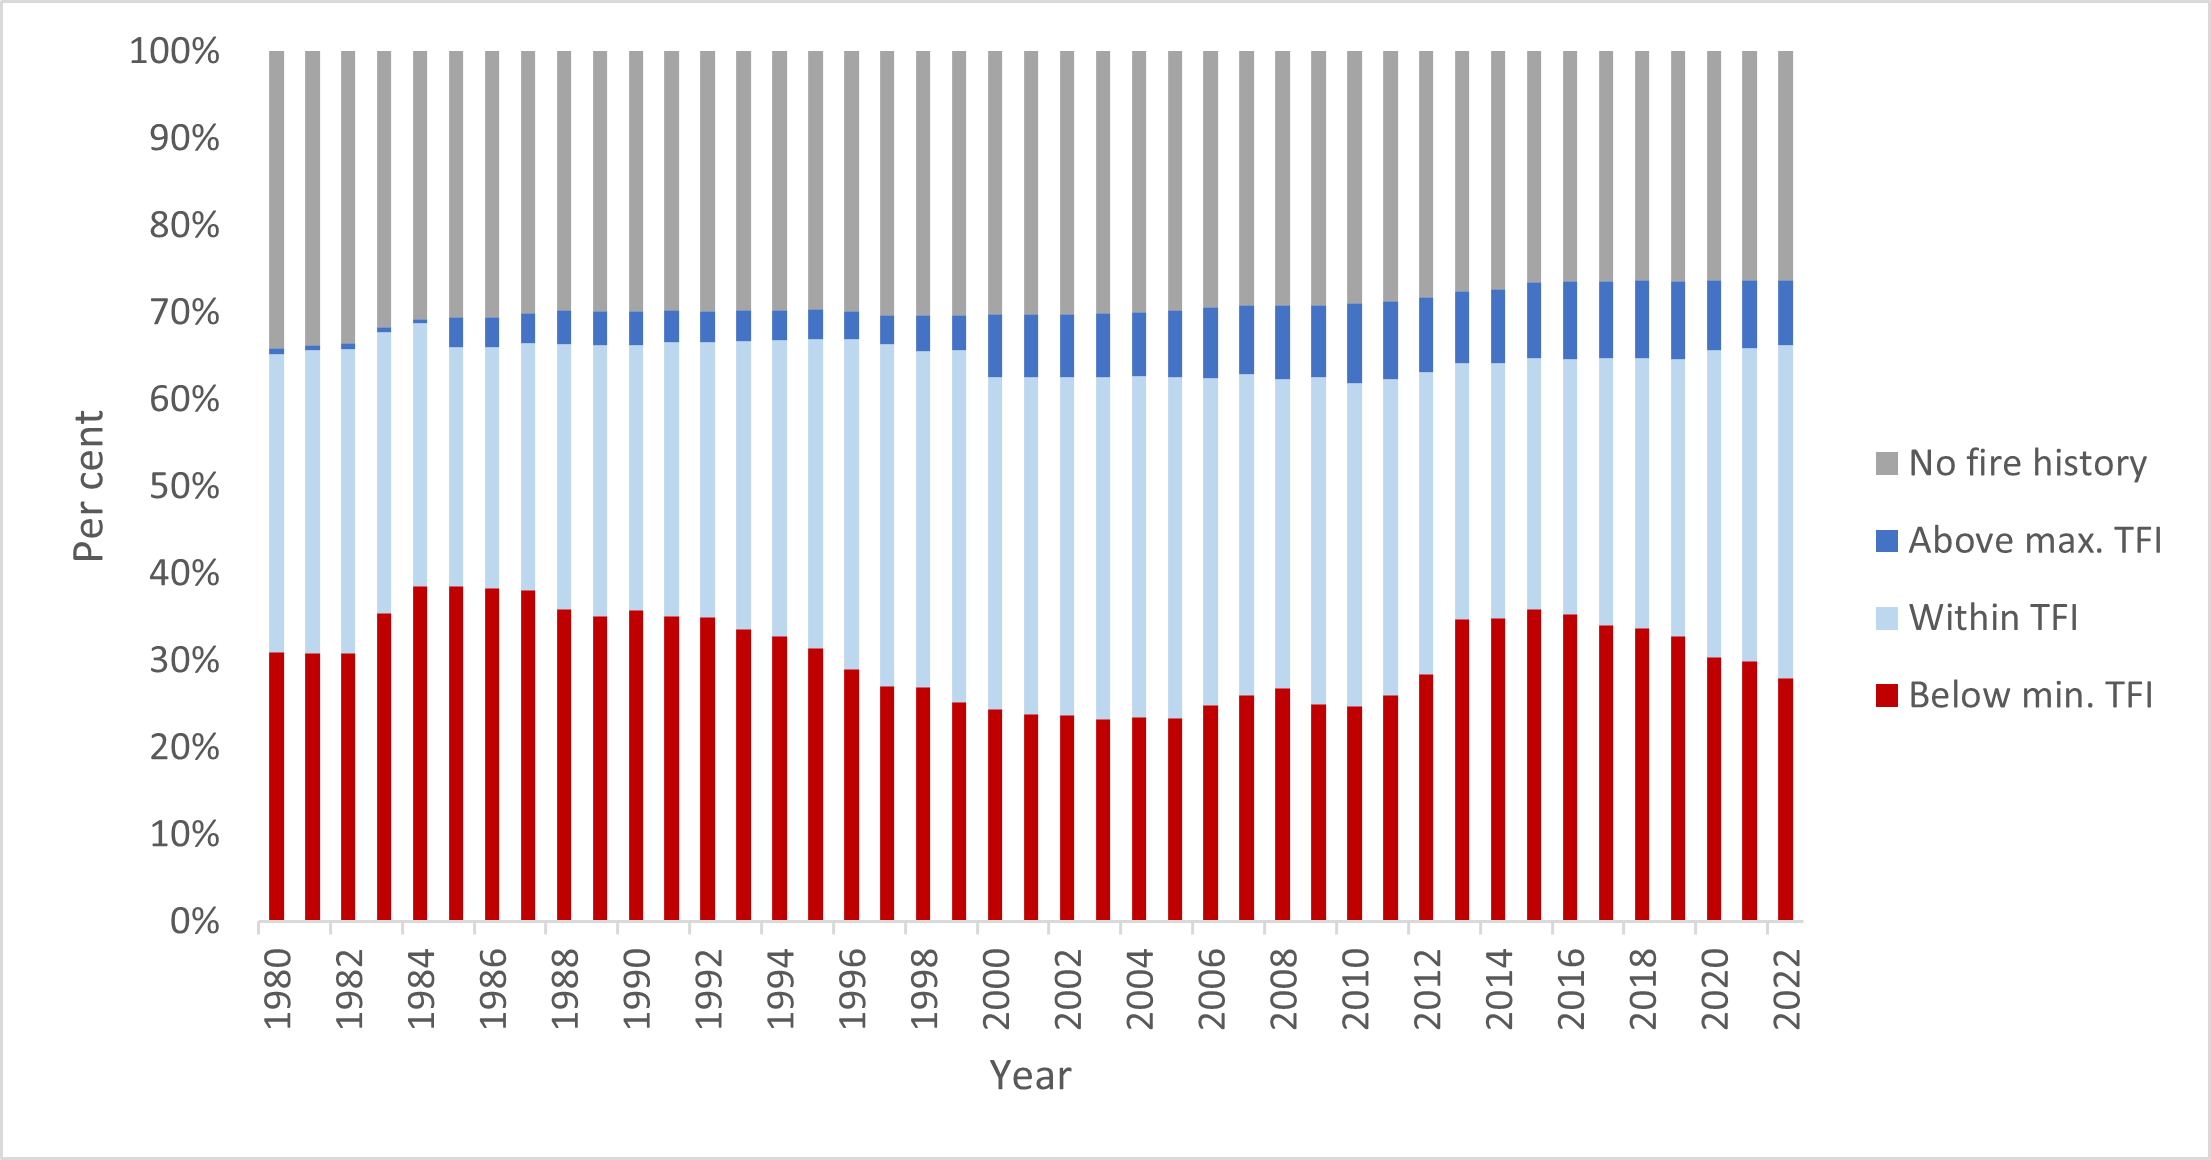
Figure 11 shows the tolerable fire interval (TFI) status of vegetation on public land in the Barwon South West region since 1980. It shows that in 2021–22:
- 28% of vegetation was below minimum TFI, 2% lower than in 2020–21
- 38% of vegetation was within TFI, 2% higher than in 2020–21
- the proportion of vegetation above maximum TFI remained stable at 8%.
These figures continue the positive trend of post-fire regeneration since 2015, supported by fire management strategies that aim to minimise the impacts of fuel management on species abundance, while improving ecological resilience with ecological burning.
Across the region, less than 1% of the vegetation burnt by bushfire or planned burning was below minimum TFI.
Figure 11: TFI status of vegetation on public land, Barwon South West region, 1980–2022. Data aligns with financial year.
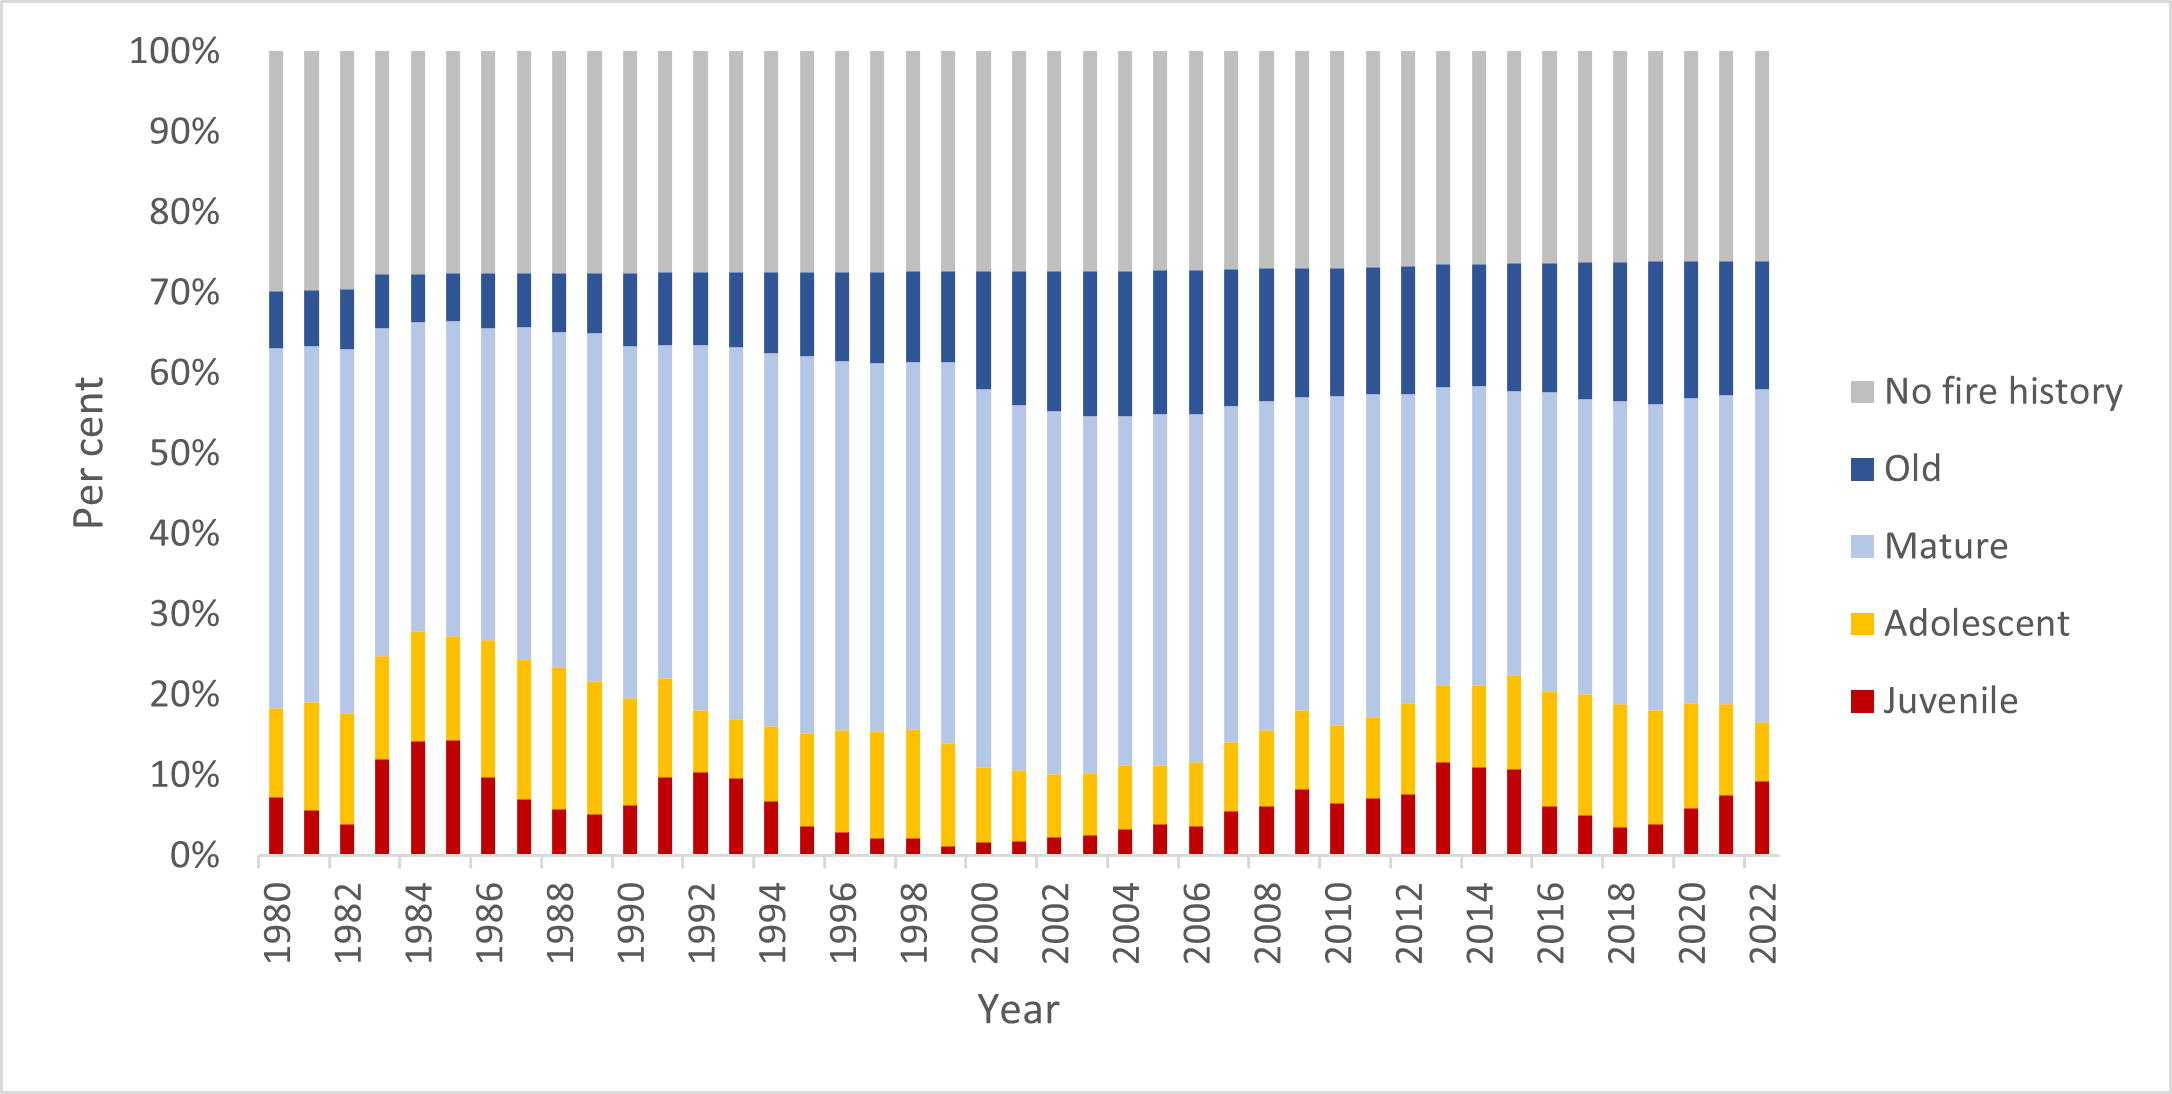
Figure 12 shows the growth stage structure (GSS) status of vegetation on public land in the Barwon South West region since 1980. It shows that in 2021–22:
- 9% of vegetation was in the juvenile growth stage, 1% higher than in 2020–21
- 7% of vegetation was in the adolescent growth stage, 4% lower than in 2020–21
- 16% of vegetation was in the old growth stage, 1% lower than in 2020–21
- 41% of vegetation was in the mature growth stage, 2% higher than in 2020–21.
Figure 12: GSS status of vegetation on public land, Barwon South West region, 1980–2022. Data aligns with financial year.
Fuel management delivery
The positive trends in bushfire risk reduction and ecosystem resilience reflect carefully considered fire management strategies – including ecological burning. The strategies aim to minimise both bushfire risk and the impacts of fuel management activities on ecosystem resilience.
During 2021–22, the Otway Fire District treated 13,504 hectares by planned burning district, while Far South West District treated 5,651 hectares.
Table 12 summarises the Barwon South West region’s fuel management activities in 2021–22.
Table 12: Fuel management activities, Barwon South West region, 2021–22
| Fuel reduction | Number of treatments | Hectares |
|---|---|---|
|
Area treated by planned burning Ecological burns: 550 hectares (6 burns) Fuel reduction burns: 18,510 hectares (49 burns) Other burns: 0.5 hectares (5 burns) |
60 | 19,060 |
|
Area treated by non-burn fuel treatments Mechanical mulching: 40 hectares (9 treatments) Mechanical slashing or mowing: 623 hectares (75 treatments) Other methods: 13 hectares (2 treatments) |
86 | 677 |
| Total area treated to reduce bushfire risk | 146 | 19,737 |
During the 2021–22 season, an easterly weather influence (from La Niña) delayed the drying of fuels along the coast, especially near Wye River and Lorne.
FFMVic adapted to the weather conditions and focused efforts where suitable fuels were available, resulting in a solid season with great risk reduction outcomes in the Otways region. At times the Otways District was supported by up to six Task Forces (approximately 132 personnel) from other parts of the state, in addition to significant support from the Burn Management Team. The program has a made a significant contribution to reducing risk to small communities such as Gellibrand and Forrest.
FFMVic also undertook several significant planned burns to reduce the spread of fires north of Aireys Inlet and Anglesea and north of the Otways. This will help protect coastal communities, and reduce the bushfire risk to the more sensitive wet forests and water catchments.
Far South West District was able to make use of burn windows successfully. Of note was the large program delivered in southern areas with priority burns in the Cobboboonee National Park.
The Barwon South West fuel management program took a 365-day approach, which involved planned burning and mechanical fuel treatments, and taking advantage of suitable winter burning conditions in heathlands. This resulted in great patchy burn outcomes. Without this approach, the significant level of risk reduction would not have been achieved.
Cultural burning
3 Traditional Owner led cultural burns were supported by Barwon South West in 2021–22.
Gippsland
Fuel-driven bushfire risk
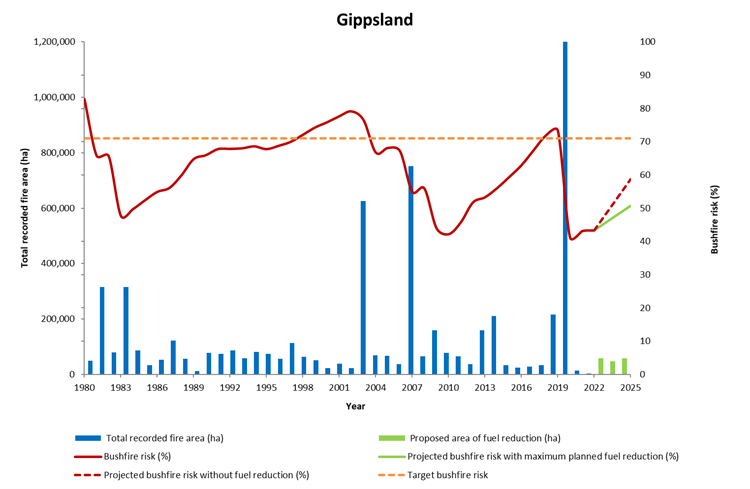
Gippsland’s long-term regional planning target is to maintain fuel-driven bushfire risk at or below 71% of maximum levels.
Fuel-driven bushfire risk in the Gippsland region in 2021–22
- was 43% on 30 June 2022
- remained at 43% since the end of the 2020–21
- is projected to increase to 59% by 2025 in the absence of any fuel management activity or bushfires
- if implemented, the entire joint Fuel Management Program would keep risk levels below the Gippsland region's long-term regional planning target at 71%
- fell drastically in 2019–20, as major bushfires reduced fuel hazards, but these bushfires had significant impacts on property, industries and the environment.
Planned burning in Gippsland in 2021–22 maintained fuel-driven bushfire risk at 43%. Gippsland had a reduced planned burning season due to wet La Niña conditions in autumn, with most of the region staying wet.
Despite this, the Latrobe District dried out enough over the spring and late autumn period to complete priority planned burns.
These included several key burns on the public–private land interface, and some complex burns close to the Mirboo North township and Tidal River campground.
Figure 13 shows the Gippsland region’s bushfire risk profile for 1980 to 2022 and projected changes in bushfire risk until 2025.
Figure 13: Bushfire risk profile, Gippsland region, 1980–2025. Data aligns with financial year.
Ecosystem resilience
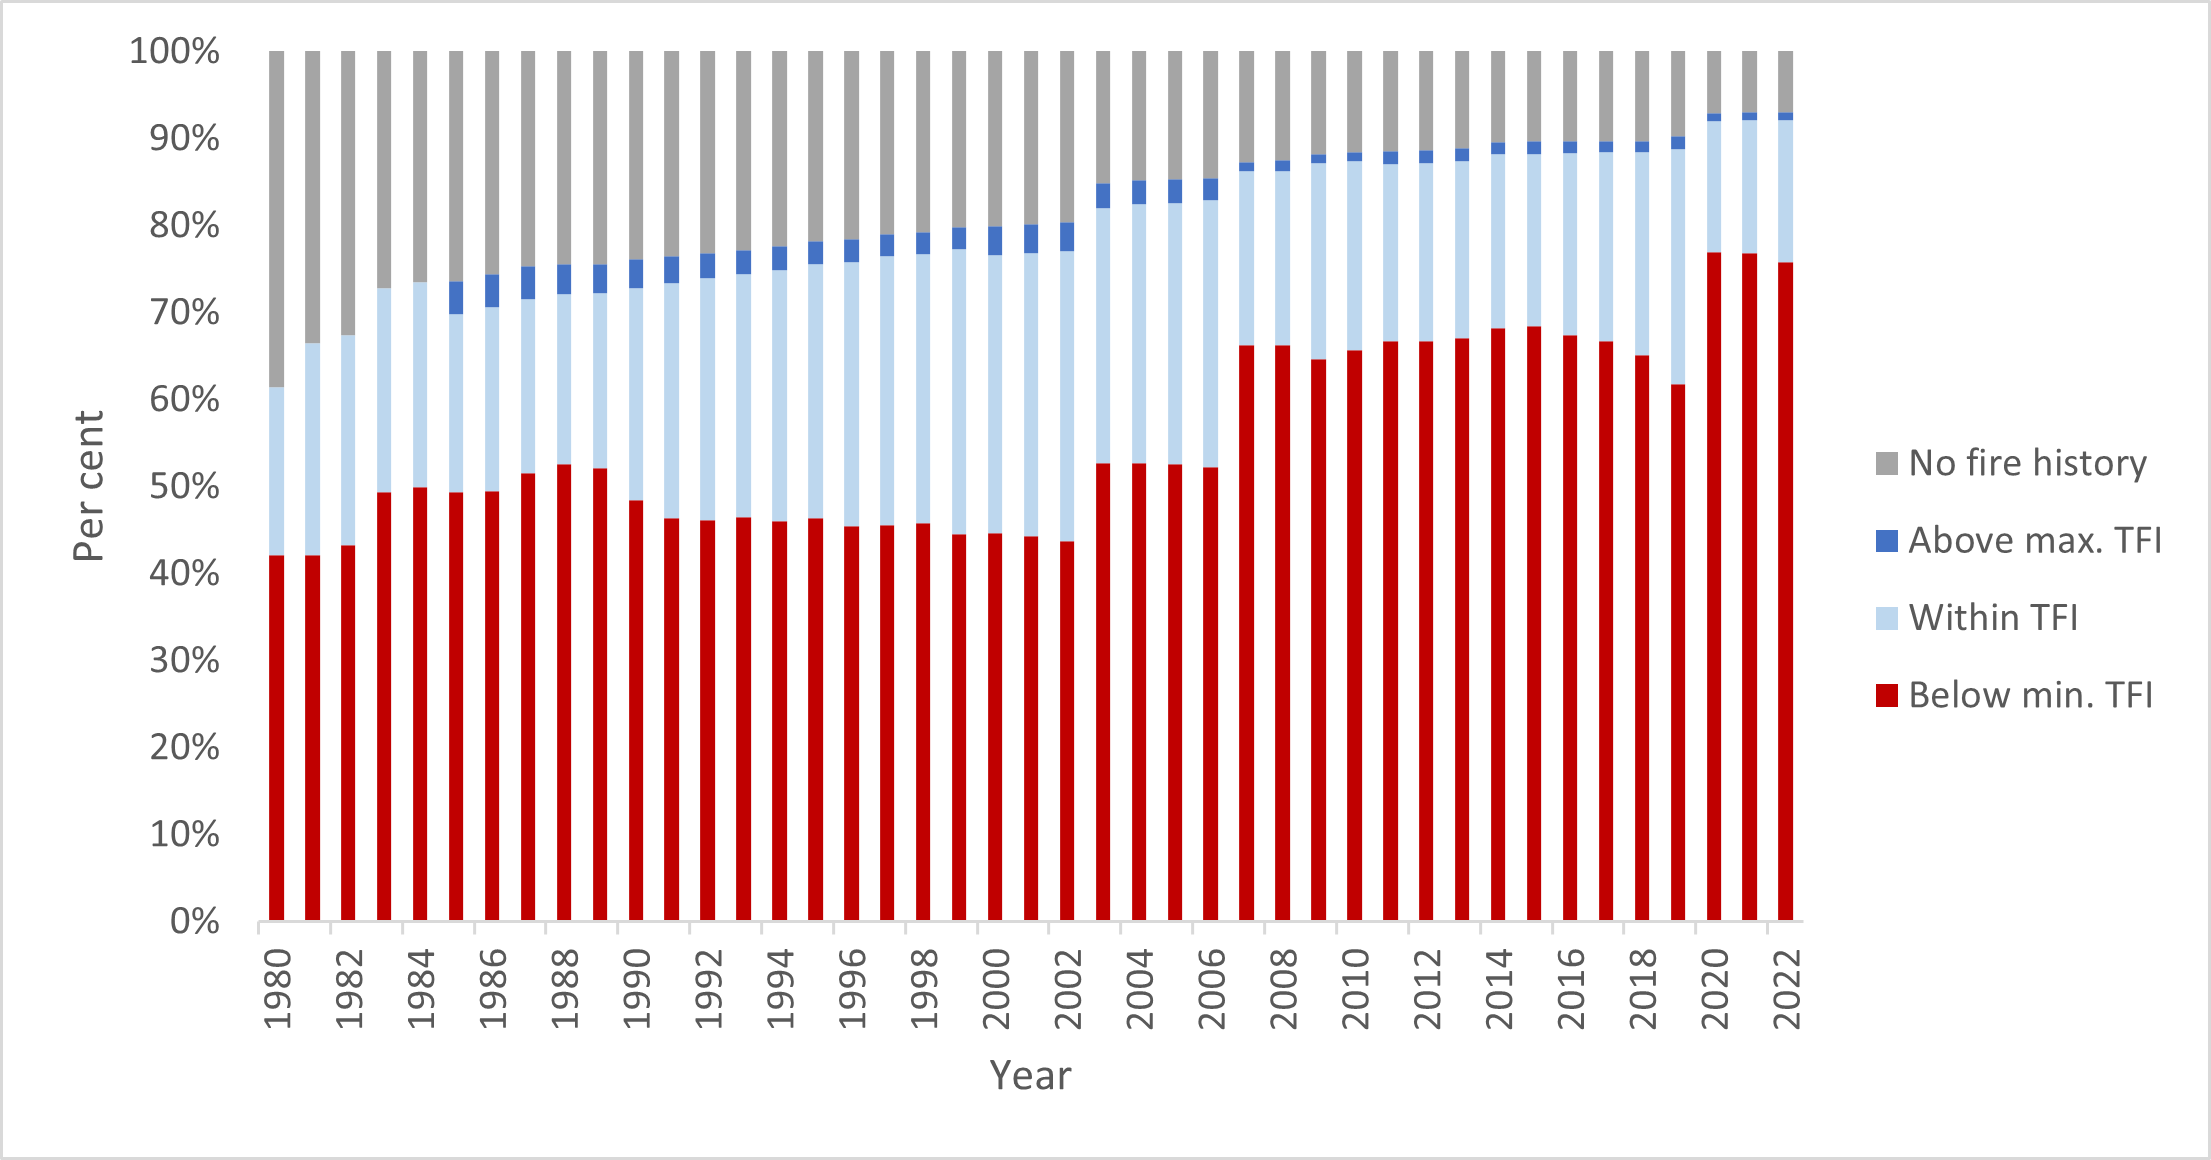
Figure 14 shows the tolerable fire interval (TFI) status of vegetation on public land in the Gippsland region since 1980. It shows that in 2021–22:
- 76% of vegetation was below minimum TFI, reflecting the significant area of public land burnt in the 2019-20 Black Summer bushfires
- 1% lower than the previous reporting period
- 16% of vegetation was within TFI, 1% higher than in 2020–21
- the proportion of vegetation with no recorded fire history remained stable at 7%.
It is expected that a high proportion of vegetation on public land in Gippsland will remain below minimum TFI for years to come, due to the extensive bushfires in 2019–20 and the time it takes for recovering vegetation communities to reach their TFI.
Figure 14: TFI status of vegetation on public land, Gippsland region, 1980–2022. Data aligns with financial year.
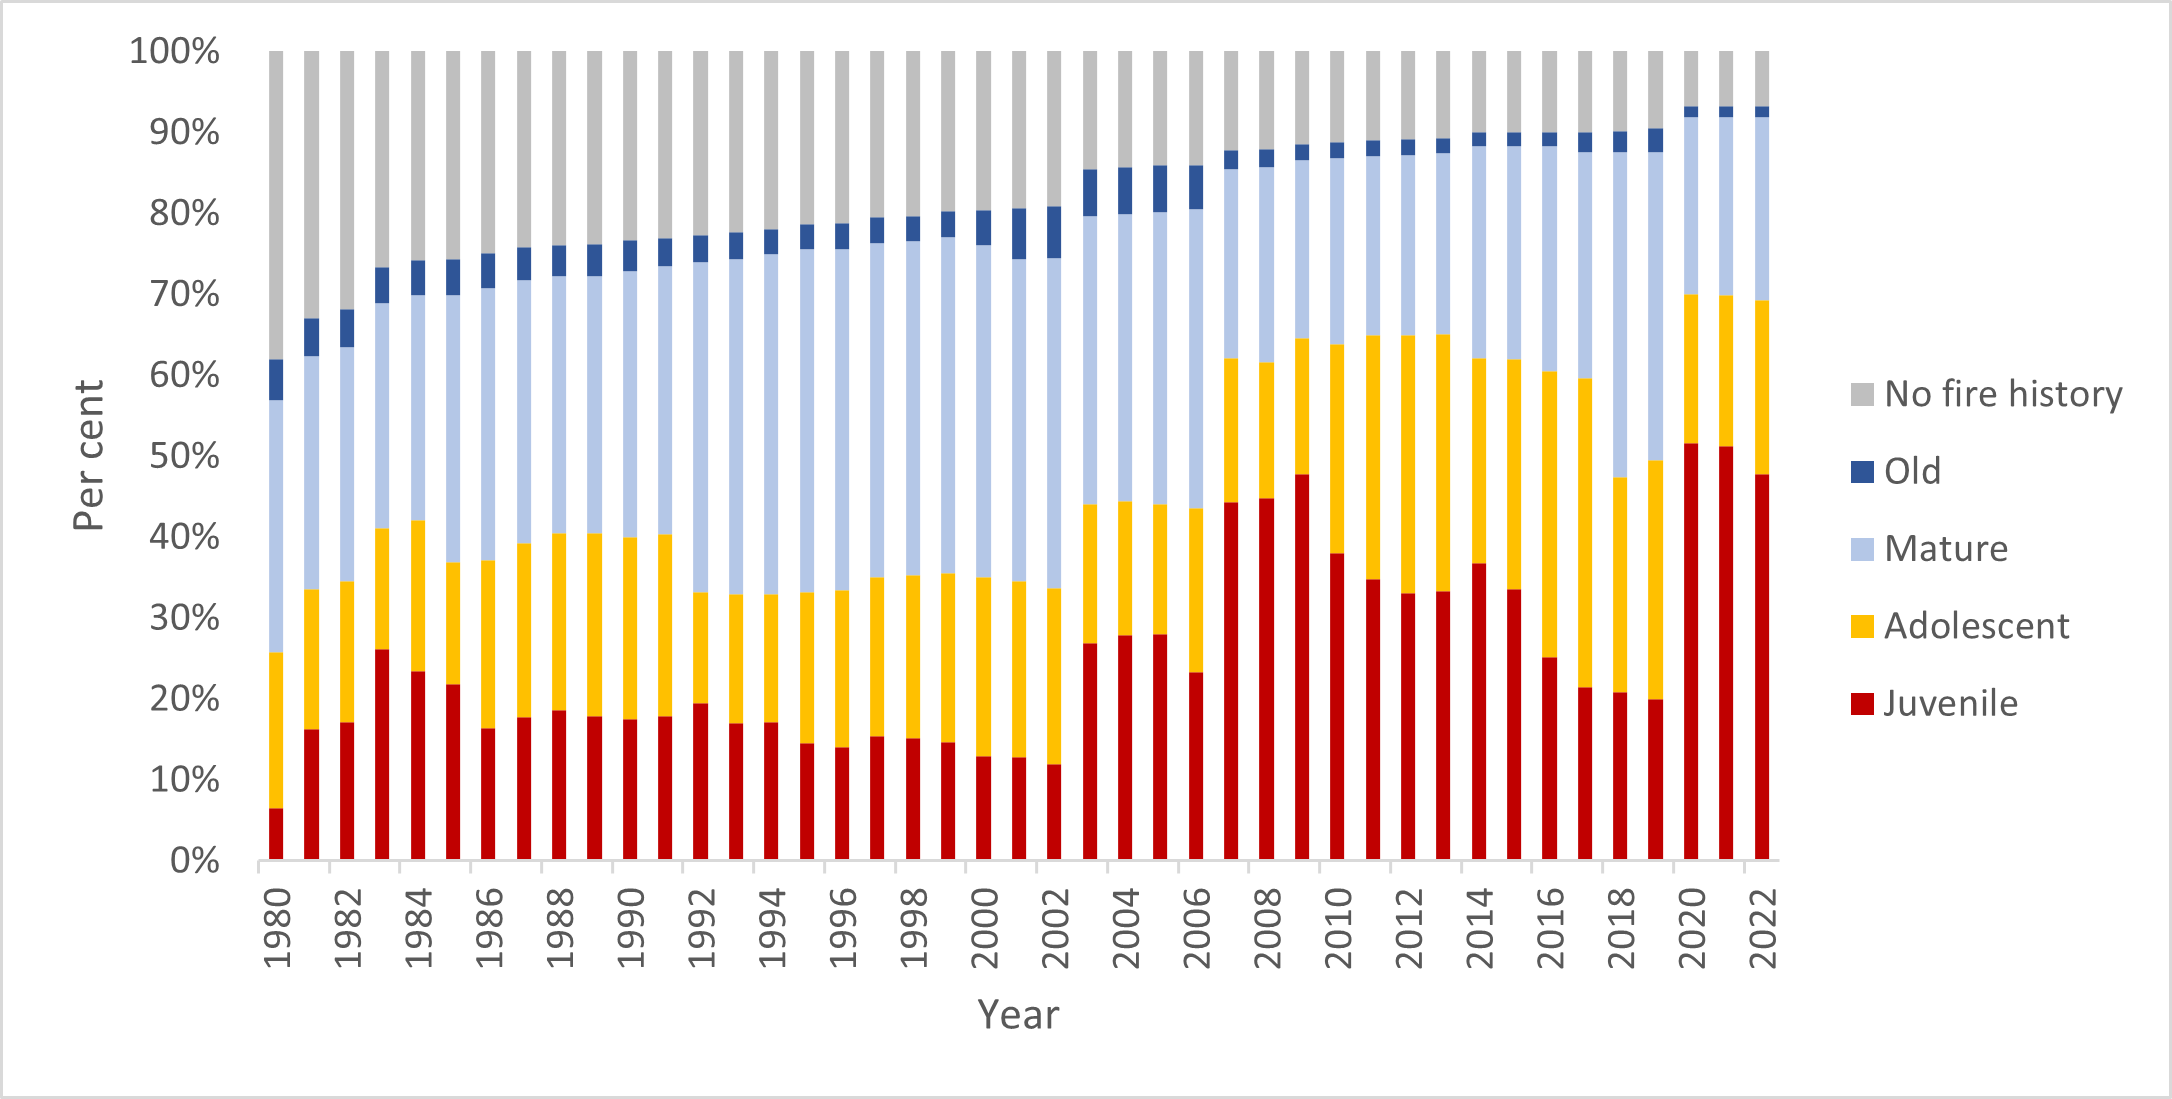
Figure 15 shows the growth stage structure (GSS) status of vegetation on public land in the Gippsland region since 1980. It shows that in 2021–22:
- 48% of vegetation was in the juvenile growth stage, 3% lower than in 2020–21
- 22% of vegetation was in the adolescent growth stage, 3% higher than in 2020–21
- 23% of vegetation was in the mature growth stage, 1% higher than in 2020–21
- the proportion of vegetation in the old growth stage remained stable at 1%
- the proportion of vegetation with no recorded fire history remained stable at 7%.
The high proportion of vegetation in the juvenile growth stage reflects the landscape-scale bushfires of 2019–20. While there were modest improvements in the proportion of vegetation under TFI, it can be expected that vegetation in the juvenile and adolescent growth stages will form a dominant component of the growth stage structure on Gippsland’s public land for some years to come.
Figure 15: GSS status of vegetation on public land, Gippsland region, 1980–2022. Data aligns with financial year.
Fuel management delivery
For Gippsland regions, the careful application of fuel treatments resulted in positive trends in bushfire risk reduction and ecosystem resilience and reflect carefully considered fire management strategies, which aim to minimise both bushfire risk and the impacts of fuel management activities on ecosystem resilience.
During 2021–22, the Gippsland region treated 12,124 hectares. The total cost of the Gippsland fuel management program was $22.3 million.
Table 13 summarises the Gippsland region’s fuel management activities in 2021–22.
Table 13: Fuel management activities, Gippsland region, 2021–22
| Fuel reduction | Number of treatments | Hectares |
|---|---|---|
|
Area treated by planned burning Ecological burns: 888 hectares (5 burns) Fuel reduction burns: 8,002 hectares (25 burns) Other burns: 73 hectares (15 burns) |
45 | 8,963 |
|
Area treated by non-burn fuel treatments Mechanical mulching: 26 hectares (5 treatments) Mechanical slashing or mowing: 2,985 hectares (310 treatments) Other methods: 150 hectares (7 treatments) |
322 | 3,161 |
| Total area treated to reduce bushfire risk | 367 | 12,124 |
FFMVic undertook 45 planned burns that treated 8,963 hectares in the Gippsland region as part of the 2021–22 Joint Fuel Management Program. This included five ecological burns and 25 fuel reduction burns, and supporting one Traditional Owner-led burn in partnership with Gunaikurnai Land and Waters Aboriginal Corporation. An additional 3,161 hectares were treated by non-burn fuel treatments.
Because a La Niña event and a positive southern annular node (a climate driver that can influence rainfall and temperature) resulted in wet conditions, delivery of planned burns was limited across Macalister, Tambo, Snowy and parts of Latrobe District throughout 2021–22.
Conditions favourable for planned burning returned in spring and late autumn, allowing Latrobe District to deliver 17 planned burns and treat 6,007 hectares.
With limited opportunities for burning in the east of the region, Gippsland deployed 16 task forces to other regions to contribute to the statewide planned burn program.
Grampians
Fuel-driving bushfire risk
The Grampians’ long-term regional planning target is to maintain fuel-driven bushfire risk at or below 70% of maximum levels.
Fuel-driven bushfire risk in the Grampians region in 2021–22
- was 75% on 30 June 2022
- increased by 1% from 74% at the end of 2020–21
- is 5% higher than the long-term regional planning target of 70%
- is projected to increase 81% by 2025 in the absence of any fuel management activity bushfires
- if implemented, the entire Joint Fuel Management Program would get risk levels below the Grampians region's long-term regional planning target to 70%
Delivery of planned burns in the Grampians region in 2021–22 was impacted by the significant storm event that impacted the Wombat State Forest in June 2021.
This prevented the delivery of 18 planned burns as resources needed to be prioritised for emergency works to reopen the road network and undertake considerable additional preparation works for burns in the Midlands District prior to ignition.
However, the fuel management program for Midlands for 2021–22 also included additional mechanical mulching in high-priority areas such as Daylesford and its surrounds, which benefits risk reduction but has a small measurable contribution to the bushfire risk profile of the region.
FFMVic’s bushfire risk reduction program will need to focus on reducing fuel-driven bushfire risk in the Grampians region back to target levels, subject to other statewide priorities and suitable weather conditions.
Every year, FFMVic undertakes a detailed risk analysis to determine preparedness levels for bushfire suppression which determines the number and location of firefighters, aircraft and plant and equipment positioned in each district across the State.
In undertaking this analysis, FFMVic takes into consideration the fuel-driven bushfire risk levels, the season outlook, and local conditions. The level of fuel-driven bushfire risk in the Grampians region will inform this analysis.
Communities always have an important role to play in managing bushfire risk.
Communities in the Grampians region and other parts of the State can reduce their bushfire risk by preparing and practising their fire plans, abiding by relevant laws and regulations to prevent bushfires from starting, listening out for community warnings, and evacuating as advised.
Figure 16 shows the Grampians region’s risk profile from 1980 to 2022 and projected changes in fuel-driven risk until 2025. It shows fuel-driven bushfire risk in the Grampians region:
Figure 16: Fuel driven bushfire risk profile, Grampians region, 1980–2025. Data aligns with financial year
Ecosystem resilience
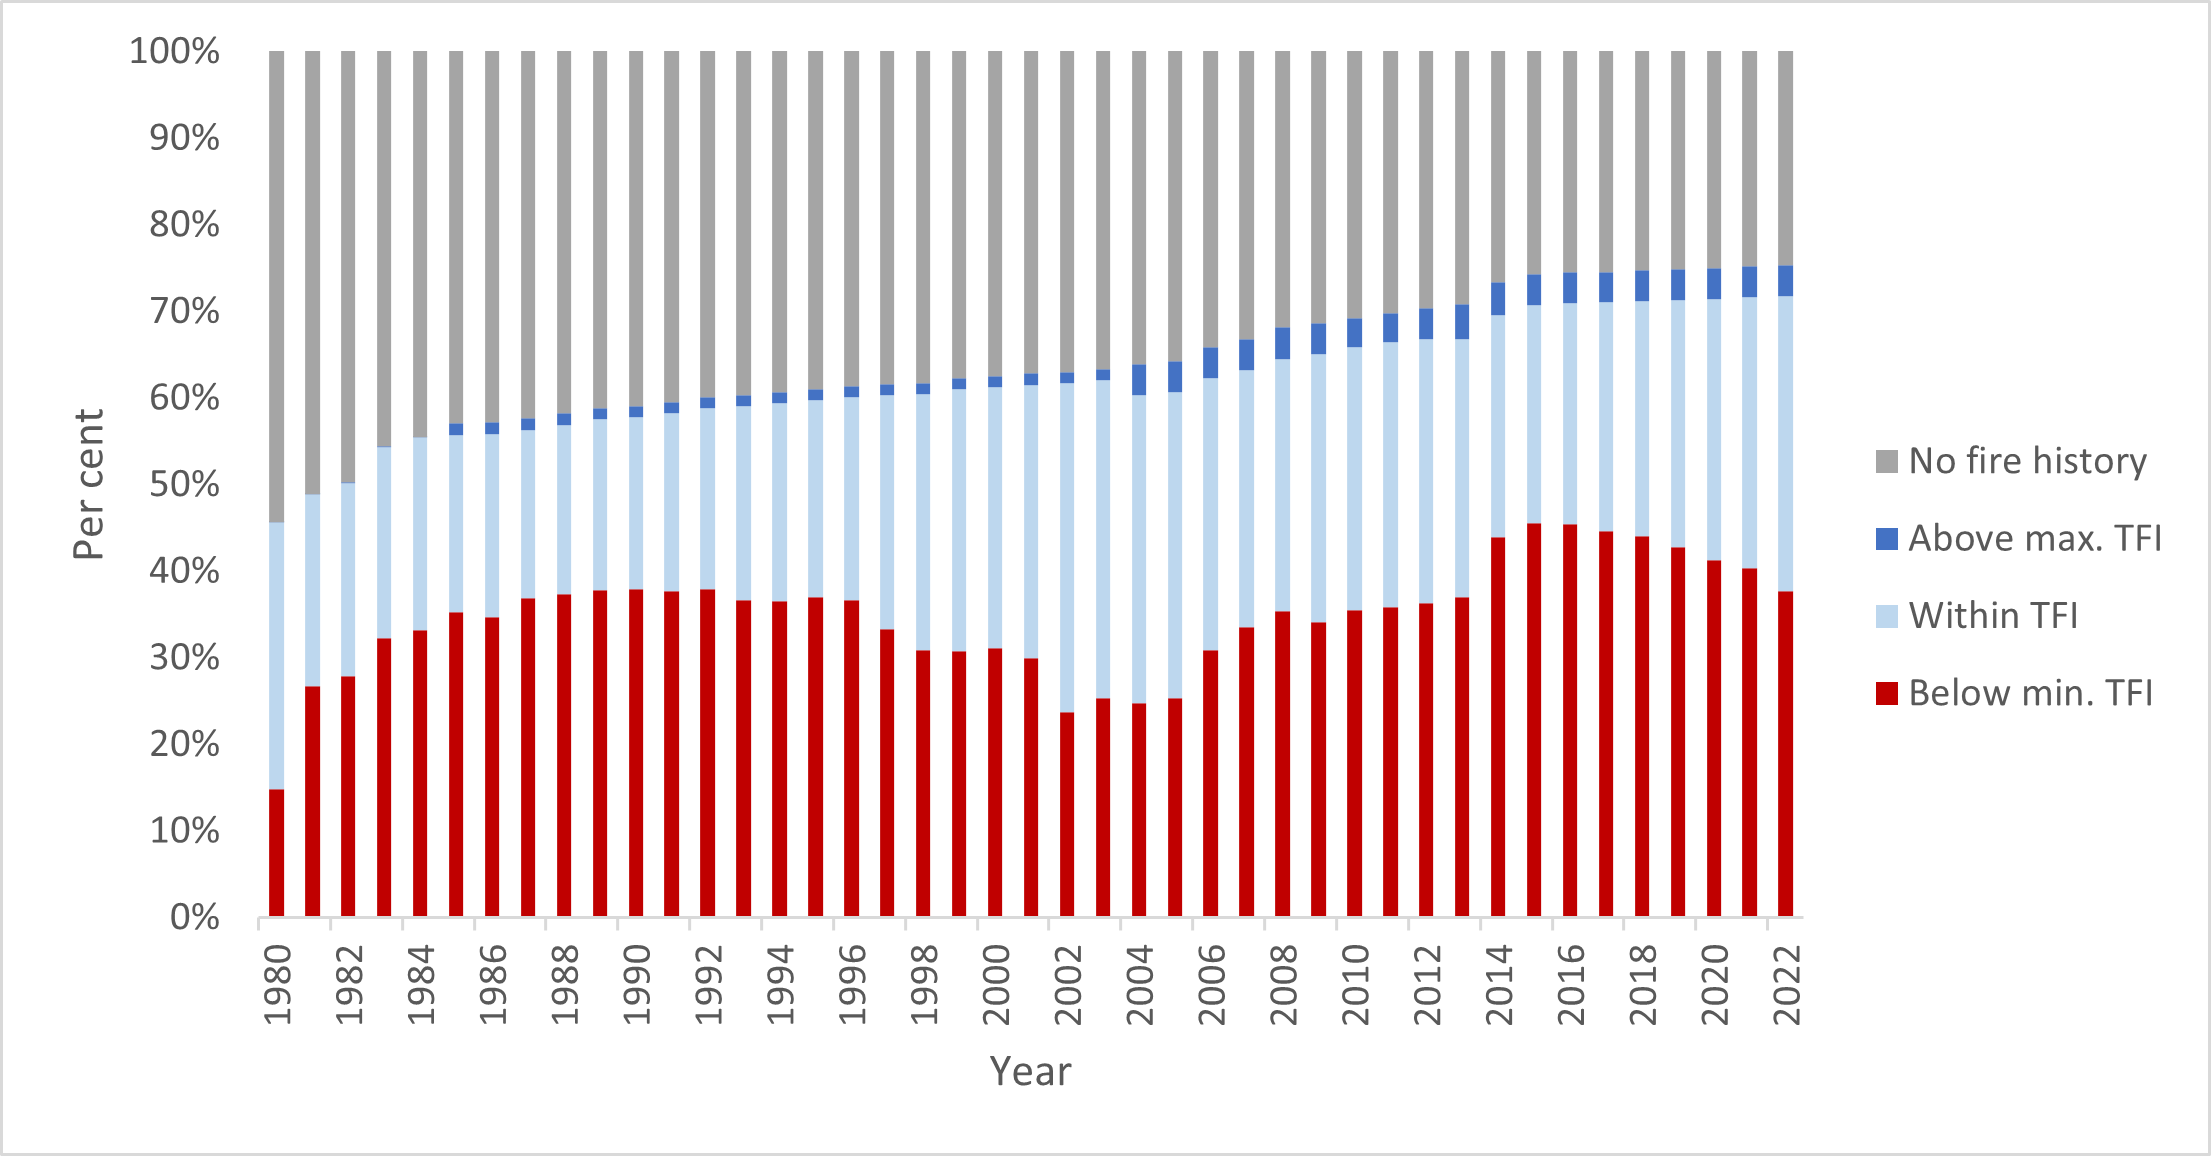
Figure 17 shows the tolerable fire interval (TFI) status of vegetation on public land in the Grampians region since 1980. It shows that at 30 June:
- 38% of vegetation was below minimum TFI, 3% higher than in 2020–21
- 34% of vegetation was within TFI, 3% higher than in 2020–21
- 4% of vegetation was above the maximum TFI
- the proportion of vegetation with no fire history remained stable at 25%.
In 2021–22, less than 1% of vegetation was impacted by bushfire or planned burning while under TFI, which was the same as the previous reporting period.
Much of the landscape remains below minimum TFI as areas regenerate after major bushfire events pre-2015 and slowly transition to older growth stages.
Figure 17 shows this as an increase in the proportion of vegetation below minimum TFI, from 35% to about 50% between 2004–05 and 2014–15. This is a consequence of major bushfires in the Grampians National Park in 2006, 2013, and 2014, as well as in the region’s west in 2006 and 2012.
Figure 17: TFI status of vegetation on public land, Grampians region, 1980–2022. Data aligns with financial year.
Figure 18 shows the growth stage structure (GSS) status of vegetation on public land in the Grampians region since 1980. It shows that at 30 June 2022:
- the proportion of vegetation in the juvenile growth stage remained stable at 7%
- 21% of vegetation was in the adolescent growth stages, 2% lower than in 2020–21
- 38% of vegetation was in the mature growth stages, 2% higher than in 2020–21
- the proportion of vegetation in the old growth stage remained stable at 6%
- the proportion of vegetation with no recorded fire history remained stable at 28%.
The changes in growth stages show the slow recovery of vegetation from the impact of major bushfires over the past two decades, with vegetation transitioning out of younger age classes into the mature class since 2015–16.
Figure 18: GSS status of vegetation on public land, Grampians region 1980–2022. Data aligns with financial year.

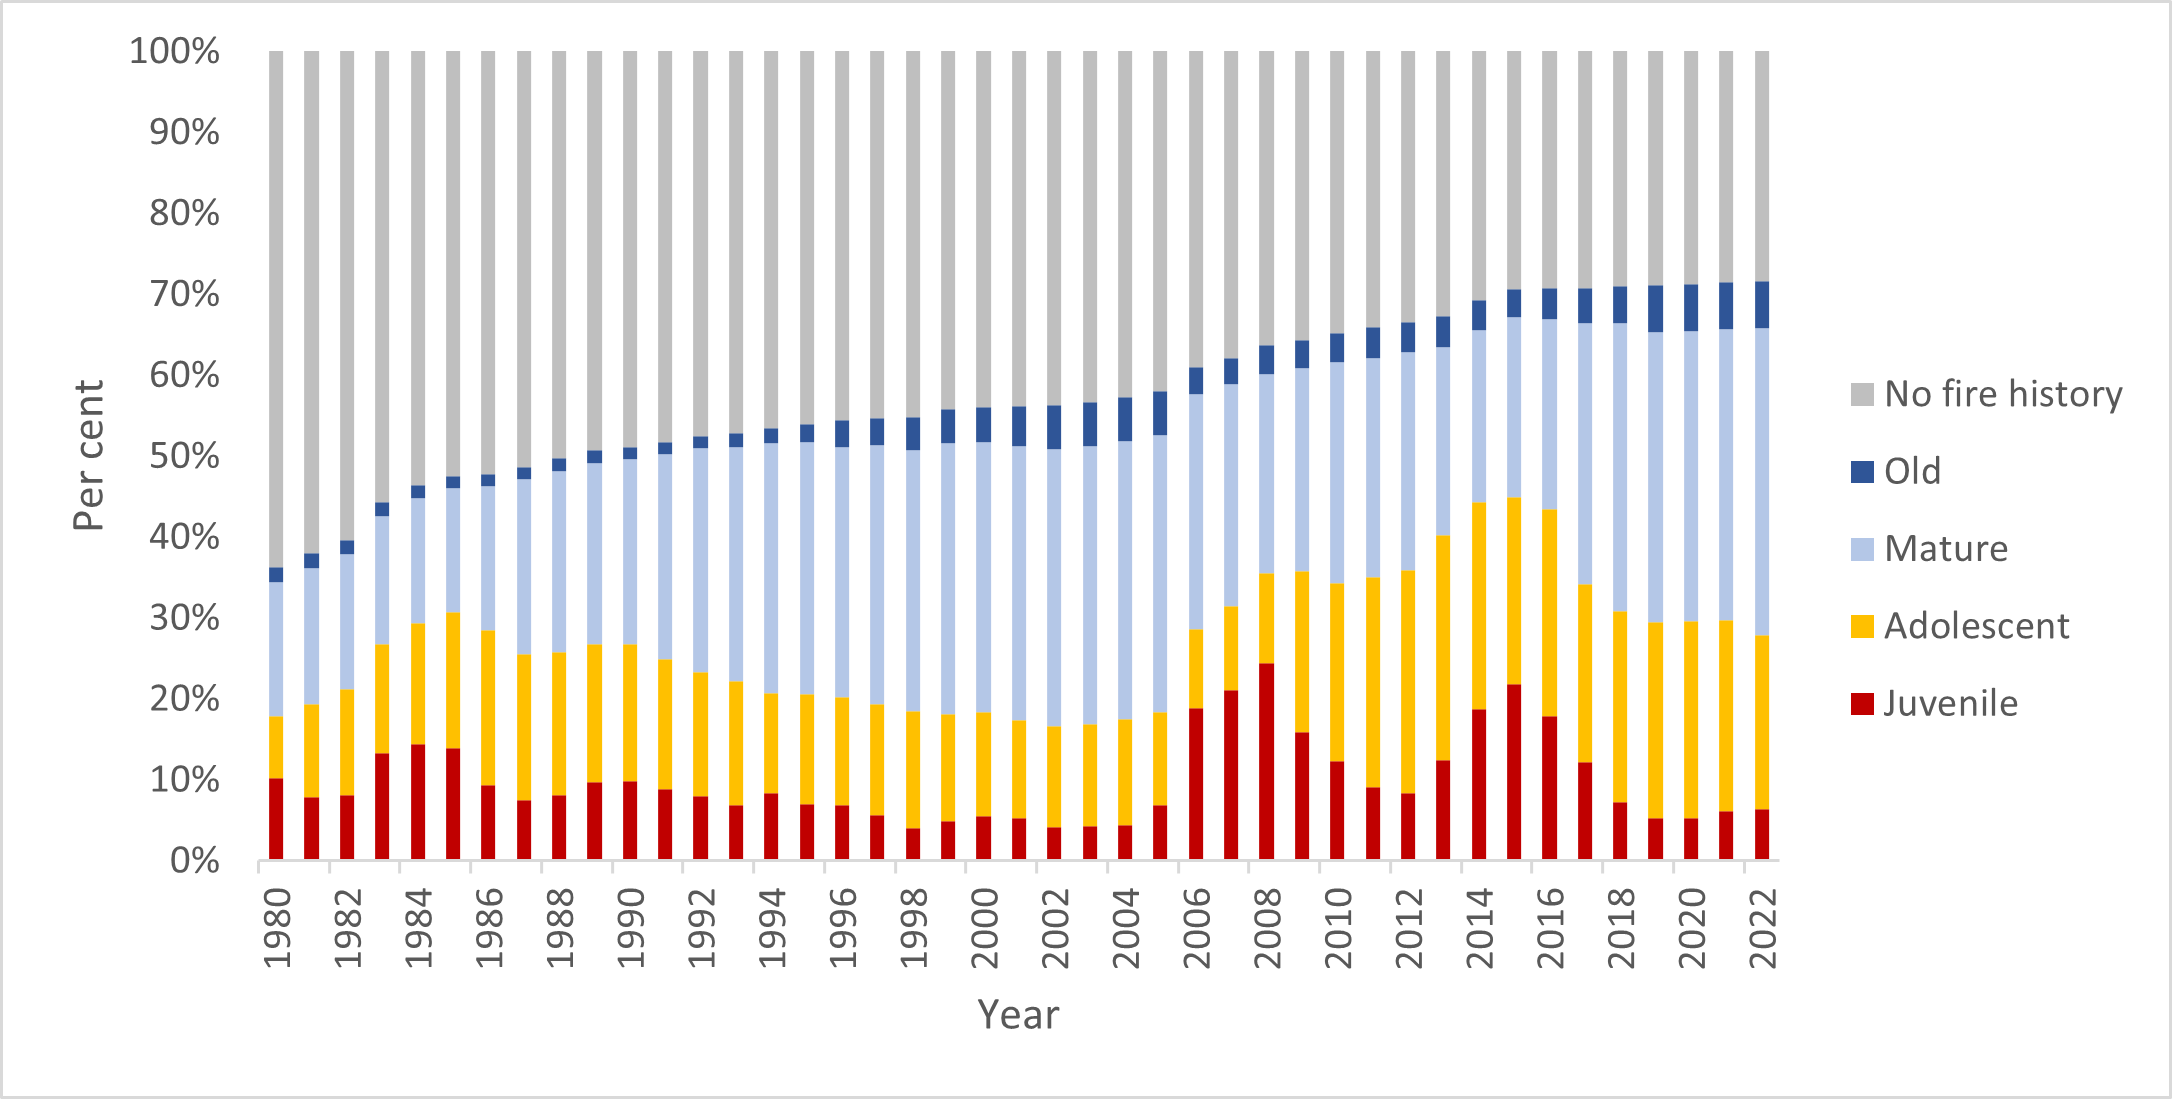
Fuel management delivery
The positive trends in risk reduction and ecosystem resilience reflect carefully considered bushfire management strategies. The strategies aim to minimise both fuel-driven bushfire risk and the impacts of fuel management activities on ecosystem resilience.
During 2021–22, the Grampians region treated 14,815 hectares. This included 6 cross-tenure burns delivered with the CFA. The total cost of the Grampians fuel management program was $13.0 million.
Table 14 summarises the Grampians region’s fuel management activities in 2021–22.
Table 14: Fuel management activities, Grampians region, 2021–22
| Fuel reduction | Number of treatments | Hectares |
|---|---|---|
|
Area treated by planned burning Ecological burns: 136 hectares (4 burns) Fuel reduction burns: 11,410 hectares (39 burns) Other burns: 0.2 hectares (2 burns) |
45 | 11,547 |
|
Area treated by non-burn fuel treatments Mechanical mulching: 96 hectares (14 treatments) Mechanical slashing or mowing: 3,096 hectares (292 treatments) Other methods: 76 hectares (12 treatments) |
318 | 3,268 |
| Total area treated to reduce bushfire risk | 363 | 14,815 |
The Midlands District had a truncated planned burning season because of wetter-than-usual conditions from La Niña and storm impacts during autumn.
Major storm damage in the Wombat Forest required significant recovery works, so the focus moved from planned burn preparations to road access and community safety, with staff safety in conducting these works a compounding issue.
Midlands focused on burning in high-risk areas, including Blackwood, Daylesford and Macedon. In addition, there was focus on cross-tenure burning with Country Fire Authority partners, with excellent results in the Wheatsheaf Fire Scape Project area and Dereel.
The Wimmera District continued to reintroduce planned burns into fire scars from a series of large-scale bushfires between 2006 and 2014. These burns aim to create a mosaic of different age classes in vegetation to promote ecosystem resilience while reducing the risk of future large-scale bushfires in the park.
These burns also protect communities around the Grampians (Gariwerd) National Park, including Halls Gap and Pomonal. The district manages risk to the communities of Edenhope and Nhill through regular fuel reduction burns.
Cultural burning
5 Traditional Owner-led cultural burns were supported by the Grampians region in 2021–22.
Hume
Fuel-driven bushfire risk
Hume’s long-term regional planning target is to maintain fuel-driven bushfire risk at or below 69% of maximum levels.
Fuel-driven bushfire risk in the Hume region in 2021–22
- was 67% at 30 June 2022
- remained at 67% since the end of 2020–21
- is projected to increase to 78% by 2025 in the absence of any fuel management activity or bushfires, and
- if implemented, the entire Joint Fuel Management Program would keep fuel-driven bushfire risk levels below the Hume region's long-term regional planning target of 69%.
Fuel reduction activity in 2021–22 was substantial across the region’s four districts and kept fuel-driven bushfire risk below the long-term regional planning target.
Figure 19 shows the Hume region’s risk profile for 1980 to 2022 and projected changes in fuel-driven bushfire risk until 2025. It shows fuel-driven bushfire risk in the Hume region.
Figure 19: Fuel driven bushfire risk profile, Hume region, 1980–2025. Data aligns with financial year.

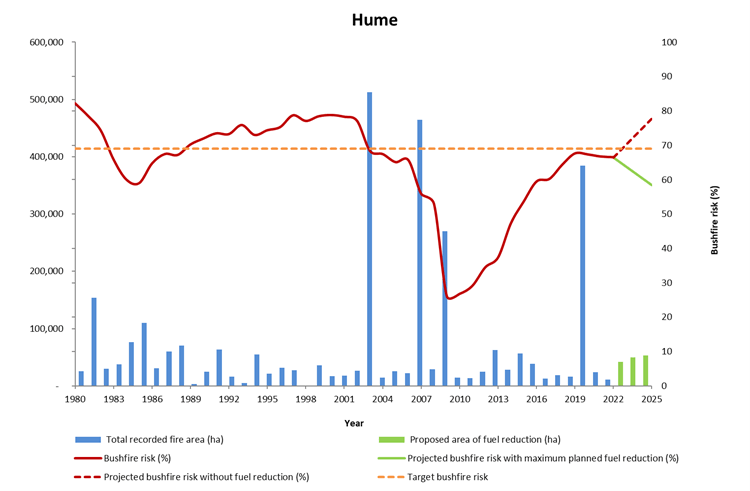
Ecosystem resilience
Figure 20 shows the tolerable fire interval (TFI) status of vegetation on public land in the Hume region since 1980. It shows that in 2021–22, proportions remained stable for vegetation:
- below minimum TFI, at 69%
- within TFI, at 17%
- above maximum TFI, at 1%.
In 2021–22, less than 1% of vegetation burnt by bushfire or planned burning was below minimum TFI. This was the result of careful planning to minimise the potential impacts of planned burns on vegetation below minimum TFI.
Figure 20: TFI status of vegetation on public land, Hume region, 1980–2022. Data aligns with financial year.
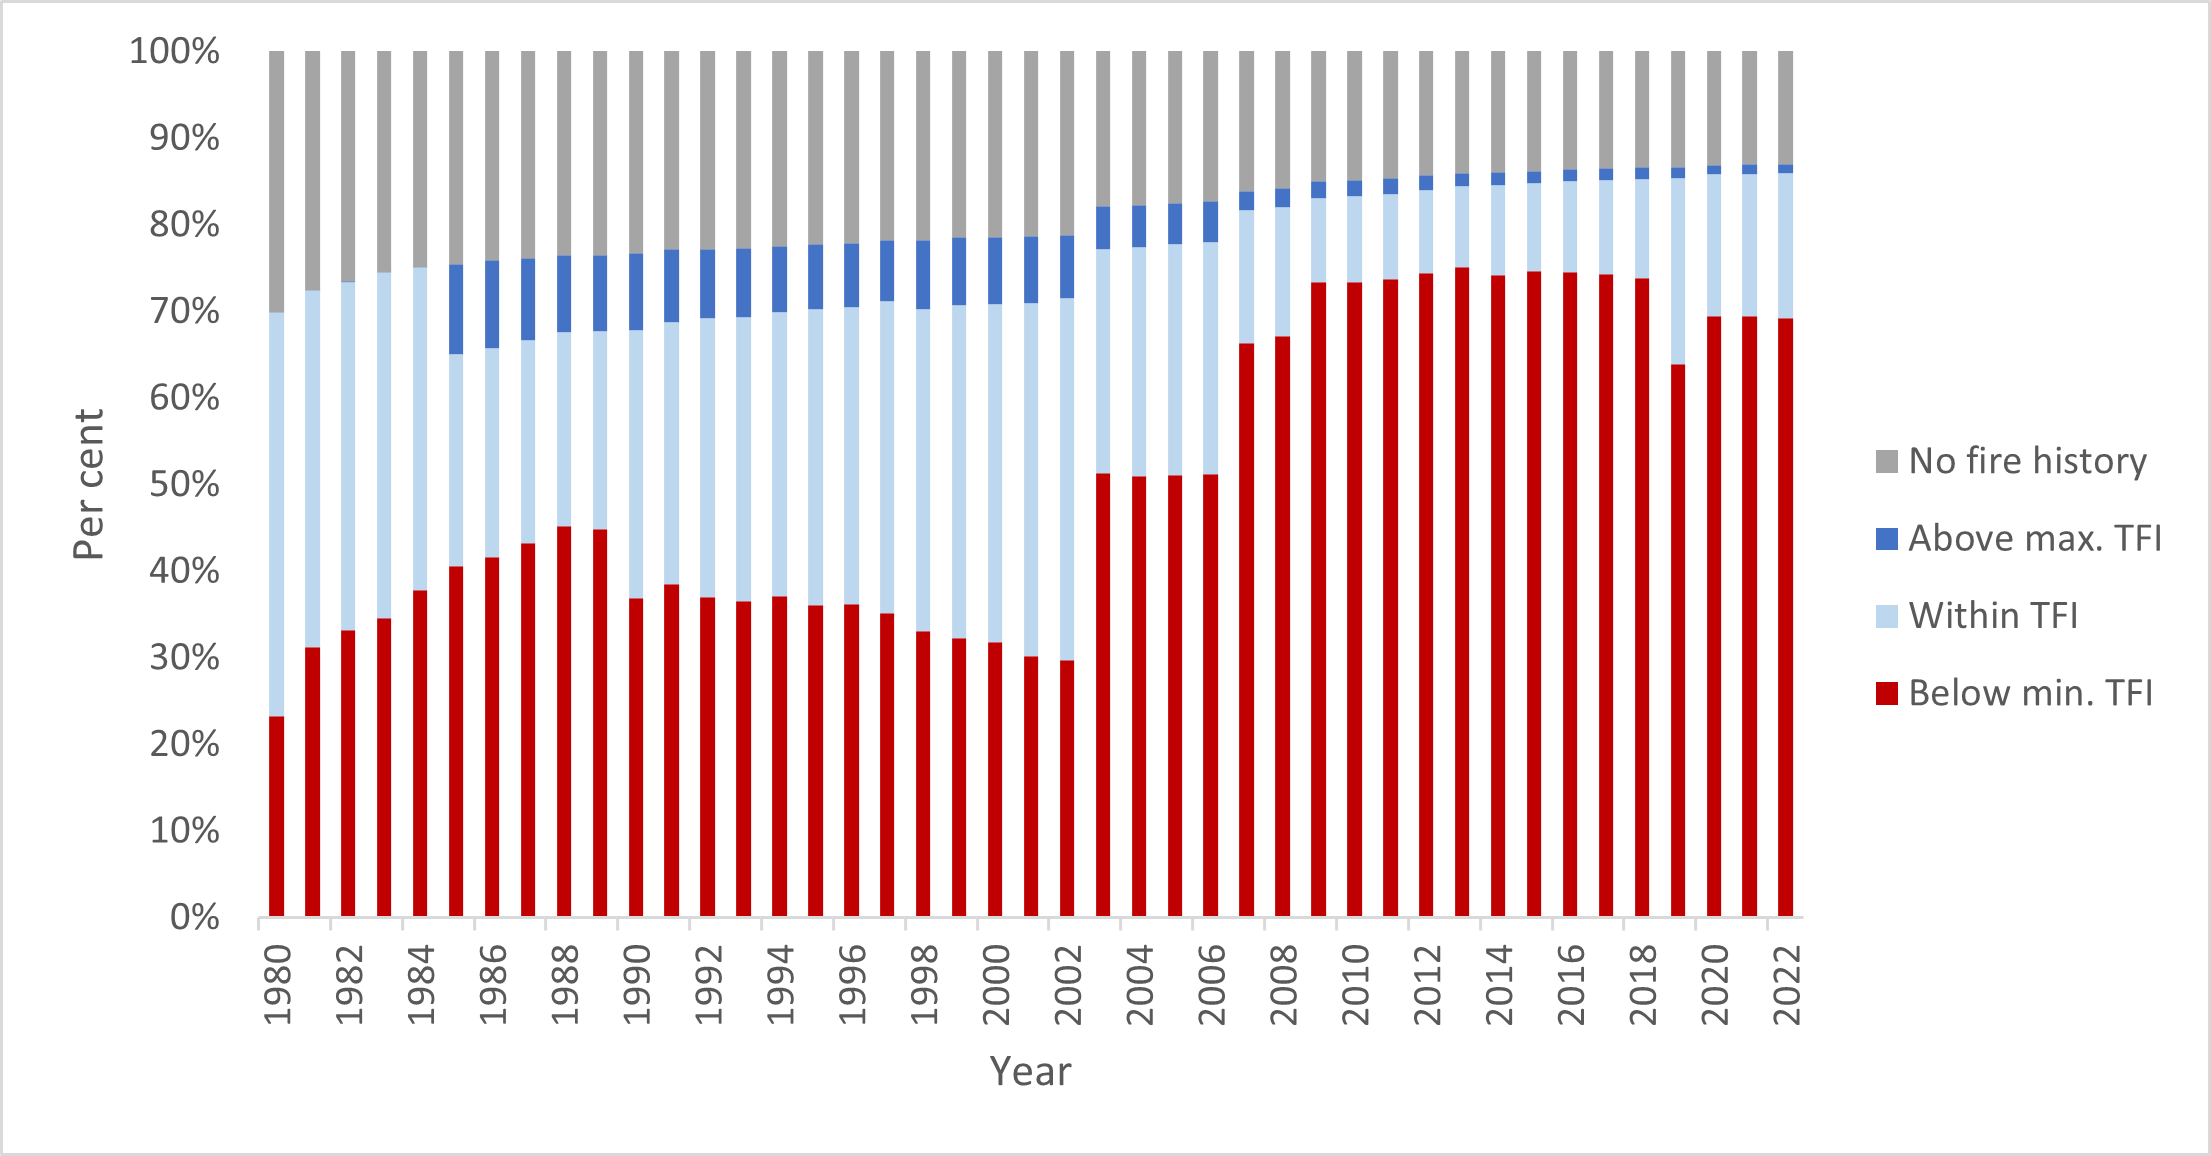
Figure 21 shows that in 2020–21 the proportion of vegetation remained stable for all growth stages at:
- 24% for the juvenile growth stage
- 27% for the adolescent growth stage
- 36% for the mature growth stage
- 2%for the old growth stage
- 11% for vegetation with no fire history.
Figure 21: GSS status of vegetation on public land, Hume region, 1980–2022. Data aligns with financial year.

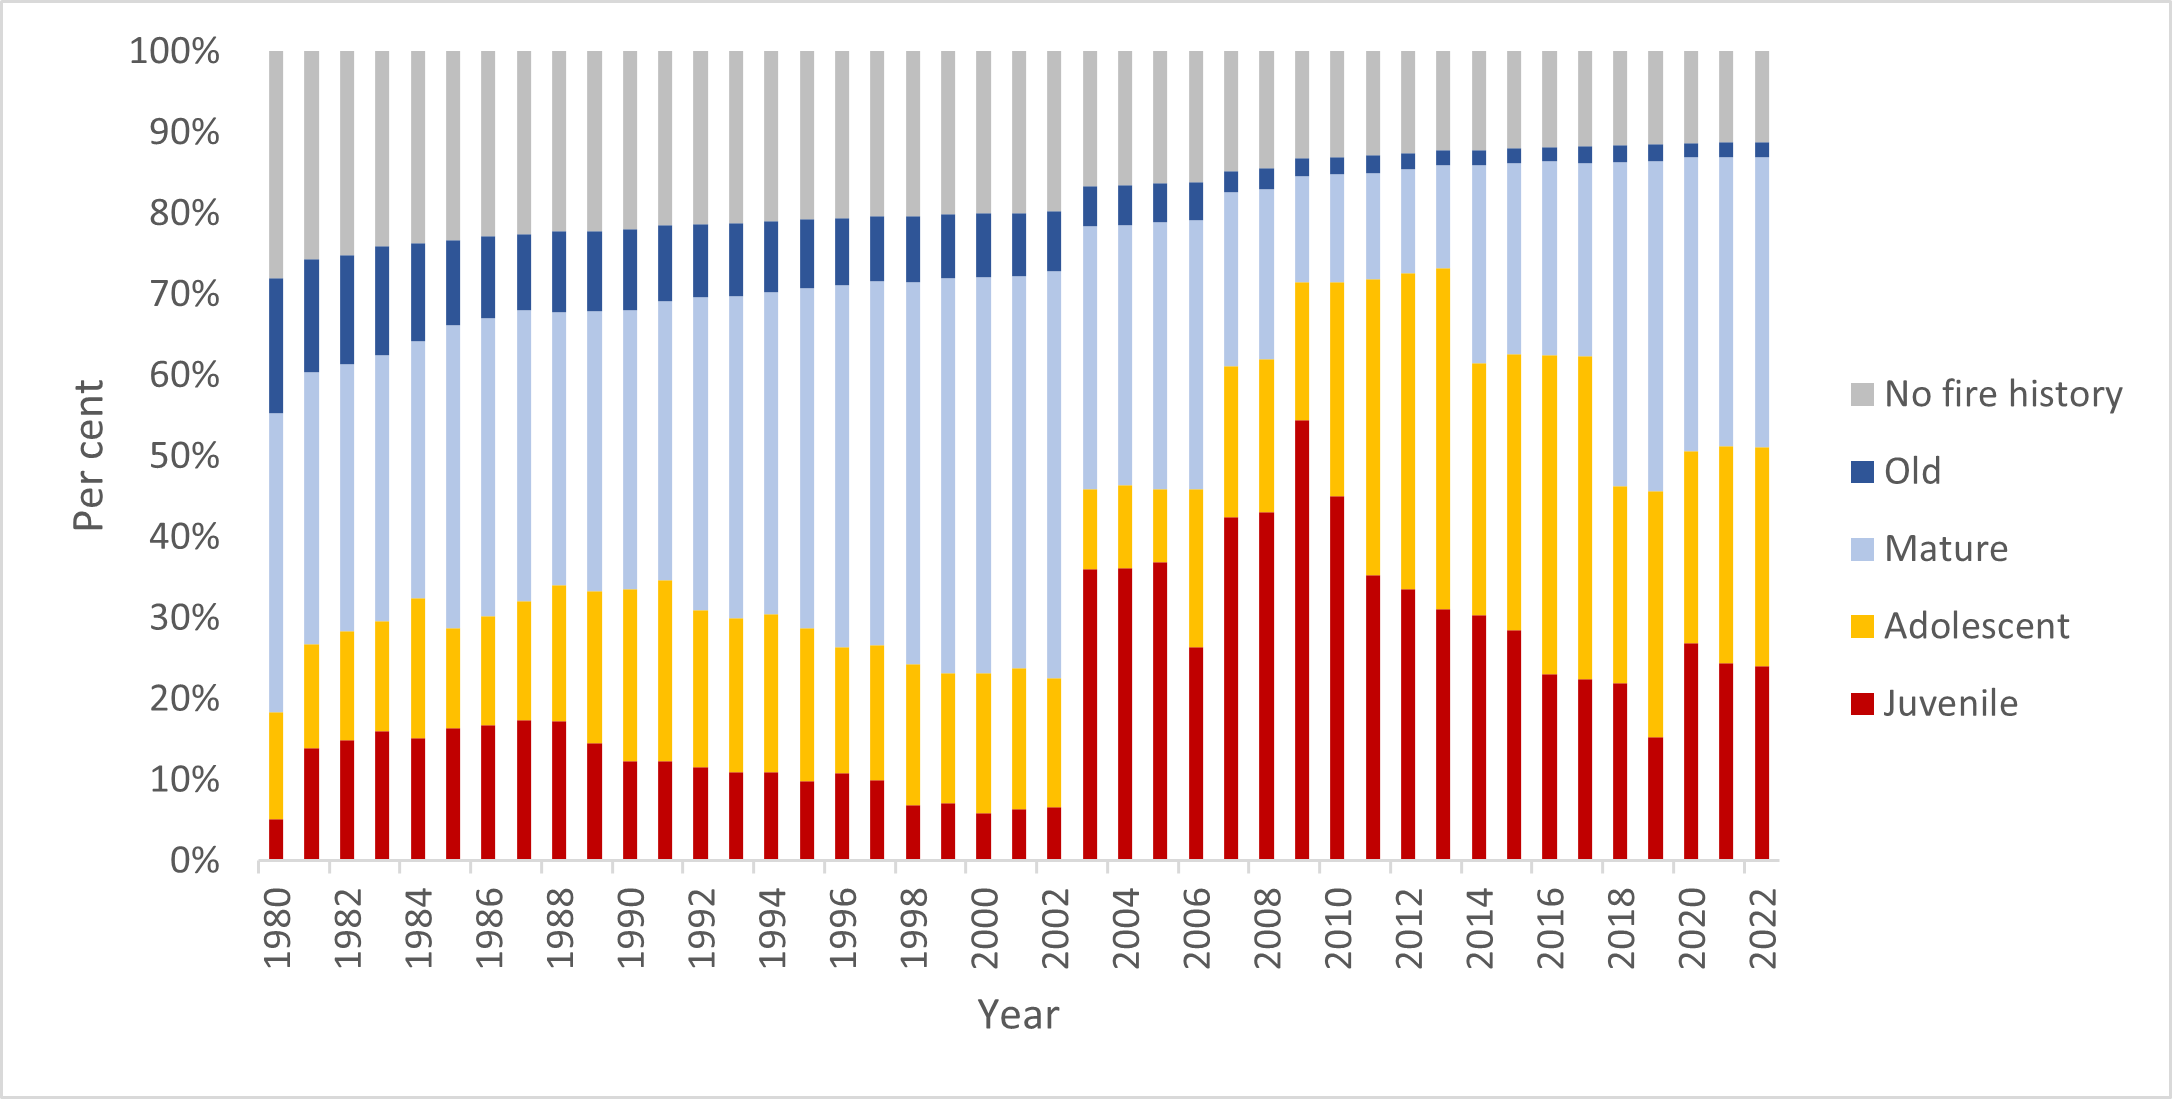
Fuel management delivery
In 2021–22, the Hume region treated 16,576 hectares through planned burning, including ecological burns. This included 10 priority burns and one cross-tenure burn delivered with the CFA.
A further 3,598 hectares were treated by non-burn fuel treatment works, including 1,004 hectares with mechanical mowing or slashing, and a further 2,045 hectares by grazing. The total cost of Hume region’s fuel management program was $24.7 million.
Table 15 summarises the Hume region’s fuel management activities in 2021–22.
Table 15: Fuel management activities, Hume region, 2021–22
| Fuel reduction | Number of treatments | Hectares |
|---|---|---|
|
Area treated by planned burning Ecological burns: 9 hectares (1 burn) Fuel reduction burns: 16,566 hectares (31 burns) Other burns: 0.5 hectares (11 burns) |
43 | 16,576 |
|
Area treated by non-burn fuel treatments Mechanical mulching: 42 hectares (7 treatments) Mechanical slashing or mowing: 1,004 hectares (147 treatments) Other methods: 2,552 hectares (18 treatments) |
172 | 3,598 |
| Total area treated to reduce bushfire risk | 215 | 20,174 |
Weather conditions in the Hume region were characterised by a strong La Niña event bringing significant summer rainfall in early 2022, with much of the region receiving well above average rainfall. Warm and dry conditions returned in February, particularly to the western end of the region, with the lower rainfall enabling the fuel management program to begin.
By March 2022, the Murrindindi and Goulburn Districts in the west of the region were able to start on the fuel management program, with the bulk of the program delivered by these districts ahead of the autumn break in weather. Rainfall in autumn across the region left the two eastern districts – the Upper Murray and Ovens – too wet to deliver many planned burns, with only 17 days suitable for ignition of the larger landscape burns.
To capitalise on opportunities in other parts of the state, the Hume region provided resources to help deliver planned burning, with 8 taskforces deployed to Barwon South-West and Loddon Mallee regions.
Loddon Mallee
Fuel-driven bushfire risk
Loddon Mallee’s long-term regional planning target is to maintain fuel-driven bushfire risk at or below 75% of maximum levels.
Fuel-driven bushfire risk in the Loddon Mallee region in 2021–22
- was 68% on 30 June 2022
- decreased by 3% from 71% at the end of 2020–21
- is projected to increase to 77% in the absence of any fuel management activity or bushfires, and
- if implemented, the entire Joint Fuel Management Program would keep risk levels below the Loddon Mallee region's long-term regional planning target of 75%.
The Loddon Mallee region successfully focused on delivering fuel treatment in priority risk-reduction areas, including Heathcote and Castlemaine.
The Murray Goldfields District delivered 5 fuel reduction burns, making a significant contribution to reducing fuel-driven bushfire risk in the region.
Figure 22 shows the Loddon Mallee region’s risk profile for 1980 to 2022 and projected changes in fuel-driven bushfire risk until 2025. It shows fuel-driven bushfire risk in the Loddon Mallee region.
Figure 22: Fuel driven bushfire risk profile, Loddon Mallee region, 1980–2025. Data aligns with financial year.
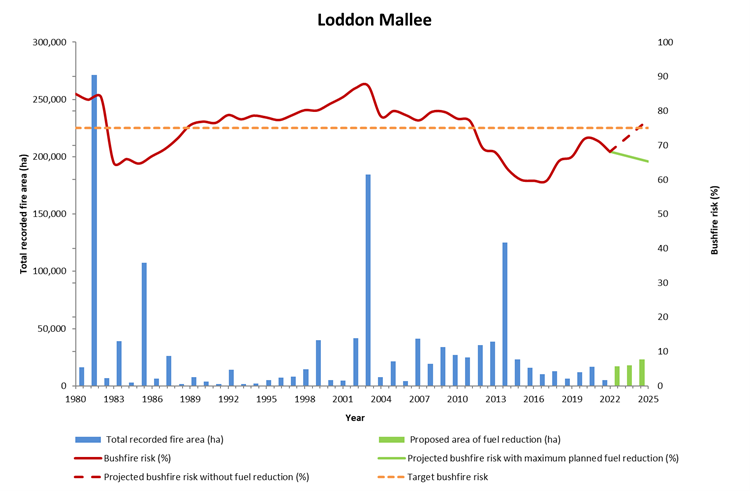
Ecosystem resilience
Figure 23 shows the tolerable fire interval (TFI) status of vegetation on public land in the Loddon Mallee region since 1980. It shows that in 2021–22:
- 26% of vegetation was below minimum TFI, 1% lower than in 2020–21
- the proportion of vegetation within TFI remained stable at 25%
- the proportion of vegetation above maximum TFI remained stable at 1%
- vegetation with no fire history has declined over the past decade, at 47%.
In 2021–22, less than 1% of vegetation burnt by bushfires or planned burning was below minimum TFI. This was the result of careful planning to minimise the potential impacts of planned burns on vegetation below minimum TFI.
Figure 23: TFI status of vegetation on public land, Loddon Mallee region, 1980–2022. Data aligns with financial year.

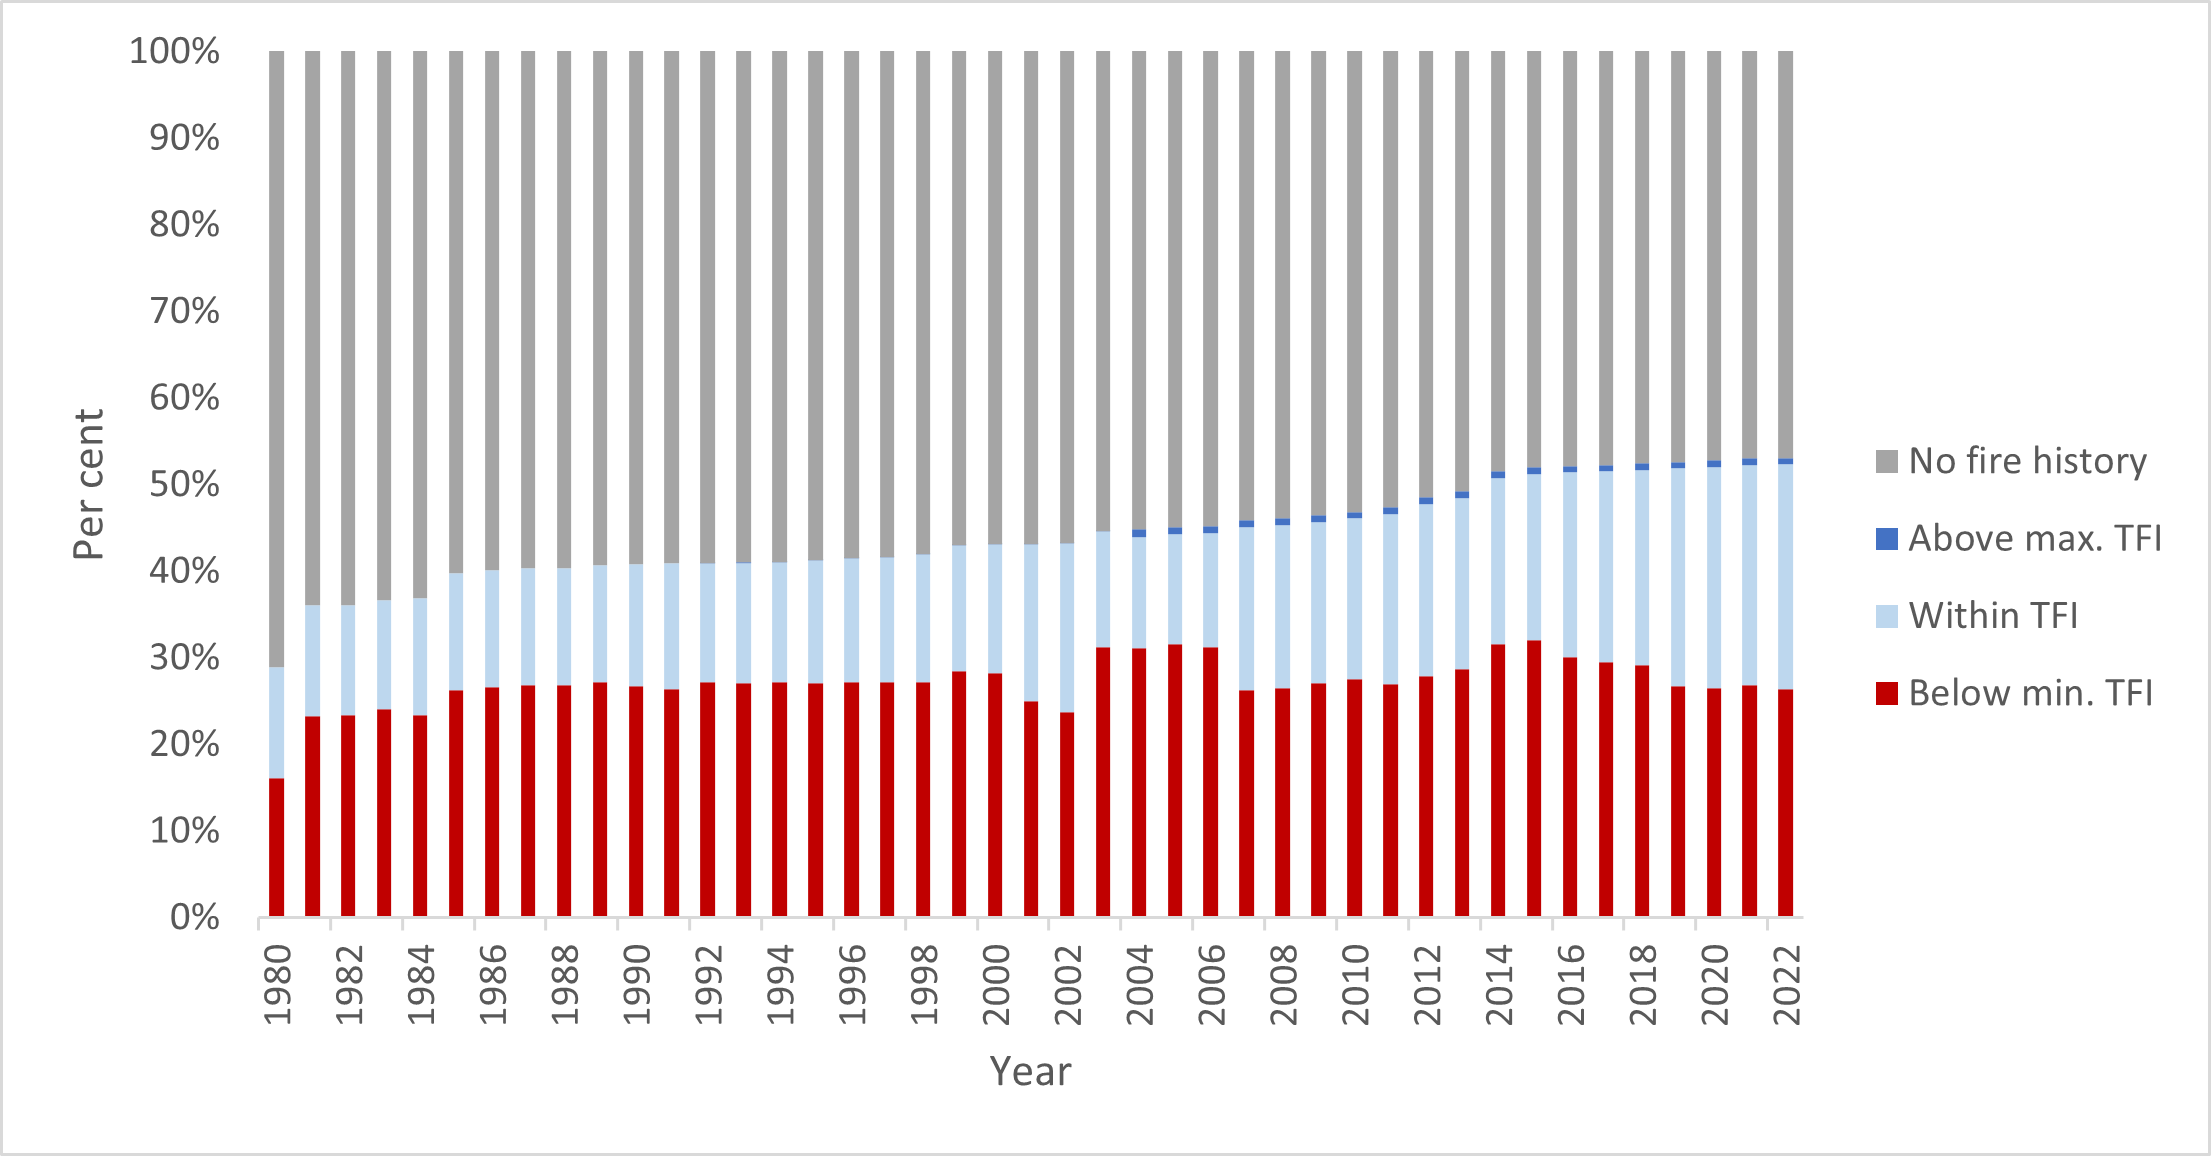
Figure 24 shows the growth stage structure (GSS) status of vegetation on public land in the Loddon Mallee region since 1980. It shows that in 2021–22:
- 3% of vegetation was in the juvenile growth stage, 1% lower than in 2020–21
- 9% of vegetation was in the adolescent growth stage, 1% lower than in 2020–21
- 41% of vegetation in the mature growth stage, 1% higher than in 2020–21
- the proportion of vegetation in the old growth stage remained stable at 5%
- the proportion of vegetation with no recorded fire history gradually declined over the past decade, at 42%.
Figure 24: GSS status of vegetation on public land, Loddon Mallee region, 1980–2022. Data aligns with financial year.
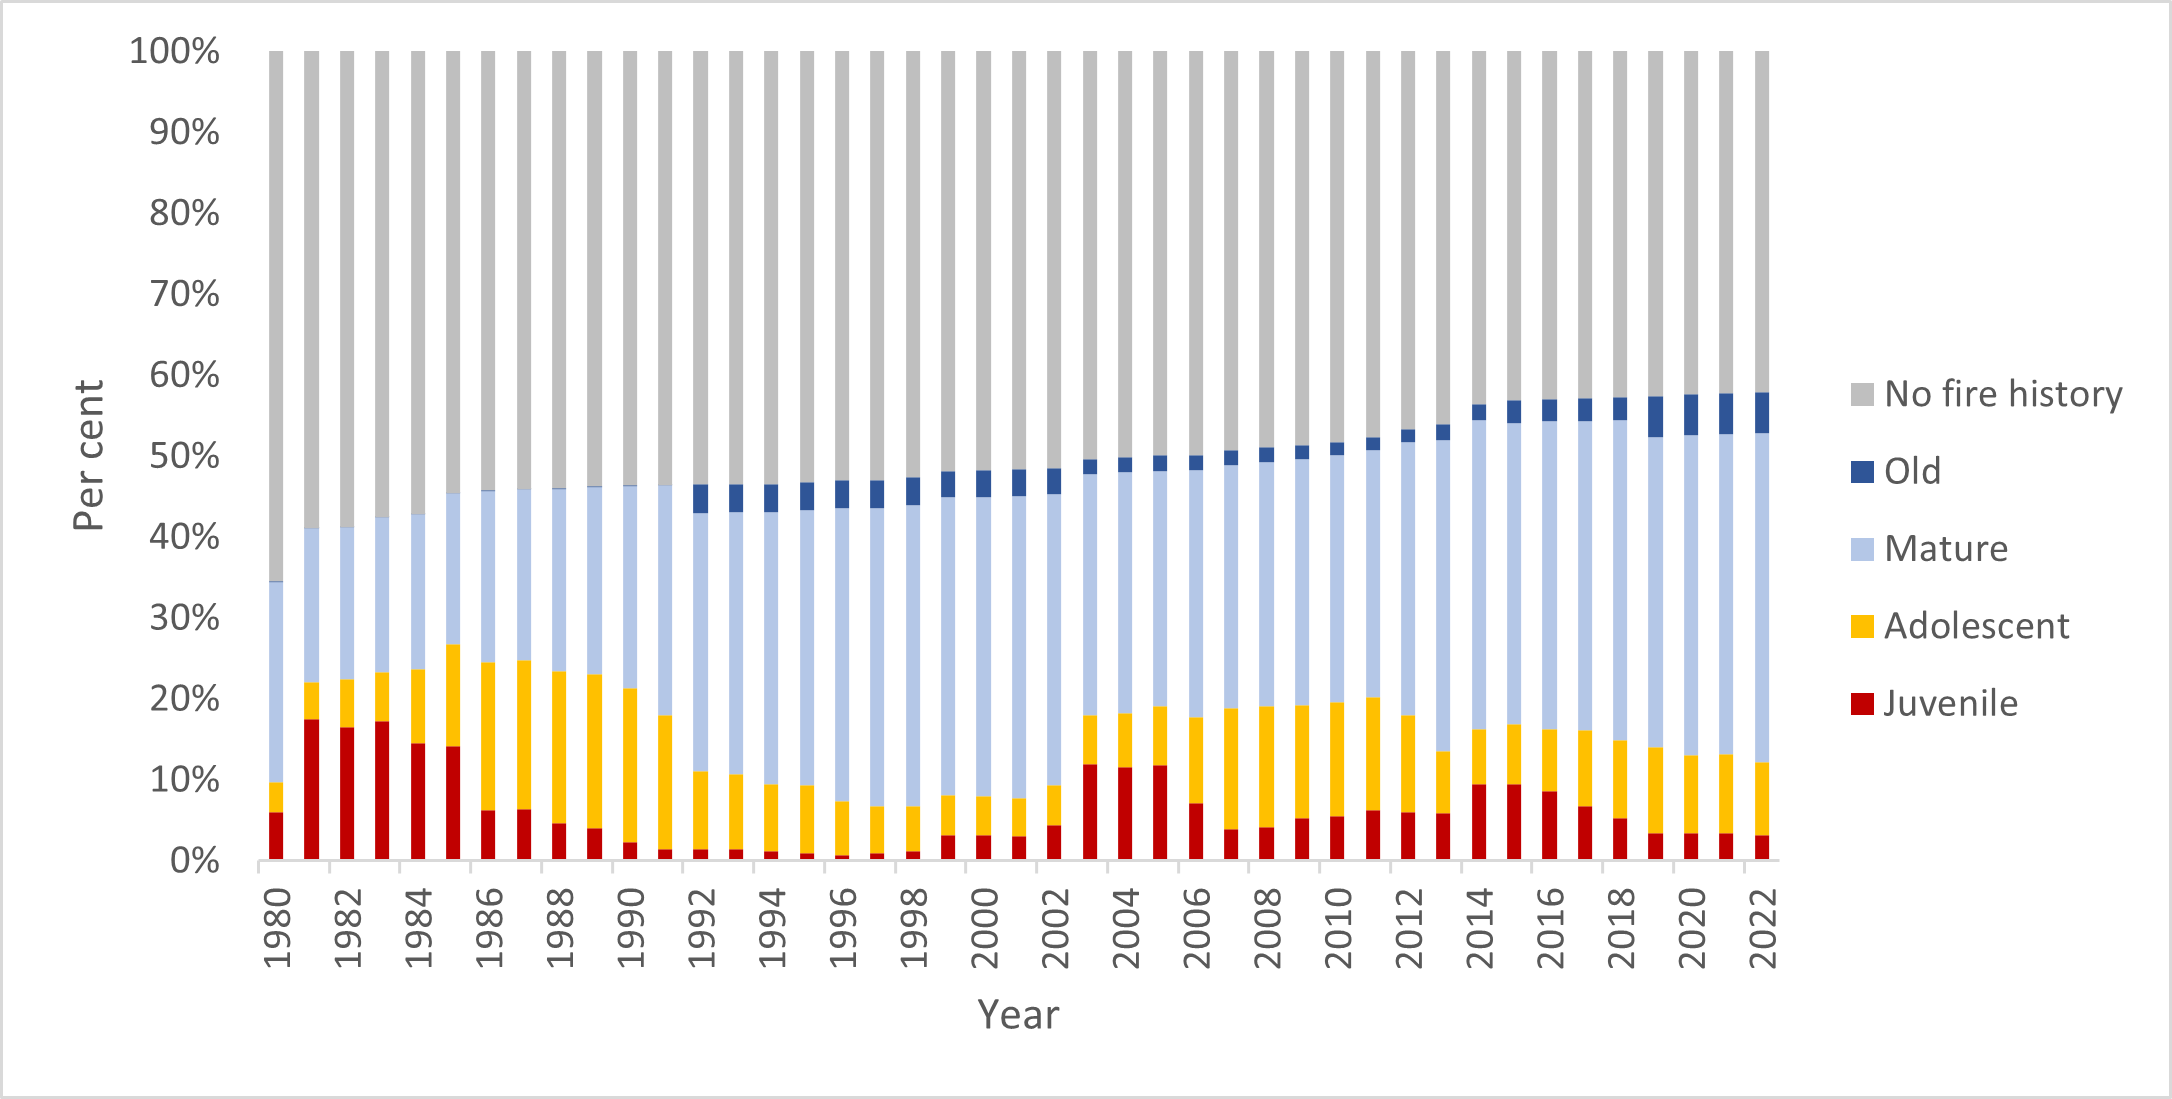
Fuel management delivery
In 2021–22, the Loddon Mallee region delivered 26 planned burns over 2,371 hectares, including one ecological burn.
A further 3,038 hectares were treated through non-burn fuel treatments. The total cost of Loddon Mallee region’s fuel management program was $11.6 million.
Table 16 summarises the region’s fuel management activities in 2021–22.
Table 16: Fuel management activities, Loddon Mallee region, 2020–21
| Fuel reduction | Number of treatments | Hectares |
|---|---|---|
|
Area treated by planned burning Ecological burns: 356 hectares (1 burn) Fuel reduction burns: 2,015 hectares (23 burns) Other burns: 0.5 hectares (2 burns) |
26 | 2,371 |
|
Area treated by non-burn fuel treatments Mechanical mulching: 451 hectares (28 treatments) Mechanical slashing or mowing: 2,259 hectares (694 treatments) Other methods: 328 hectares (37 treatments) |
759 | 3,038 |
| Total area treated to reduce bushfire risk | 785 | 5,409 |
The Loddon Mallee region continued to work on the network of fuel-reduced corridors in the Mallee parks. These corridors reduce the probability of large, landscape-scale bushfires impacting communities and the environment.
In the northern Mallee this work focused on the Big Desert State Forest and Wyperfeld National Park corridor network. Treated edge breaks will minimise bushfire risk to communities – including Yaapeet and Rainbow – by reducing the likelihood of bushfires exiting public land.
Loddon Mallee also built on fuel treatment work in priority areas for bushfire risk reduction for the townships of Bendigo, Castlemaine, Elphinstone, Glenluce, Heathcote, Macedon, Maryborough, St Arnaud and Taradale.
Small planned burns reduced bushfire risk close to high-density residential areas in southern and western Bendigo (including Maiden Gully–Fowlers Road, Kangaroo Flat–Tipperary Lane and Big Hill–Channel Track).
Considerable planning and engagement helped ensure that smoke did not impact vignerons and other businesses in the Heathcote and Castlemaine areas.
Cultural burning
5 Traditional Owner led cultural burns were supported by Loddon Mallee region in 2021–22.
Port Phillip
Fuel-driving bushfire risk
Port Phillip’s long-term regional planning target is to maintain fuel-driven bushfire risk at or below 85% of maximum levels.
Fuel-driven bushfire risk in the Port Phillip region in 2021–22
- was 84% on 30 June 2022
- remained at 84% since the end of 2020–21
- would increase to 88% by 2025 in the absence of any fuel management activity or bushfires, and
- implementing the entire Joint Fuel Management Program would keep risk levels below the Port Phillip region fuel-driven bushfire risk target of 85%.
Modelling has shown that wet forests to the north and east of Melbourne drive much of the region’s fuel-driven bushfire risk, and these areas are typically too damp for large-scale planned burning.
While the regional fuel-driven bushfire risk level did not reduce, the delivery of priority risk reduction burns ensured that the fuel-driven bushfire risk stabilised and did not increase, as it was forecast to do if no planned burning was achieved.
18 priority risk reduction burns were delivered in Port Phillip Region, focussed on the interface north-east of Melbourne, the Dandenong and Yarra Ranges, and the forested areas in and around Melbourne’s water catchments.
Other key activities include the continued construction and maintenance of strategic fuel break networks through Melbourne’s water catchments, and mechanical fuel treatment in forest areas east of Melbourne.
Figure 25 shows the Port Phillip region’s risk profile for 1980 to 2022 and projected changes in fuel-driven bushfire risk until 2025. It shows fuel-driven bushfire risk in the Port Phillip region.
Figure 25: Fuel-driven bushfire risk profile, Port Phillip region, 1980–2025. Data aligns with financial year.
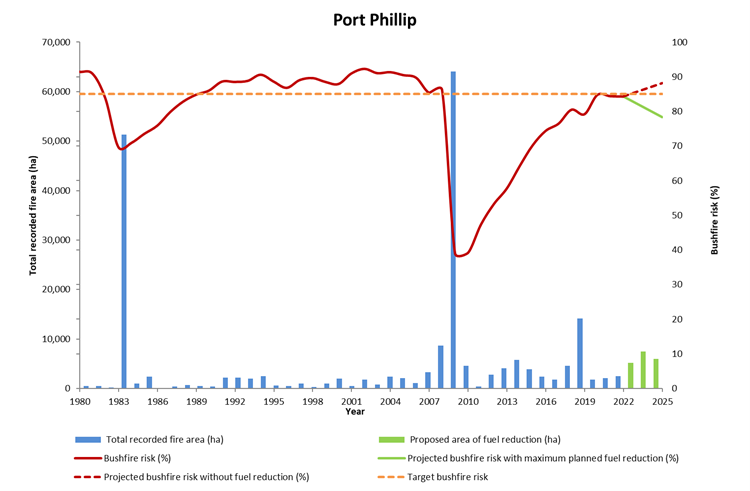
Ecosystem resilience
Figure 26 shows the tolerable fire interval (TFI) status of vegetation on public land in the Port Phillip region since 1980. It shows that in 2021–22:
- 49% of vegetation was below minimum TFI, 1% higher than in 2020–21
- 39% of vegetation was within TFI, 1% lower than in 2020–21
- the proportion of vegetation above maximum TFI remained stable at 1%.
In 2021–22, less than 1% of vegetation burnt by bushfire or planned burning was below minimum TFI, the result of careful planning to minimise the potential impacts of planned burns on vegetation below minimum TFI.
Figure 26: TFI status of vegetation on public land, Port Phillip region, 1980–2022. Data aligns with financial year.

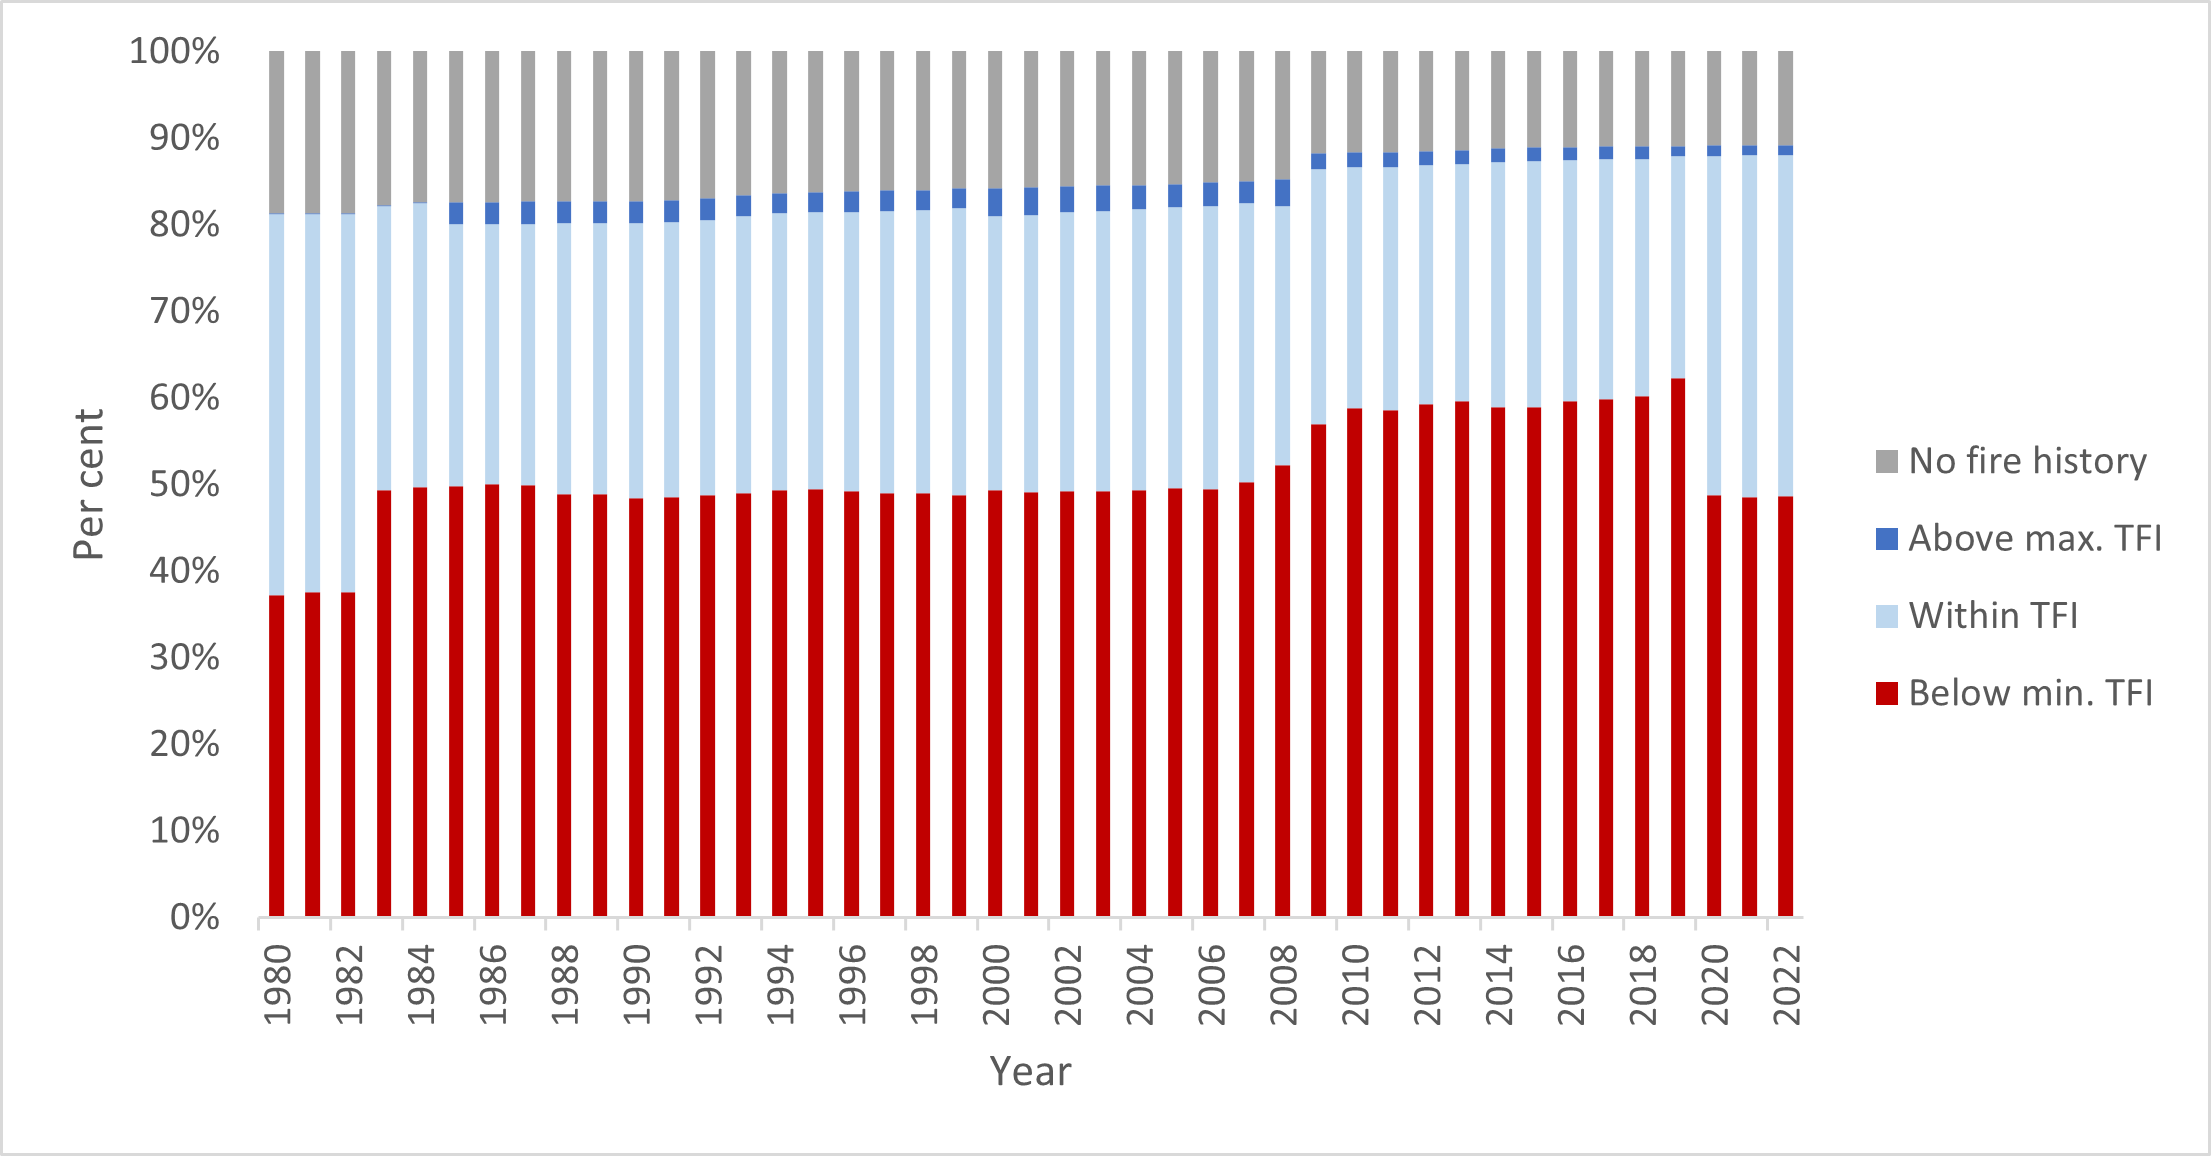
Figure 27 shows the growth stage structure (GSS) status of vegetation on public land in the Port Phillip region since 1980. It shows that in 2021–22:
- 12% of vegetation was in the juvenile growth stage, 4% lower than in 2020–21
- 30%of vegetation was in the adolescent growth stage, 4% higher than in 2020–21
- the proportion of vegetation in the mature growth stage remained stable at 43%
- the proportion of vegetation in the old growth stage remained stable at 2%
- the proportion of vegetation with no fire history remained stable at 12% since 2020–21 but has gradually declined over the past decade.
Threatened species, such as Leadbeater’s possum and smoky mouse, rely on vegetation in the mature and old growth stages for habitat, particularly features such as hollow-bearing trees and coarse woody debris. It will take a long time for the landscape to recover from bushfire to these growth stages, as some vegetation communities can take up to 50 years or more to reach maturity.
Figure 27: GSS status of vegetation on public land, Port Phillip region, 1980–2022. Data aligns with financial year.

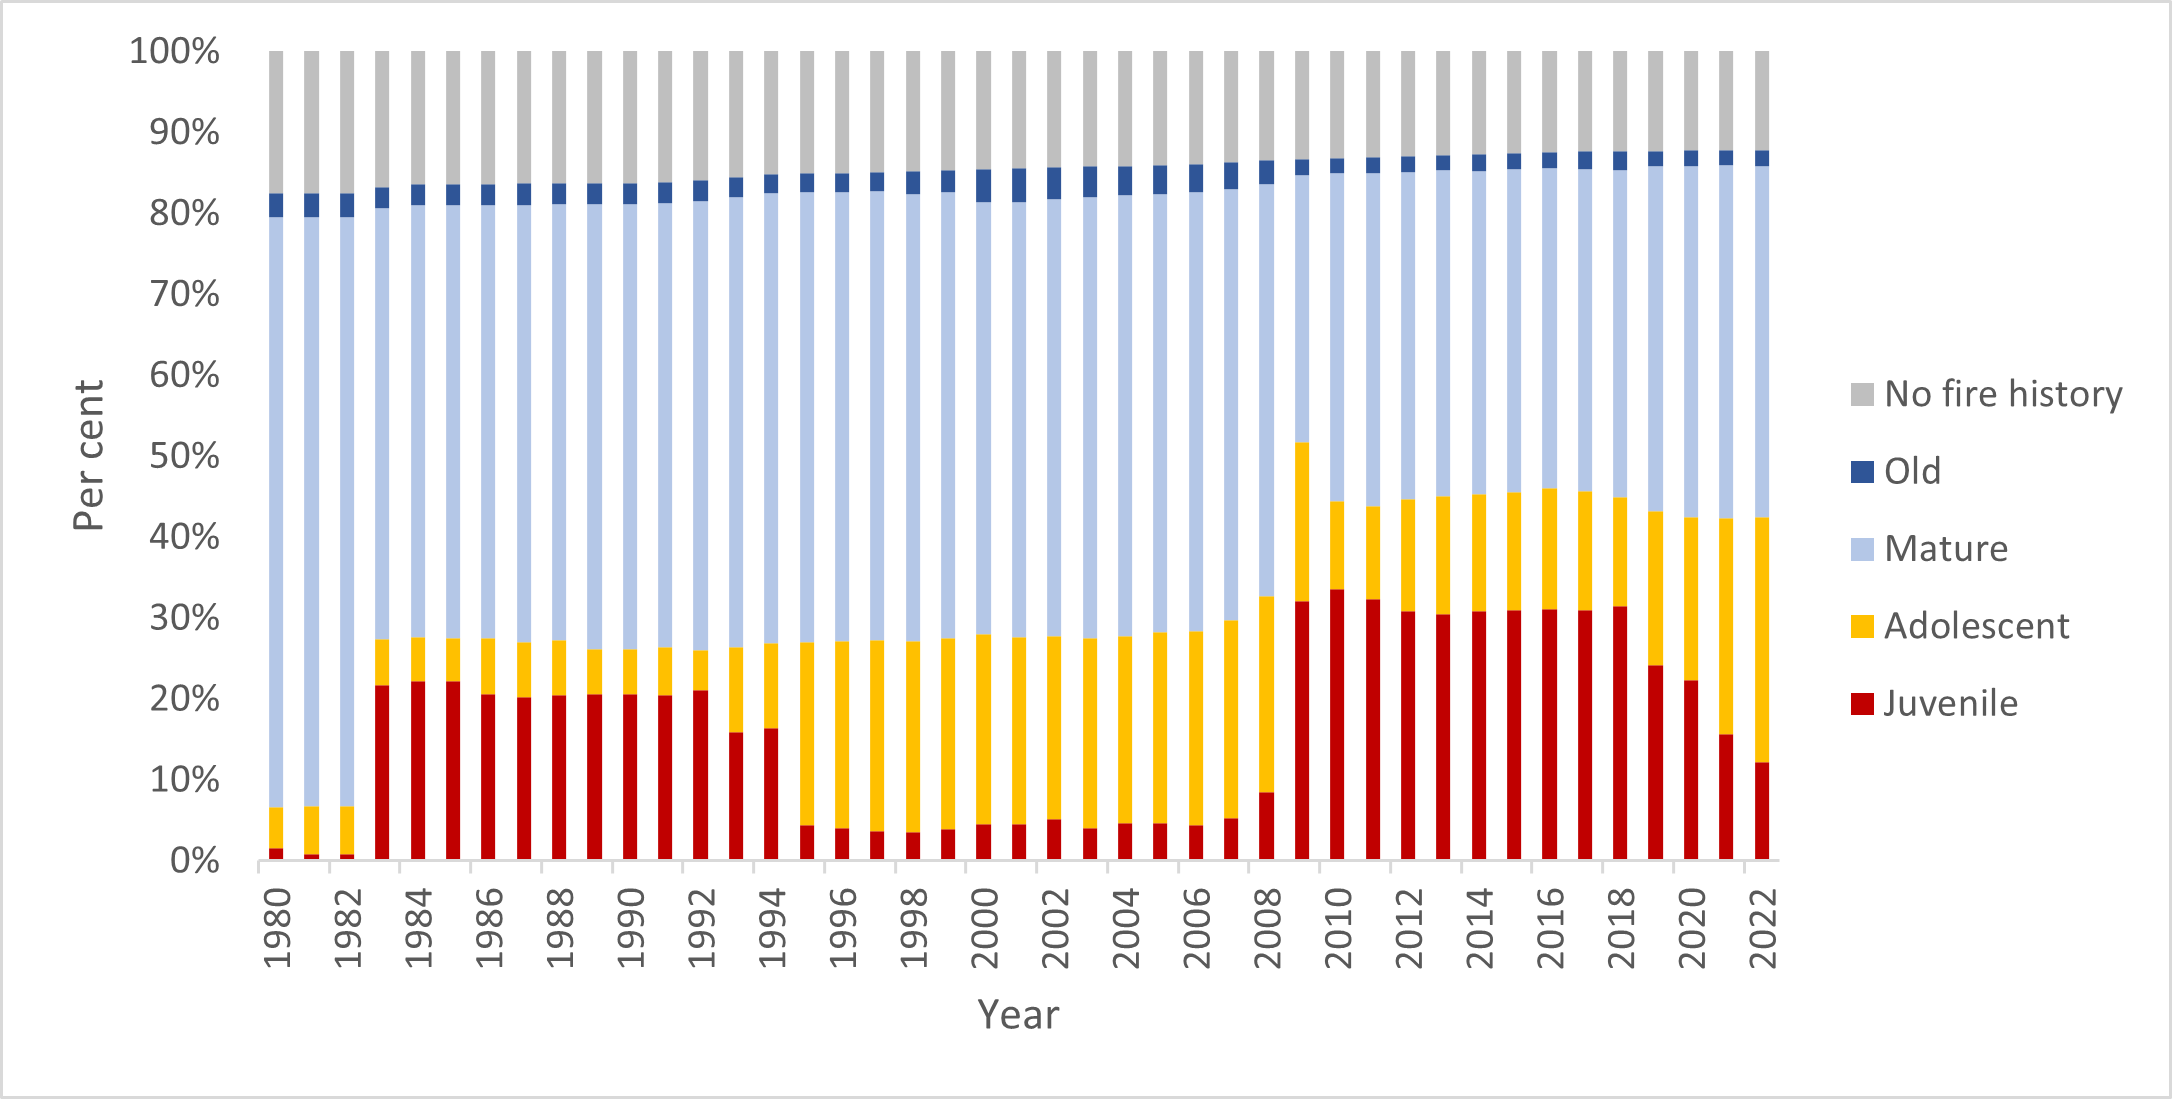
Fuel management delivery
Weather conditions in Port Phillip created a challenging environment for FFMVic crews throughout the 2021–22 season, but there were some good opportunities for both Metropolitan and Yarra Districts to deliver on their planned burning programs.
During 2021–22, Port Phillip treated 3,743 hectares with planned burning. This included 8 cross-tenure burns delivered with the CFA. Fuel was reduced on an additional 1,925 hectares through non-burn fuel treatments. The total cost of the Port Phillip fuel management program was $11.2 million.
Table 17 summarises the region’s fuel management activities in 2021–22.
Table 17: Fuel management activities, Port Phillip region, 2021–22
| Fuel reduction | Number of treatments | Hectares |
|---|---|---|
|
Area treated by planned burning Ecological burns: 567 hectares (11 burns) Fuel reduction burns: 3,128 hectares (21 burns) Other burns: 48 hectares (13 burns) |
45 | 3,743 |
|
Area treated by non-burn fuel treatments Mechanical mulching: 803 hectares (13 treatments) Mechanical slashing or mowing: 1,122 hectares (115 treatments) Other methods: 0 hectares (0 treatments) |
128 | 1,925 |
| Total area treated to reduce fuel-driven bushfire risk | 173 | 5,668 |
Port Phillip region felt the effects of a La Niña this year, resulting in a shorter-than-usual planned burning window between unstable weather systems.
To deliver on the Joint Fuel Management Program, the region-maintained readiness despite the challenging weather, ready to respond to favourable conditions with little notice. The Yarra District focused on completing several priority planned burns in the Healesville, McMahons Creek, Gilderoy, Millgrove and Toolangi areas.
The Metropolitan District undertook important burns in Montrose, Ferny Creek, Warrandyte and Lysterfield, protecting communities in these areas.
The Port Phillip region also felt the impacts of multiple storm events in the Dandenong Ranges. This area suffered significant storm damage, which had a considerable impact on the planned burn program, as preparation became more complex, and crews were diverted to essential storm recovery works.
Country Fire Authority
2021–22 CFA fuel management
This year’s bushfire risk management report has been expanded to include available data from the Country Fire Authority (CFA) fuel management activities on private land and other public land like roadsides and rail corridors.
The Country Fire Authority Act 1958 authorises CFA to conduct fuel management activities on private land and in the ‘country area of Victoria’.
The CFA conducts fuel management activities at the request of the landowner or manager.
CFA does not manage land and must work closely with landowners and managers such as road and rail authorities to conduct planned burning or mechanical fuel treatments.
Table 18 outlines the treated area and the number and location of all fuel treatment activities led by the CFA during 2021–22.
In total, 3,619 hectares were treated across the state, through 219 activities. The largest areas treated were in the South West CFA region (1,914 hectares) and West CFA region (1,439 hectares).
Many of the areas treated on behalf of land managers were long linear strips, such as road and rail corridors, with a small hectare footprint, but totalling 494 kilometres of vegetation treated to reduce fuel-driven bushfire risk.
Table 18: CFA fuel treatment activities, by region, 2021–22
| CFA region | Number of fuel treatment activities | Area treated (hectares) |
|---|---|---|
| North East | 47 | 180 |
| North West | 14 | 62 |
| South East | 8 | 24 |
| South West | 77 | 1,914 |
| West | 73 | 1,439 |
| Total | 219 | 3,619 |
CFA fuel treatments are broken into treatment types in Table 19.
Most of the fuel management completed was through planned burning (89%), with non-burn fuel treatment accounting for only 11% of CFA’s program.
Non-burn fuel treatments included various mechanical treatments, such as slashing and mulching.
The CFA are working with Traditional Owner groups and First Nations communities to enable more cultural fire, linking in with the Victorian Traditional Owner Cultural Fire Strategy and CFA Koori Inclusion Action Plan. In 2021–22, the CFA supported the delivery of 1 cultural burn by Traditional Owners covering 8 hectares.
Table 19: CFA fuel treatment activities, by treatment type, 2021–22
| CFA region | Number of fuel treatment activities | Area treated (hectares) |
|---|---|---|
| Planned burning | 171 | 3,220 |
| Non-burn fuel treatments | 47 | 391 |
| Traditional Owner burning | 1 | 8 |
| Total | 219 | 3,619 |
In 2021–22, all planned burns led by CFA were incorporated into the fuel-driven bushfire risk calculations for Forest Fire Management Victoria (FFMVic).
These burns minimise risk through critical access and egress for communities, and by reducing fuels next to residential areas and critical infrastructure.
These treatments help deliver on joint bushfire management strategy approaches, including more effective fire suppression, reduced bushfire spread and severity, and reduced impacts of bushfires on people and property.
The CFA fuel management program is often driven by local communities and as a result, has positive flow effects for communities in understanding their own bushfire risk and the role fire can play in reducing risks and maintaining ecosystems.
However, due to the smaller size and linear characteristics of these planned burns, they are less represented in the calculations FFMVic uses to monitor fuel-driven bushfire risk.
The Office of Bushfire Risk Management will continue to work with CFA to explore how to best capture the contribution of CFA’s activities to reducing bushfire risk.
Bushfire Risk Engagement Areas
To help prioritise risk reduction efforts on private land, CFA uses Bushfire Risk Engagement Areas, which are strategic areas covering both public and private land.
These areas form part of the regional bushfire management strategies and identify where communities and agencies can most effectively work together on bushfire fuel management actions – such as planned burning or mechanical treatments – to reduce fuel-driven bushfire risk to human life and property most effectively.
By working together, communities, local government and fire management agencies use Bushfire Risk Engagement Areas, amongst other tools such as the Victorian Fire Risk Register – Bushfire, to help prioritise actions to reduce risk.
Because each area is unique, various management approaches are considered, including vegetation management, land use planning, community engagement and education. The treatment choice will depend on the vegetation type, land use, feasibility of treatment options and landowners’ preferences.
Treatments can be delivered to meet different objectives, from protecting life and property through to maintaining or enhancing ecological resilience.
Case study
Wheatsheaf FireScape project – Bushfire Risk Engagement Area
The Wheatsheaf FireScape is an ongoing Safer Together project in a small fire-prone community between Daylesford and Trentham. The project is focused on the Wheatsheaf area, as strategic bushfire planning identified the potential to substantially reduce bushfire risk on private land.
Through this project, 16 landholders, the CFA and FFMVic are all aligning their fuel management activities to reduce bushfire risk for the Wheatsheaf community.
In 2021–22, CFA and FFMVic undertook a planned burn at Osborne Road, Daylesford. Close to 200 hectares were treated to reduce fuels and to provide protection to human life, property and community assets in the area.
The planned burn was strengthened by mulching across 22 properties in the project area and a series of weekend wood-chipping events. About 350 cubic metres of coarse woody debris was processed around homes. This is the first part of a long-term partnership and series of activities, with tree-candling works (treatment of bark fuel hazard on specific tree species to decrease the likelihood of embers and short-distance fire spotting) planned in future years to reduce spotting hazards from bark fuels.
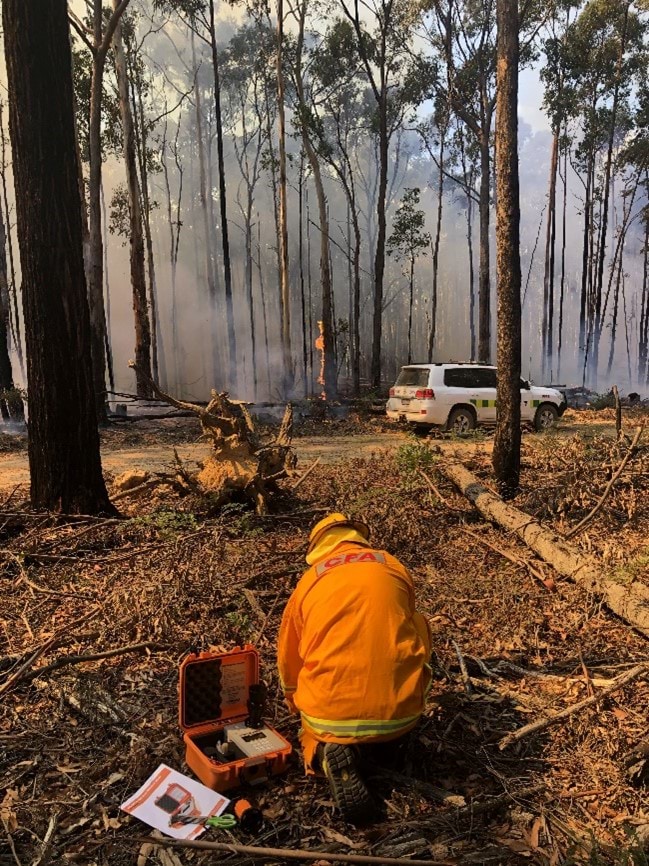
Cultural burning
The CFA is committed to work with Traditional Owners across Victoria to support and strengthen cultural burning practices. Cultural burning is performed by Traditional Owners as part of their cultural responsibilities and obligations to care for Country.
The CFA’s Koori Inclusion Action Plan aims to grow and strengthen relationships with Koori people across Victoria by promoting inclusion of Traditional Owners and their perspectives in everything the CFA does.
CFA brigades have been assisting with the return of cultural fire in practical ways by supporting cultural burns conducted by Traditional Owners, or by piloting and evaluating burns based on cultural practice in association with local Traditional Owners.
Case study
Reintroducing cultural fire in Minimay
A 41-hectare planned burn was conducted in Minimay, western Victoria by the Barengi Gadjin Land Council as the Traditional Owners.
The CFA supported this burn as part of a larger program of works that aims to reintroduce traditional burning back into the Wimmera landscape. The program is a partnership between the Barengi Gadjin Land Council, Bank Australia, Greening Australia, Trust for Nature, CFA and FFMVic.
The burn helped to create a fine-scale mosaic of vegetation of varying age classes through the Bank Australia reserve to provide a diversity of habitat structures and to protect and promote the native flora and fauna.
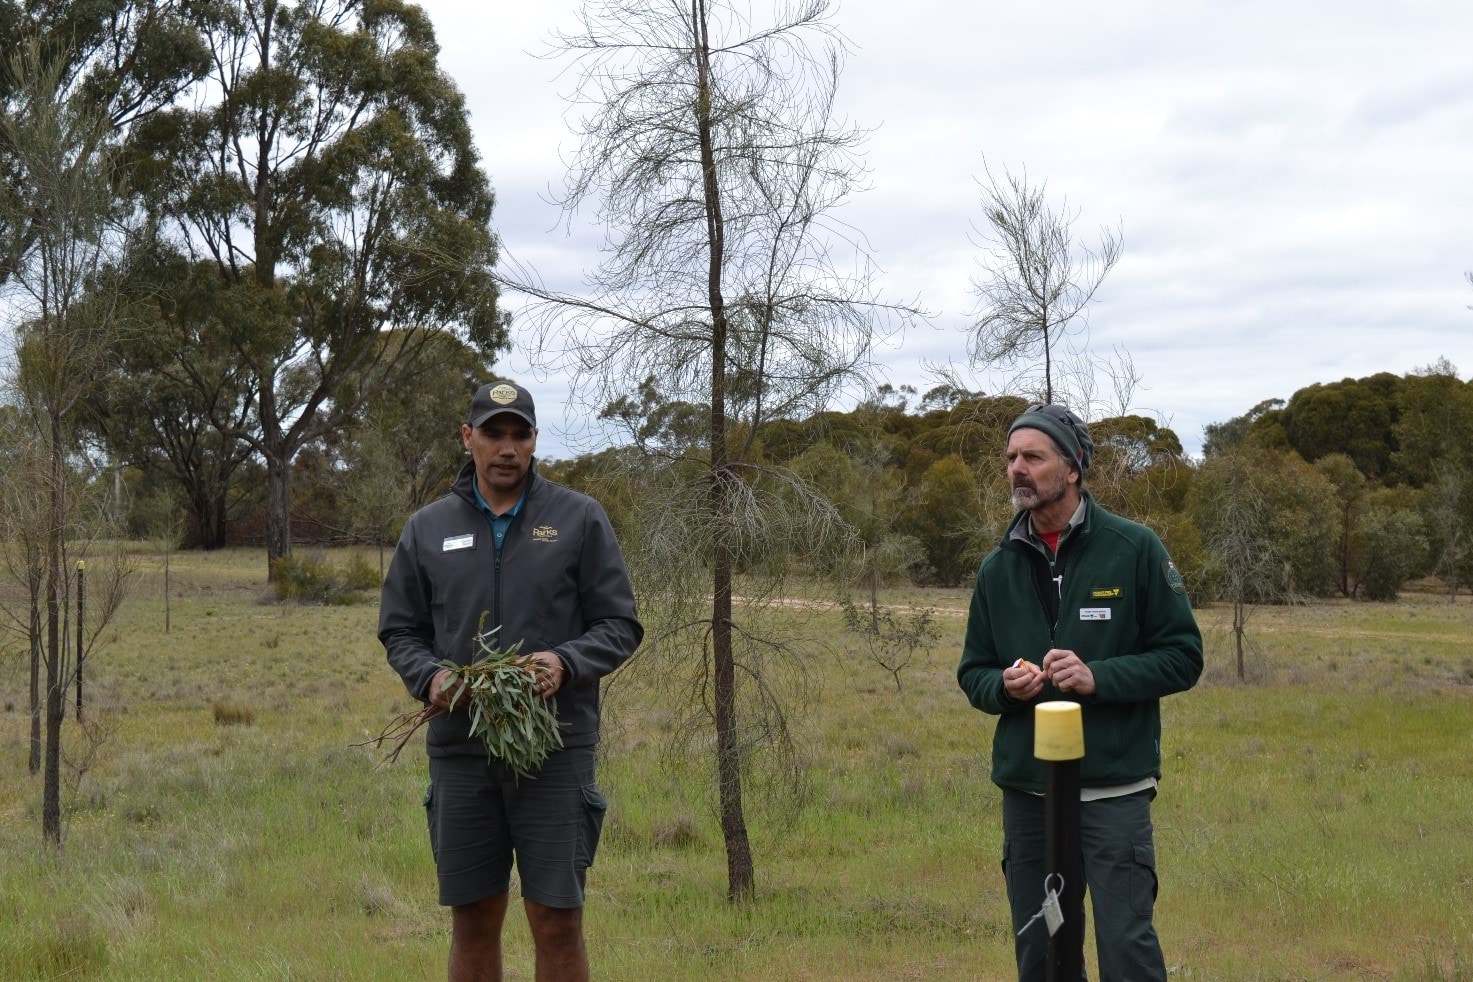
Assurance of breaches of FFMVic planned burn control lines
Transfer of assurance function to the Office of Bushfire Risk Management
In October 2015, the Lancefield–Cobar Croziers Track planned burn led by the Department of Environment, Land, Water and Planning (DELWP) breached the control line and led to a bushfire that threatened private property and the Lancefield and surrounding community. In December 2015, the Victorian Government requested the Inspector-General Emergency Management (IGEM) to investigate and report on any breaches of the control line by a DELWP planned burn.
IGEM began the assurance function in January 2016 working with DELWP (now the Department of Energy, Environment and Climate Action) to establish a prompt, efficient, sustainable and accountable process for managing the investigation of planned burns that breach the control line.
In June 2022, this role was formally transferred to the Office of Bushfire Risk Management (OBRM), and reporting on breaches of control lines is now part of the annual bushfire risk management report.
As part of this transfer, OBRM shadowed IGEM through its assurance process on the single breach of the planned burn control line that Forest Fire Management Victoria (FFMVic) reported to IGEM in 2021–22.
In performing this role, OBRM will ensure its assurance activities uphold the principles of the IGEM Assurance Framework for Emergency Management.
2021–22 breaches of the control line
In 2021–22, FFMVic reported one planned burn that breached the control line. This breach was in western Victoria and resulted in an additional 81.5 hectares of public land being burnt, including an area of south-eastern red-tailed black cockatoo feeding habitat. FFMVic crews contained the breach that night without private assets being impacted.
In accordance with its ‘Standard Operating Procedure 3.5.6 – Classification, reporting and investigation of breaches of control lines by planned burns’, FFMVic classified the breach of the control line as a ‘breach’.
FFMVic conducted a planned burn breach analysis and provided it to IGEM and OBRM for review. A request was made to FFMVic to provide additional detail as an ‘Addendum’ on the events that occurred during the planning and conduct of the burn.
As part of the review, IGEM and OBRM identified the following risk factors that are considered to have contributed to the breach of the control line:
- No planning was undertaken for potentially requiring a second day of ignition, with the second day of operation only being planned for patrol. As part of an after-action review, FFMVic identified further planning – including a new phase two and three risk assessment – may have identified higher risk factors, potentially requiring further contingency planning to be put in place.
- The weather forecast obtained for ignition on day one and patrolling on day two indicated that the Keetch-Byram Drought Index prescription parameter was outside standard prescriptions. Given the decision to continue ignition on day two, obtaining a spot weather forecast for day two would have been appropriate as per the relevant work instruction. This may have identified additional risks and triggered further contingency planning or a decision not to proceed with further ignition.
- While resources were efficiently reallocated to contain the breach, day two of ignition lacked physical resources that may have helped in containing the breach earlier. To support suppression of the breach, local fixed-wing firebombing aircrafts were called. FFMVic identified in the after-action review that retardant-mixing capability was not available at the local airbase due to a ‘mixing crew’ not being rostered because of the low fire risk on the day. So when the aircraft were requested, the closest airbase couldn’t be activated, and aircraft had to reload from a more distant airbase.
- The lack of a dedicated second bulldozer operator resulted in the control of the operation being transferred from one Planned Burn Operations Officer to another during the response to enable the initial officer to operate the bulldozer. While there is no evidence that this change in control affected the response, having the appropriate resourcing to operate the equipment available may avoid disruptions and response delays in future.
- The approved phases one, two and three of the risk assessment provided by FFMVic refer to a single day of ignition. FFMVic have acknowledged that the risk assessment should have been returned to the regional Deputy Chief Fire Officer for approval, as the burn was outside of prescription, and that the fuel management system should have been updated to reflect the second day of ignition.
The risk profile assessment classified the breach as low risk.
FFMVic was proactive in circulating initial leanings to the district burn team the day following the breach, and complied with procedures by conducting an after-action review shortly after the breach. The after-action review and planned burn breach analysis identified the source of issues, opportunities for continuous improvement, and options for taking steps toward implementing more effective processes.
IGEM made no recommendations in response to the breach.
Definitions and further information
Area planned for treatment
The area planned for treatment is the total area in hectares of land parcels for which Forest Fire Management Victoria (FFMVic) and the Country Fire Authority (CFA) have completed operational fuel management planning. A region selects the parcels in line with its bushfire management strategy, and they become part of the rolling operational plan, the Joint Fuel Management Program (JFMP).
Area treated (by planned burning or non-burn fuel treatment)
The area treated is the area (in hectares) of land on which a fuel management treatment has been successfully undertaken to achieve a predefined fuel treatment objective. Planned burning makes up most of the fuel management during the year.
An example treatment is:
- treatment type: planned burning
- treatment objective: to reduce overall fuel hazard to below a moderate level over at least 70% of the planned area
- planned area (on JFMP): 100 hectares
- outcome: planned burning resulted in 80% of the planned area has an overall fuel hazard below a moderate level. The fuel treatment objective was achieved in full; the fuel hazard objective was more than achieved, and the area treated area (100 hectares) was equal to the planned area.
Burn window
The burn window is the suitable alignment of appropriate fuel moisture and weather conditions (both in the lead-up to and the days following the burn ignition). Appropriate fuel moisture conditions must align with suitable weather conditions before planned burning can be safely and effectively conducted. Weather is a key determinant of when and how much planned burning can occur.
Burnt area
The burnt area is the total area in hectares that a planned burn burns or blackens within the area treated. Following a burn, the burnt area is mapped to ensure the most accurate information for risk modelling is acquired. Refining this mapping over time can have flow-on effects for bushfire risk calculations, and as such, bushfire risk figures may be updated from year to year retrospectively.
Bushfire management strategy
Each of DEECA's regions has a Bushfire Management Strategy. Each strategy explains the approach to fuel management and other bushfire risk reduction interventions for the region to minimise the potential impact of major bushfires on people, property, infrastructure and economic activity, and maintain and improve the resilience of natural ecosystems.
The strategies set out the location of fire management zones – Asset Protection Zone, Bushfire Moderation Zone, Landscape Management Zone and Planned Burning Exclusion Zone – on public land.
The strategies also identify a cross-tenure approach, which highlights where fuel management most effectively reduces risk across public and private land.
Bushfire risk
Bushfire risk is the likelihood of a fire starting, spreading, and impacting people, property and the environment. This includes houses, critical infrastructure, water supply catchments, agricultural assets, and environmental and cultural values.
Victoria is particularly susceptible to large and intense bushfires that can spread up to 30 kilometres or more across landscapes due to Victoria's terrain, naturally flammable vegetation and frequent exposure to hot, dry and windy weather.
Bushfire risk is affected by factors including the weather, the type and condition of fuels in the location and its topography, the location of people and assets, and the ability to prevent fires from igniting and to suppress them once they ignite.
Community-based bushfire management
Community-based bushfire management is a community-led approach that supports communities and agencies to connect and make better-informed decisions. It includes working with communities to identify local priorities, develop mutual goals and solutions, build relationships and use locally tailored processes before, during and after bushfires.
Cross-tenure burn
A cross-tenure burn describes when a burn includes both public and private land. It is not a type of burn. See ‘Planned burning’ for definitions of types of burns.
Ecosystem resilience
Ecosystem resilience is the capacity of an area to absorb natural and management-imposed disturbance, but still retain its basic structure (the abundance and composition of its species, the function of its vegetation and its types of vegetation) over time.
Fire management zones
For fuel management purposes, Victoria’s public land is classified into four fire management zones.
- Asset Protection Zone (APZ): using intensive fuel treatment, the APZ aims to provide the highest level of localised protection to human life and property and key community assets. The goal of fuel treatment is to reduce radiant heat and ember attacks from a bushfire. Fuels in the APZ are treated by planned burning and mechanical fuel and other non-burn fuel treatments (mowing, slashing, mulching and spraying). Achieving the objectives of this zone may have negative impacts on other values. If so, FFMVic seeks to moderate them as far as practicable.
- Bushfire Moderation Zone (BMZ): this zone aims to reduce the speed and intensity of bushfires. This zone complements the APZ, in that planned burning in the BMZ, aims to protect nearby assets, particularly from ember spotting during a bushfire. Where practicable, FFMVic aims to achieve ecological outcomes by managing ecologically desirable fire regimes, provided this will still meet bushfire protection objectives, including by using non-burn fuel treatments.
- Landscape Management Zone (LMZ): within this zone, FFMVic uses planned burning for:
- bushfire protection outcomes, by reducing the overall fuel and bushfire hazard in the landscape
- ecological resilience, through appropriate fire regimes and management of the land for values such as forest regeneration
- protection of water catchments at a landscape level
Mechanical fuel and other non-burn fuel treatments may also be used within this zone as appropriate.
- Planned Burning Exclusion Zone (PBEZ): this zone excludes the use of planned burning, primarily in areas where the vegetation is intolerant to fire.
Fuel-driven bushfire risk
Fuel-driven bushfire risk is the component of bushfire risk that is attributable to bushfire fuels, that is, vegetation that influences fire behaviour, such as the speed and intensity of a bushfire.
Fuel (vegetation) is a key element of fire behaviour, and therefore is a major component of overall bushfire risk. However, it is not a full measure of bushfire risk, because fuel is not the only factor that affects fire behaviour, or the likelihood and consequence of bushfires impacting people and the things they care about.
In general, the influence of fuel on fire behaviour decreases as fire weather conditions become more severe.
The sector models (using a computer program called Phoenix Rapidfire) what impact planned burning has on reducing fuel-driven bushfire risk to inform fuel management planning and performance evaluation.
This impact is calculated and expressed as the percentage of fuel-driven bushfire risk ‘left over’ after bushfire fuels have been reduced, either through fuel management activities or bushfires (noting that currently, this calculation only considers the contribution of planned burning and not non-burn fuel treatments such as slashing and mowing).
This approach focuses on the role that planned burns have on moderating the severity of bushfires at large scales and the consequential likely reduction in impacts.
In previous years’ reports, fuel-driven bushfire risk was referred to as residual risk.
Fuel management
Fuel management activities include:
- planned burning (see definition)
- mechanical and other non-burn fuel treatments (see definition).
Fuel treatment delivery plan
Each planned burn must have an approved fuel treatment delivery plan. For FFMVic planned burns, the requirements are specified in the Code of Practice for Bushfire Management on Public Land 2012.
A plan includes a land management and treatment objective, the area of the burn, the type of fire management zone (FFMVic burns), how impacts on values will be minimised and how the outcome of the burn will be monitored and reported.
Growth stage structure
The growth stage structure (GSS) of an area of vegetation is its mix of vegetation of different ages, from juvenile to old. Vegetation's GSS depends on when it was last burnt or otherwise disturbed.
It is assumed that the diversity of GSSs and habitats across a landscape ensures a diversity of species, which helps maintain and improve ecosystem resilience.
As a result, fuel is managed to ensure an acceptable mix of growth stages in the landscape and protect important areas of older growth stages.
The growth stages are:
- juvenile: from immediate post-fire renewal to establishment up to the point when the full suite of species is reproductive
- adolescent: when vegetation is relatively young, and all species are reproductive but not at the rate that characterises mature vegetation
- mature: when the dominant species are fully reproductive through to stasis when vegetation structure and reproductive capacity stabilise
- old: when reproduction of the dominant species is declining and propagule banks are decreasing; if left undisturbed, vegetation may become senescent and is then unlikely to be reconstituted after a fire.
There is more information about vegetation GSS on the Safer Together Healthy environment web page.
Hazard Class
Hazard Class is used by the CFA to define the type of risk for a given area. Each Brigade Area may contain multiple hazard classes.
Hazard Class 2 (Medium Urban): Significant urban areas which are primarily residential including commercial centres, clusters of industrial and/or high-density community services e.g., schools, correctional facilities, hospitals.
Hazard Class 3 (Low Urban): All urban areas that are not included in Hazard Class 2 and include predominantly residential occupancies and small industries.
Hazard Class 4 (Rural): Primarily involves natural surroundings in terms of bush and grassland, but also involves isolated dwellings and structures within those areas.
Hazard Class 5 (Remote Rural): Covers very remote locations and very isolated dwellings.
Joint Fuel Management Program
The JFMP is the statewide program of fuel management works on public and private land. The JFMP includes operations managed by FFMVic and the CFA for the upcoming 3 years. It incorporates and supersedes Fire Operations Plans. It also includes cultural burns nominated by Traditional Owners.
The Joint Fuel Management Program web page has maps showing all planned fuel management activities for the upcoming 3-year period. The JFMP does not include burns managed by private landholders or industry.
Mechanical and other non-burn fuel treatment
Mechanical and other non-burn fuel treatments are used to manage fuel through activities other than by planned burning. Examples include mowing, slashing, mulching, spraying, rolling and grazing.
Mechanical fuel treatments are used to maintain the network of fuel breaks or to treat small, discrete, or complex areas that may be difficult to burn safely (such as in steep gullies) or to complement planned burning where the geography (community, vegetation, terrain) is complex, and planned burning opportunities are very limited. Mechanical fuel treatments are more expensive than planned burning, and the area that can be treated each year is usually much less than planned burning.
Native vegetation improvement
Native vegetation improvements are activities undertaken to compensate for impacts to biodiversity resulting from FFMVic’s bushfire preparedness actions. These improvements are carried out in areas of high biodiversity value throughout the state, including projects to remove invasive plant species.
Scientists and local land managers provide input into selecting which projects are funded. These projects contribute to implementing Protecting Victoria's Environment - Biodiversity 2037, Victoria’s plan to stop the decline of native plants and animals and improve the natural environment.
Planned burning
Planned burning is the lighting and managing of planned fires at times of lower bushfire risk for various reasons (such as to reduce leaf litter, twigs, bark and undergrowth). Planned burns may be ignited all year round including over summer, but most are in autumn and spring.
Planned burns are classified into:
- fuel reduction burns, to reduce the amount of fuel available to a bushfire, which can reduce its intensity and rate of spread, improving opportunities for firefighters to suppress it
- cultural burns, undertaken by Traditional Owners for cultural purposes
- ecological burns, to achieve ecological objectives (such as to maintain and improve ecological resilience and help to regenerate forests)
- other burns, which are ad hoc burns not included in the JFMP, but that still undergo a planning and approval process. For example:
- regeneration burns, to regenerate species or vegetation types (such as after timber harvesting)
- windrow/heap burns at point locations, which are to burn debris piles, usually from other land management operations (such as clearing woody weed species).
You can search the Planned burning in Victoria web page by postcode, locality, park or address to see the planned burns intended to be delivered over the next 10 days, weather and conditions permitting.
Planned burn breach
A planned burn is considered to have breached the control line if it:
- spreads beyond the area designated in the fuel treatment delivery plan
- cannot be readily controlled with onsite or planned resources
- compromises the burn objectives.
An FFMVic planned burn that has breached the control line is classified as either a breach or a bushfire, depending on its extent and impact on the community or the environment.
A breach is defined as being beyond the type and extent that is routine, anticipated and resourced as part of the fuel treatment delivery plan, not readily controlled with onsite or planned resources and does not pose a significant threat to or have a significant impact on assets or the community.
A bushfire is declared when a breach of the control line threatens or is likely to threaten public safety or private assets and is likely to have a greater impact on the environment. A planned burn may be declared a bushfire even if no breach of the control line occurs.
The Office of Bushfire Risk Management is notified of all breaches of the control line from an FFMVic planned burn, including planned burns declared as bushfires, and provides assurance over the investigation process to ensure any lessons are identified and drive continuous improvement in the systems and processes FFMVic uses to deliver safe and effective burns.
Safer Together
Safer Together is the Victorian Government’s approach to reducing bushfire risk, and involves fire and land management agencies working with communities to combine in-depth local knowledge with the latest science and technology to reduce bushfire risk on public and private land. See more information on the Safer Together website.
Strategic fuel break
A strategic fuel break is a strip of land where vegetation has been modified to form a safe and effective platform for fighting and controlling bushfires.
Strategic fuel breaks may be natural areas of low fuel but are typically constructed using machinery to modify or remove vegetation (such as grasses, shrubs and trees) which allow firefighters to control fires through direct firefighting methods or indirect firefighting methods (backburning, etc).
A strategic fuel break network is currently being established across Victoria to provide a last line of defence to protect townships and critical infrastructure, and to break larger blocks of forest into more manageable units to help keep fires as small as possible.
This network of strategic fuel breaks ensures that firefighters are able to respond to fires as quickly as possible and complement a range of other fire prevention and preparedness activities.
Tolerable fire interval
For any given plant community, the minimum and maximum tolerable fire intervals (TFIs) between successive burns are determined by the time required for key fire response species to mature and set seed, as well as their time to senescence without fire disturbance.
TFI thresholds provide minimum and maximum time intervals of fire frequency to ensure ecosystem resilience.
TFI status is reported as the proportion of vegetation on public land below minimum TFI, within TFI, above TFI or with no fire history.
- The proportion of vegetation on public land below minimum TFI is the percentage of land currently under the minimum time threshold recommended between successive burns for the vegetation on that land. For example, if the recommended minimum TFI is 15 years for a given vegetation type and it was last burnt 10 years ago, the land is below the minimum TFI and will continue to be for another 5 years.
- The proportion of public land above maximum TFI is the percentage of land that has not burnt for a longer period than recommended. For example, if the vegetation on that land last burnt 35 years ago, and its maximum TFI is 30 years, the land has been above the maximum TFI for five years.
- The proportion of public land within TFI is the percentage of that land on which the vegetation is currently recorded as being within the recommended minimum and maximum TFIs.
- The proportion of public land with no fire history is the percentage of land for which there is no record of fire, or of land with vegetation that does not have a recommended TFI.
The larger the areas in a landscape below minimum TFI and above maximum TFI, the less resilient ecosystems are likely to be.
Burning vegetation regularly while below minimum TFI increases the risk of fundamental changes in its structure and functioning.
However, sometimes vegetation that is below minimum TFI is burnt to manage bushfire risk to life and property in specific areas and to reduce potential damage to important ecosystems by major bushfires.
It is recognised that TFI is a coarse measure of ecosystem resilience that doesn’t recognise finer-scale vegetation responses to fire or the differing severity of planned burning and bushfires. But it can still help us with regional-scale decision-making. Regional bushfire management strategies aim to minimise areas burnt while below minimum TFI, where feasible, without failing to deliver on other regional objectives.
There will also be instances (such as large fire footprints) where fuels become flammable before ecological maturity is reached. In those cases, fire will need to be applied below minimum TFI to prevent larger areas from being burnt by more-intense bushfires.
There is more information about TFI on the Safer Together Healthy environment web page.
Appendix 1: Data and model output improvements
Victoria’s bushfire management sector continually works to improve the data and science that inform its decisions. As technology improves, better data becomes available, research programs elicit new knowledge, or mapping accuracy improves, the models improve and metrics, such as fuel-driven bushfire risk or ecosystem metrics, are recalculated.
Each year, updates are made to this report to respond to these improvements - ensuring the best-available models and data inform public reporting.
Readers should compare this report and past and future reports in that context. For the most accurate view of current and historical figures, you should always consult the most recent bushfire risk management report.
Changes to reported bushfire risk
This year’s report includes more accurate results from those reported in 2020–21 as improvements were made to both fire history data and the Phoenix RapidFire bushfire simulation software – leading to re-calculation of bushfires across multiple years.
The influence of these improvements is captured, over time, in Table 20.
Although there were no changes to the statewide fuel-driven bushfire risk levels in 2020–21, there were slight changes in the reported risk at the regional level in four regions, these are presented in Table 21.
Table 20: Changes and improvements to the reported bushfire risk percentage and reasons for the change
| Report year | 2014–15 | 2015–16 | 2016–17 | 2017–18 | 2018–19 | 2019–20 | 2020–21 | 2021–22 |
|---|---|---|---|---|---|---|---|---|
| Reported risk | 65% | 70% | 63% | 66% | 69% | 64% | 63% | 62% |
| Recalculated risk | 59% | 63% | 66% | 68% | 70% | 63% | No change | n/a |
| Model updates | 2016 Phoenix model update | 2016 Phoenix model update | 2016 Phoenix model update | Updates to Phoenix software and data inputs | No change | No change | No change | No change |
| Fire history layer changesi | 2021 | 2021 | 2021 | 2019 | 2022 | 2022 | No change | No change |
n/a = not applicable.
i Note this indicates the year the relevant data was developed against the year the recalculation was applied.
Table 21: Changes to reported Tolerable Fire Interval
| Region | Barwon South West | Gippsland | Grampians | Hume | Loddon Mallee | Port Phillip |
|---|---|---|---|---|---|---|
| Reported 2020–21 fuel-driven bushfire risk | 62% | 42% | 75% | 69% | 71% | 85% |
| Recalculated 2020–21 fuel-driven bushfire risk | No change | 43% | 74% | 67% | No change | 84% |
A significant influence on this recalculation were a suite of improvements to the Phoenix RapidFire bushfire simulation software and the bushfire risk calculation process, including:
- improving fuel-type mapping by:
- more accurately mapping the extent of woody vegetation across Victoria
- updating plantation, irrigation area and water-body mapping
- expanding fuel-type mapping into South Australia and New South Wales
- deploying a new version of the Phoenix RapidFire software (version 4007), which improves bushfire spread simulations by better accounting for convection, spotting and ember density
- expanding the Phoenix RapidFire software ignition grid by 40 kilometres into South Australia and New South Wales to complement the expansion of the fuel-type mapping
- improving the accuracy of address point locations, which are used to estimate bushfire risk, across Victoria; these improvements resulted in updated bushfire risk profiles, which show risk to be about 10% lower than estimated using the previous version of the Phoenix software and previous data.
These updates to the Phoenix RapidFire model were used in recalculations to all previously reported bushfire risk figures and showed a decrease in bushfire risk from that previously reported, dating back to 2012–13.
The second significant influence on this recalculation is the continual improvement in mapping accuracy for areas treated by planned burning - impacting foundational fire history data. This data had significant improvements in 2019, 2021 and 2022.
Changes to reported ecosystem resilience
As with reported fuel-driven bushfire risk, the improvements in mapping and accounting of areas treated by planned burning and subsequent re-modelling influence the calculation of ecosystem resilience metrics.
Changes to reported Tolerable Fire Interval (TFI) and Growth Stage Structure (GSS) are shown in Table 22 and Table 23, respectively.
The fire history improvements shown in Table 20 (above), where mapping improvements have picked up additional areas impacted by fire, resulted in the modelling showing an increase in vegetation within the juvenile age class and a reduction in the amount of vegetation without known fire history.
Table 22: Changes to reported tolerable fire interval, Victoria, 2020–21.
| Year | Below Min TFI | Within TFI | Above Max TFI | No Fire History |
|---|---|---|---|---|
| 2020–21 reported | 55% | 22% | 2% | 21% |
| 2020–21 Adjusted with fire history improvements | 56% | 22% | 2% | 20% |
| 2021–22 | 55% | 23% | 2% | 20% |
Table 23: Changes to the reported Growth Stage Structure, Victoria, 2020–21.
| Year | Juvenile | Adolescent | Mature | Old growth | No Fire History |
|---|---|---|---|---|---|
| 2020–21 | 23% | 17% | 30% | 4% | 26% |
| 2020–21 Adjusted with fire history improvements | 26% | 18% | 32% | 4% | 20% |
| 2021–22 | 24% | 19% | 33% | 4% | 20% |
Changes to FFMVic reported costs
Changes in the split between direct and indirect costs have been applied retrospectively in Table 24 to enable a direct comparison between the financial years shown, based on the accounting method developed in 2018–19 and applied in subsequent years.
FFMVic’s fuel management program investment is split between direct and indirect costs. Specific amendments have been made to better capture the activities related to fuel management and non-fuel management investment, because of improvements made to the accounting method and categorisation of expense types over time. The changes reported in this section for direct and indirect investment for the fuel management program from 2016–17 to 2021–22 are the result of changes made to the categorisation of costs as being direct, indirect and/or non-fuel management expenses.
Direct costs relate to investment that can be directly and reliably assigned to individual fuel management operations (such as materials, plant and aircraft hire, overtime and allowances, overnight accommodation and meals).
Indirect fuel management costs include expenses relating to base salaries, training, vehicles, equipment, planning and community engagement. This year, indirect costs also include investment in native vegetation improvements, which are activities undertaken to offset impacts to biodiversity resulting from FFMVic’s bushfire preparedness activities.
Non-fuel management expenses are typically those relating to preparedness and fire and emergency response activities (such as fire radio network costs, systems and aviation spending). These are not reflected in Table 24.
Table 24: Changes to reported fuel management expenditure in the current and previous reports
| Report year | 2016–17 ($m) |
2017–18 ($m) |
2018–19 ($m) |
2019–20 ($m) |
2020–21 ($m) |
2021–22 ($m) |
|---|---|---|---|---|---|---|
| Total fuel management expenditure reported in current year (based on 2018–19 accounting method) | 97.9 | 113.5 | 121.7 | 109.2 | 155.8 | 151.0 |
| Direct fuel management expenditure reported in current year | 11.2 | 14.6 | 18.2 | 10.9 | 42.4 | 37.3 |
| Indirect fuel management expenditure reported in current year | 86.7 | 98.9 | 103.5 | 98.2 | 113.4 | 113.7 |
| Total fuel management expenditure reported in that year | 107.9 | 107.8 | 121.7 | 109.2 | 155.8 | 151.0 |
| Direct fuel management expenditure reported in that year | 40.0 | 30.4 | 18.2 | 10.9 | 42.4 | 37.3 |
| Indirect fuel management expenditure reported in that year | 67.9 | 77.4 | 103.5 | 98.2 | 113.4 | 113.7 |
| Net change in fuel management reported expenditure | –10.0 | 5.7 | 0.0 | n/a | n/a | n/a |
n/a = not applicable.