Statewide outcomes and delivery in 2021–22
- Bushfire risk was modelled at 62%, well below the 70% state target.
- Forest Fire Management Victoria (FFMVic) and the Country Fire Authority (CFA) completed 435 planned burns across 65,480 hectares.
- FFMVic and CFA used mechanical treatments, such as slashing and mowing, to treat a further 16,058 hectares.
- FFMVic and the CFA delivered 32 cross-tenure burns to reduce risk across both public and private land.
- FFMVic built or upgraded 741 km of strategic fuel breaks.
- FFMVic invested $151 million on reducing bushfire risk.
- 23% of vegetation on public land was within tolerable fire interval.
- 37% of vegetation on public land was in the mature or old growth stages.
- 14 Traditional owner-led cultural burns were supported by FFMVic and CFA.
View Infographic
Joint Fuel Management Program
The Joint Fuel Management Program is a statewide program that manages bushfire fuels on public and private land over a three-year timeframe. The program integrates a risk-based bushfire management approach that the sector works within and shares personnel, resources, vehicles, and other equipment to maximise the delivery of priority fuel management activities.
FFMVic and CFA staff have developed the program in consultation with local councils, the viticulture and tourism industries, beekeepers, flora and fauna specialists, and drawing on knowledge from local communities including Traditional Owners, key stakeholders, local community leaders and other interested parties.
Bushfire risk
In Victoria, the landscape, climate and dispersed communities mean that there will always be a need to live with the risk of bushfires.
Therefore, it is necessary to understand what creates bushfire risk, where it exists in the environment and what the government, communities and individuals can do to reduce the likelihood and impact of bushfires.
Bushfire risk refers to the likelihood and consequence of something being impacted by a bushfire. It includes the likelihood of a bushfire starting, growing and spreading across a landscape, and the likelihood of things being in the path of the fire (such as houses, farms, roads, the natural environment and people).
Victoria is particularly susceptible to large and intense bushfires that can spread up to 30 kilometres or more across landscapes due to Victoria's terrain, naturally flammable vegetation and frequent exposure to hot, dry and windy weather.
Bushfire risk is affected by factors including the weather, the type and condition of fuels in the location and its topography, the location of people and assets, and the ability to prevent fires from igniting and to suppress them once they ignite.
Fuel-driven bushfire risk is the component of bushfire risk that is attributable to bushfire fuels, that is, vegetation that influences fire behaviour, such as the speed and intensity of a bushfire.
Fuel (vegetation) is a key element of fire behaviour and therefore is a major component of overall bushfire risk.
However, it is not a full measure of bushfire risk, because fuel is not the only factor that affects fire behaviour, or the likelihood and consequence of bushfires impacting people and the things they care about.
In general, the influence of fuel on fire behaviour decreases as fire weather conditions become more severe.
The sector models (using a computer program called Phoenix RapidFire) what impact fuel management activities have on reducing fuel-driven bushfire risk to inform fuel management planning and performance evaluation.
This impact is calculated and expressed as the percentage of fuel-driven bushfire risk ‘left over’ after bushfire fuels have been reduced, either through fuel management activities or bushfires (noting that currently, this calculation can only consider the contribution of planned burning and not non-burn fuel treatments such as slashing and mowing).
This approach focuses on the role that planned burns have in moderating the severity of bushfires at large scales and the consequential likely reduction in impacts.
In previous years’ reports, fuel-driven bushfire risk was referred to as residual risk.
Changes to reported fuel-driven bushfire risk
Victoria’s bushfire management sector continually works to improve the data and science that inform its decisions. As technology improves, better data becomes available for mapping accuracy improves and therefore the models improve. As such our metrics, such as fuel-driven bushfire risk or ecosystem metrics, are recalculated.
Each year, updates are made to this report to respond to these improvements - ensuring the best-available models and data inform public reporting. Readers should compare this report and past and future reports in that context. For the most accurate view of current and historical figures, you should always consult the most recent bushfire risk management report.
This year’s report includes more accurate results from those reported in 2020–21 as improvements were made to both fire history data and the Phoenix RapidFire bushfire simulation software - leading to re-calculation of fuel-driven bushfire risk across multiple years. Further details of these changes, including comparisons with historic figures, are provided in Appendix 1.
In this year’s bushfire risk management report, fuel management activities conducted by the CFA have also been included in the risk calculations. In coming years, advances in modelling and changes to the approach in accounting for contributions will enable the sector to report on how a broader range of prevention, preparedness and response activities – including mechanical fuel treatment – have contributed to reducing the risk of bushfires.
Statewide fuel-driven bushfire risk
FFMVic’s target is to maintain statewide fuel-driven bushfire risk at or below 70% of Victoria’s potential maximum levels, through fuel management on public land. The ‘maximum risk’ is calculated as the risk that would be present across the state under catastrophic bushfire conditions and if no fuel reduction activities had been undertaken and no bushfires had impacted the landscape (i.e. fuel hazard is at its maximum level possible). The calculated fuel-driven bushfire risk is the percentage of risk remaining, relative to the potential maximum risk (set at 100%), following fuel management and/or bushfire.
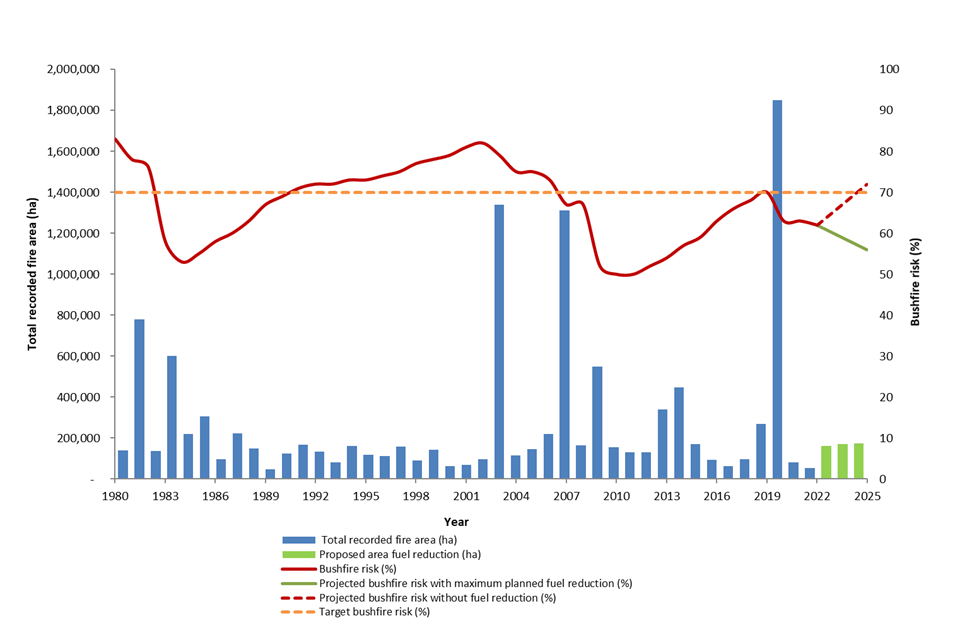
Figure 1 shows the profile of Victoria’s fuel-driven bushfire risk from 1980–2022, and its forecast risk to 2025. It shows how fuel-driven bushfire risk has and is projected to change over time, based on naturally occurring bushfires that planned fuel management activities.
This information is used to predict how future planned burning will reduce fuel-driven bushfire risk and to compare the effectiveness of different bushfire risk reduction strategies.
Figure 1: Fuel-driven bushfire risk profile, Victoria, 1980-2025. Data aligns with financial year.

Figure 1 shows the statewide fuel-driven bushfire risk:
- was 62% on 30 June 2022, down from a projected level of 65% in the absence of bushfires and fuel management
- was 1 percentage point lower than the 63% reported at the end of 2020–21, and
- decreased primarily because of planned burns offsetting the regrowth in fuels, with the sector maximising its fuel management program during spring 2021 and autumn 2022.
Re-accumulating fuel in Victoria’s forests can quickly increase fuel-driven bushfire risk if it is not properly managed through regular risk reduction activities. As Figure 1 shows, if the Joint Fuel Management Program (JFMP) is implemented in full (the ‘projected bushfire risk with maximum planned fuel reduction’ line), and there is little bushfire activity, modelling indicates bushfire risk will be 56% by 2025.
In the absence of fire (from planned burning or bushfires) the modelling indicates that bushfire risk is likely to rise to 72% over the next three years. The planned burning program will continue to be supported by an enhanced mechanical fuel treatment program, including treating areas in high-risk locations that are historically complex or difficult to treat with planned burning.
Relative contribution to risk reduction made by planned burning and bushfires
Modelling can be used to determine the relative contribution of planned burning and bushfires to risk reduction realised through the reduction of bushfire fuels. Presenting the contribution to risk reduction from planned burns and previous bushfires as a 10-year rolling average is a more meaningful and accurate way to present this data than doing it as a year-to-year contribution.
The reasons for this include:
- there is year-to-year variability in risk reduction contribution. For example, in years with very large bushfires, such as the 2019–20 fire season, the majority of risk reduction would be attributable to bushfires, whilst in years with minimal bushfire activity, almost 100% risk reduction is attributable to planned burning, and
- additionally, planned burns provide risk reduction benefits that last for several years. Reporting on risk reduction from planned burns on a rolling 10-year window captures the continued risk-reduction effect of burns conducted in previous years, as well as bushfires and planned burns from the reporting year.
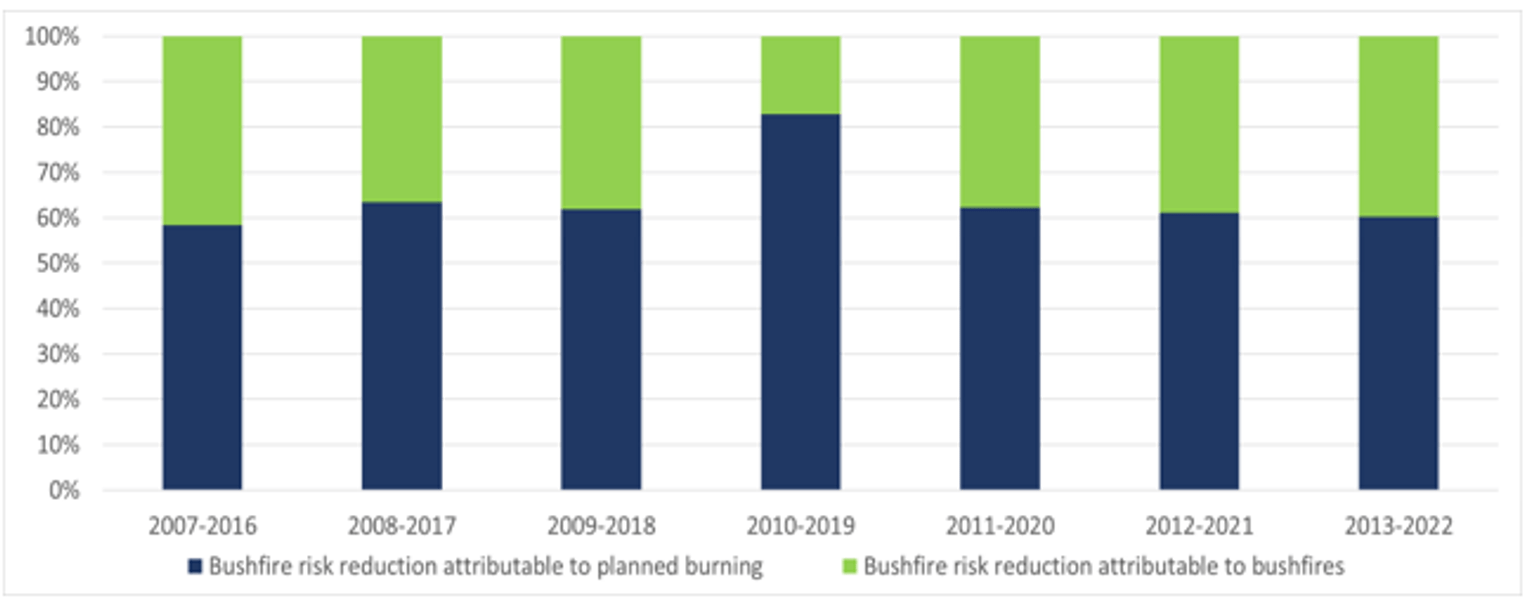
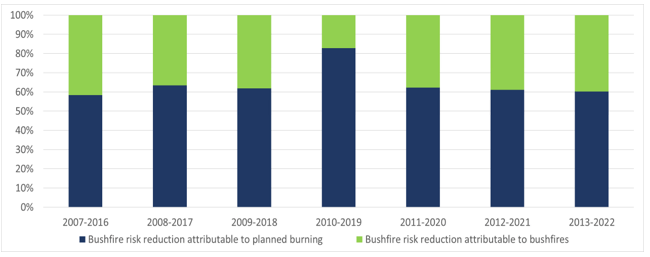
Although there is considerable variation from year to year, Figure 2 shows that most risk reduction has been achieved through planned burning, even when considering the influence of major bushfires (such as the 2009 Black Saturday bushfires and 2019–20 Black Summer bushfires).
Analysis shows that despite bushfires impacting a substantially greater area than planned burns over the last 10-year period, planned burning accounts for more risk reduction than bushfires.
From July 2013 to June 2022, planned burns accounted for approximately 22% of the total burnt area across the State, with bushfires contributing to the remaining 78 %. However, planned burning accounted for 60% of the total risk reduction across Victoria, compared to 40 % risk reduction from bushfires.
This is a result of using the best available science and data to identify and target areas for planned burning in strategic locations (such as close to high-value assets) to reduce the risk to life and property, whereas unplanned bushfires are indiscriminate and may occur anywhere in the landscape.
Figure 2 shows the rolling 10-year average of fuel-driven bushfire risk reduction attributable to planned burning and bushfires across Victoria since 2007.
Figure 2: Rolling 10-year average fuel-driven bushfire risk reduction attributable to planned burning and bushfires, Victoria, 2007–22.
Ecosystem resilience
The design and delivery of FFMVic’s fuel management program aim to meet the primary objectives for bushfire management outlined in the Code of Practice for Bushfire Management on Public Land 2012 (the Code):
- to minimise the impact of major bushfires on human life, communities, essential and community infrastructure, industries, the economy and the environment; human life will be afforded priority over all other considerations
- to maintain or improve the resilience of natural ecosystems and their ability to deliver services such as biodiversity, water, carbon storage and forest products.
Both objectives in the Code of Practice for Bushfire Management on Public Land 2012 have elements related to the protection and maintenance of environmental health.
FFMVic’s fuel management program considers how best to meet both objectives and recognises the need to manage these objectives over different temporal and geographic scales.
This is achieved by managing fuels and conducting burns to protect environmental values and promote ecosystem resilience. Fire is a natural and vital process for many of Victoria’s ecosystems. Ecosystem resilience reflects this natural relationship between fire, regeneration and ecosystem health.
To understand the effects of both natural bushfires and planned burning on the environment, FFMVic measures and monitors the timing and number of fires in different types of vegetation.
These are measured relative to:
- the time taken for vegetation types to reach reproductive maturity following fire – referred to as the tolerable fire interval (TFI), and
- the age classes of different types of vegetation – referred to as the growth stage structure (GSS).
FFMVic also partners with universities and other academic institutions to conduct research that improves how ecosystem resilience is represented and measured.
Changes to reported ecosystem resilience
Between this report and the 2020–21 report, a range of improvements were made to the mapping of past fires. This included mapping improvements that identified additional areas impacted by past fires.
This resulted in changes to calculated values of TFI and GSS for 2020–21 relative to those reported last year, including an increase in vegetation within the juvenile age class and a reduction in the amount of vegetation without known fire history.
The below-reported values for 2021–22 incorporate these mapping improvements. Appendix 1 provides detail of changes to 2020–21 values.
Tolerable fire intervals across the state
It is desirable to minimise the total area burnt while vegetation is below reproductive maturity (minimum TFI) because it might affect the vegetation’s ability to successfully regenerate. This is sometimes unavoidable, to reduce fuel-driven bushfire risk to human life, property or other important values.
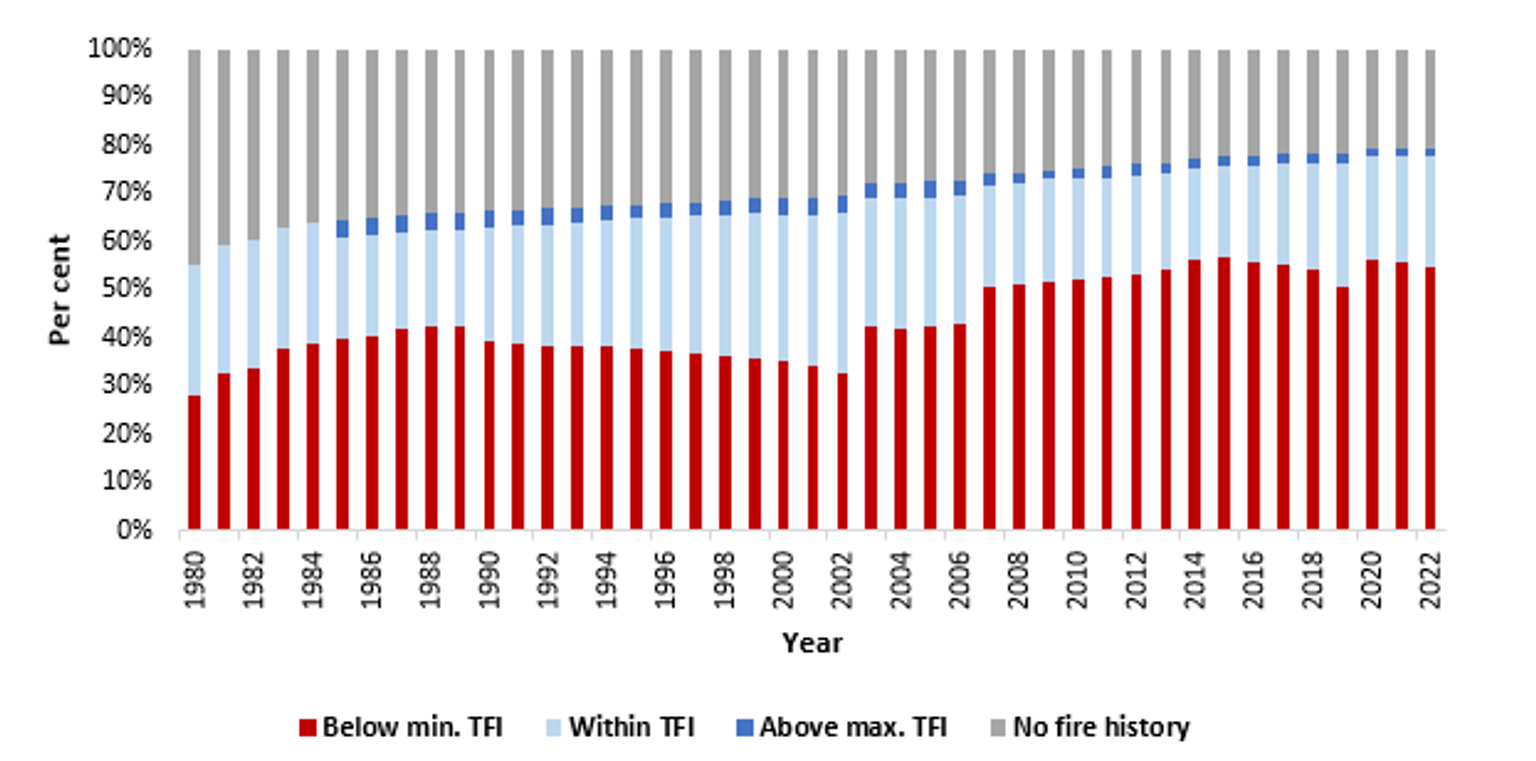
Figure 3 shows the TFI status of vegetation on public land across Victoria since 1980. It shows that in 2021–22, the proportion of vegetation:
- below minimum TFI was 55%– although this was an improvement, with 71,750 fewer hectares than the previous year in this category, the proportion is still high because of the impacts of the 2019–20 bushfires
- within TFI increased to 23%
- above maximum TFI remained at 2%, and
- with no fire history data to enable assessment remained at 20%.
Figure 3: TFI status of vegetation on public land, Victoria, 1980–2022. Data aligns with financial year.
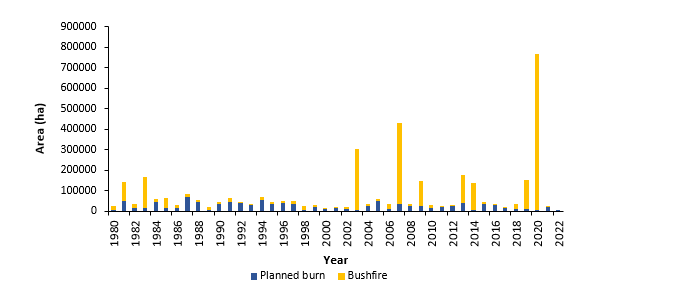
Figure 4: Area of public land burnt while below minimum TFI, Victoria, 1980-2022. Data aligns with Financial year.

Figure 4 shows the area of public land in Victoria burnt by bushfires and planned burning while below minimum TFI since 1980. It shows that in 2021–22:
- 12,808 hectares of vegetation on public land was burnt by planned burning or bushfire while below minimum TFI, less than half the area burnt under minimum TFI in 2020–21, and
- of this, 11,320 hectares were burnt through planned burns; this represents less than 0.2% of Victoria’s public land.
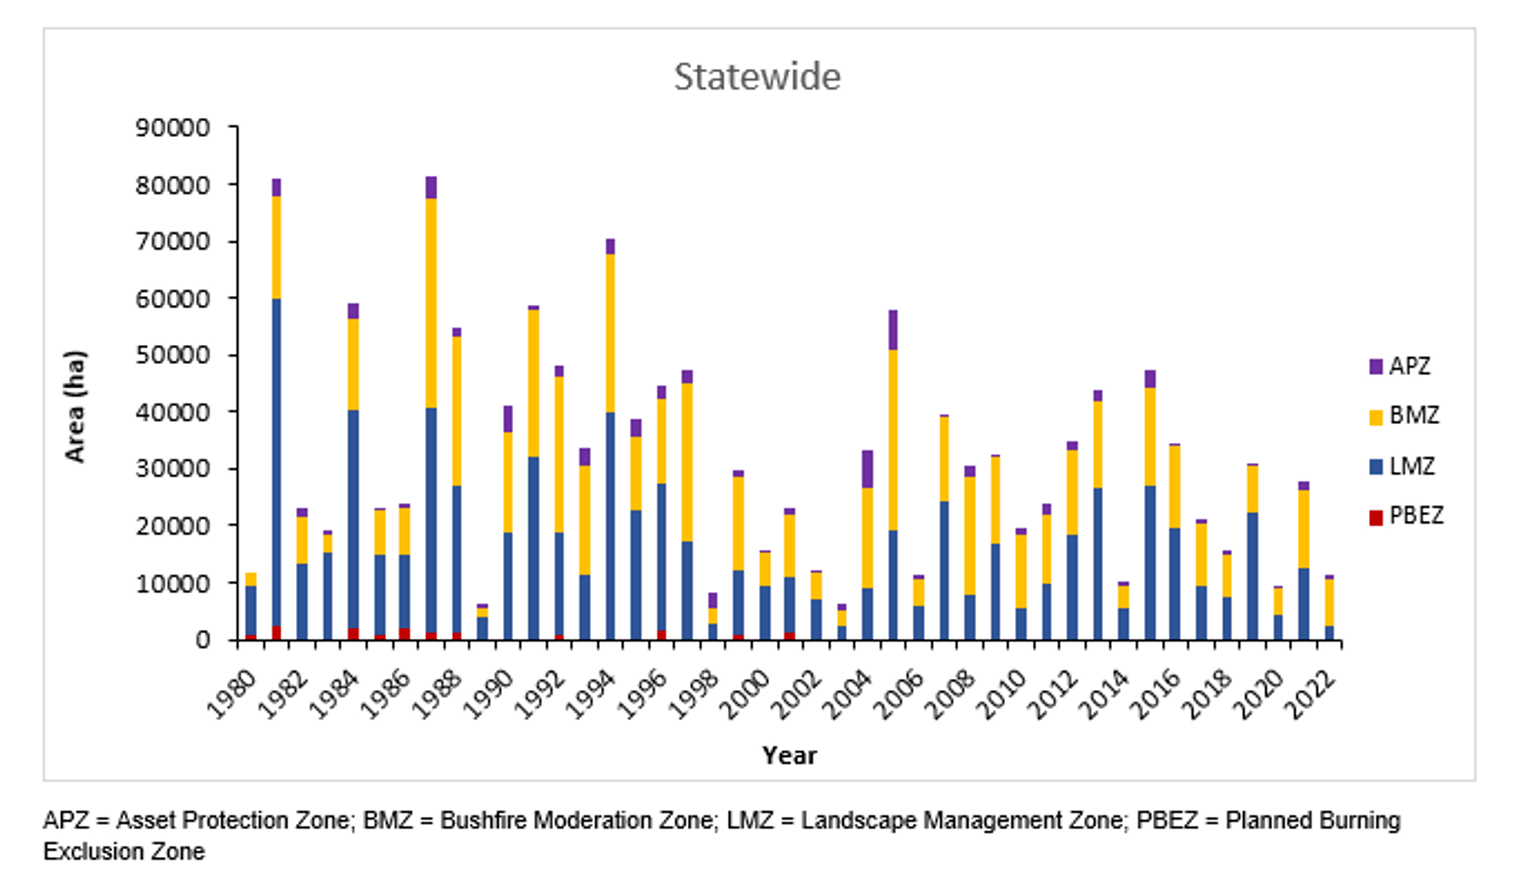
Figure 5: Area treated by planned burning while below minimum TFI, by fire management zone, 1980-22. Data aligns with financial year.
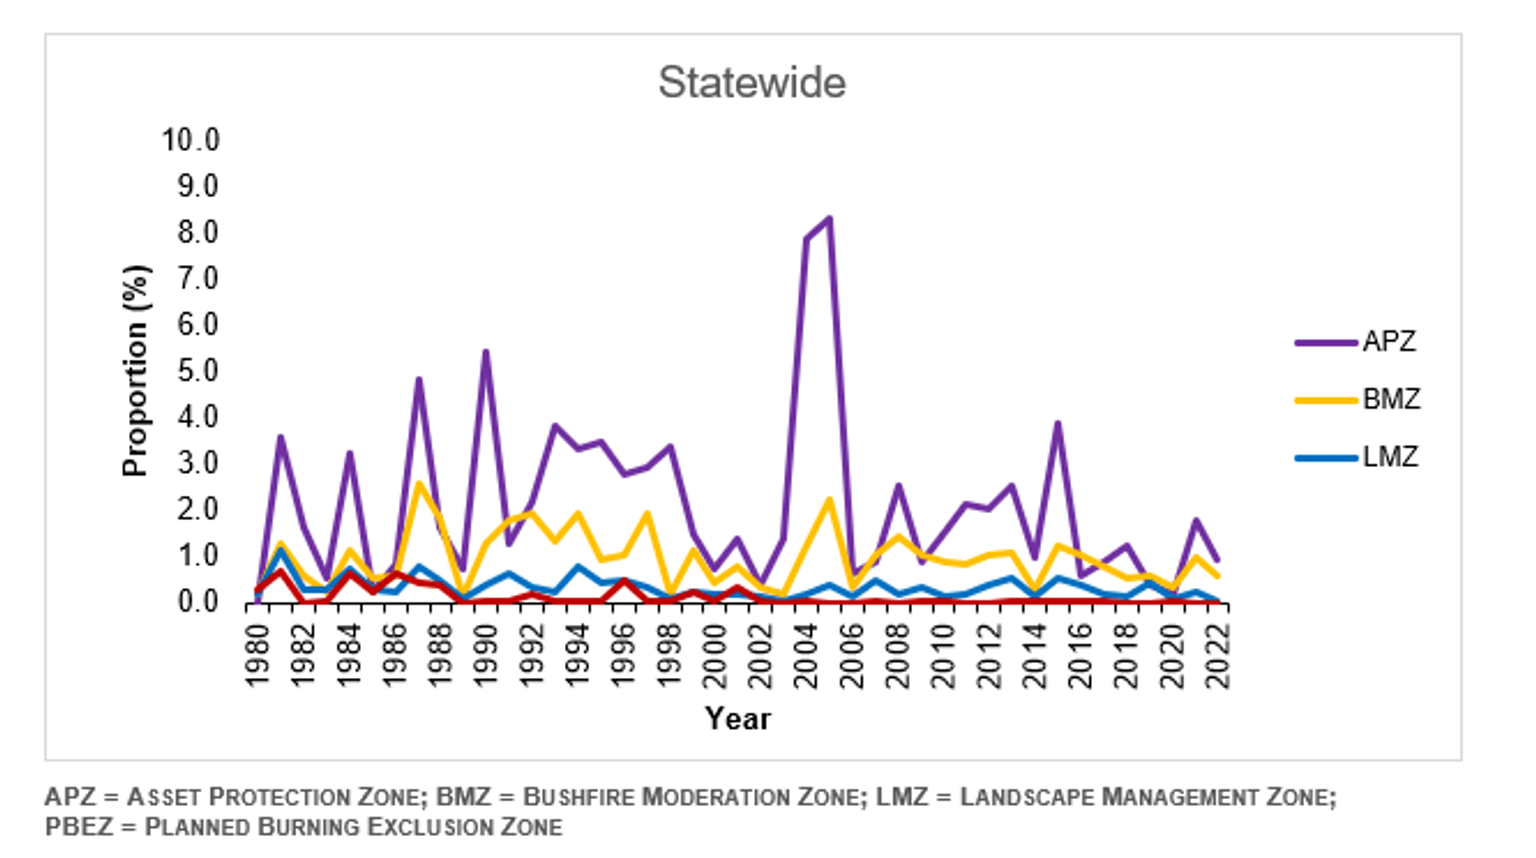
Figure 6: Proportion of fire management zone treated by planned burning while below minimum TFI, 1980-2022
Figure 5 shows the area of each fire management zone treated by planned burning while below minimum TFI, since 1980. In 2021–22:
- 754 hectares in Asset Protection Zones
- 7,989 hectares in Bushfire Moderation Zones
- 2,577 hectares in Landscape Management Zones
- 0 hectares in Planned Burn Exclusion Zones.
Figure 6 shows the proportion of the total hectares in each fire management zone treated by planned burning while below minimum TFI, since 1980. In 2021–22 there were:
- 0.9% in Asset Protection Zones
- 0.6%in Bushfire Moderation Zones
- 0.1% in Landscape Management Zones, and
- 0.0% in Planned Burn Exclusion Zones.
Understanding the impacts of planned burns and bushfires on TFI is useful to inform regional-scale decision-making. However, when considered in isolation, TFI may not account for finer-scale vegetation responses to fire, or the differing severity and patchiness of planned burn operations.
Regional bushfire management strategies aim to minimise areas burnt while below minimum TFI, while delivering on other priority objectives.
Victoria continues to improve:
- it's understanding of TFI by monitoring the responses of vegetation to fire and investing in research that improves the ability to predict these responses, and
- the accuracy of TFI mapping by updating distribution models for key flora species on which minimum TFIs are based.
Growth stage structure across the state
FFMVic measures and tracks the distribution of vegetation growth stage structure (GSS) on public land across the landscape to ensure an optimal mix of plant developmental stages is maintained. These different growth stages provide important resources and habitat structures for species.
Maintaining a desirable mix of GSS across the landscape is an important component of ecosystem resilience. It can take many years before the proportion of vegetation in older growth stages recovers to the levels it was before major bushfire events. Some vegetation communities can take more than 50 years to reach maturity.
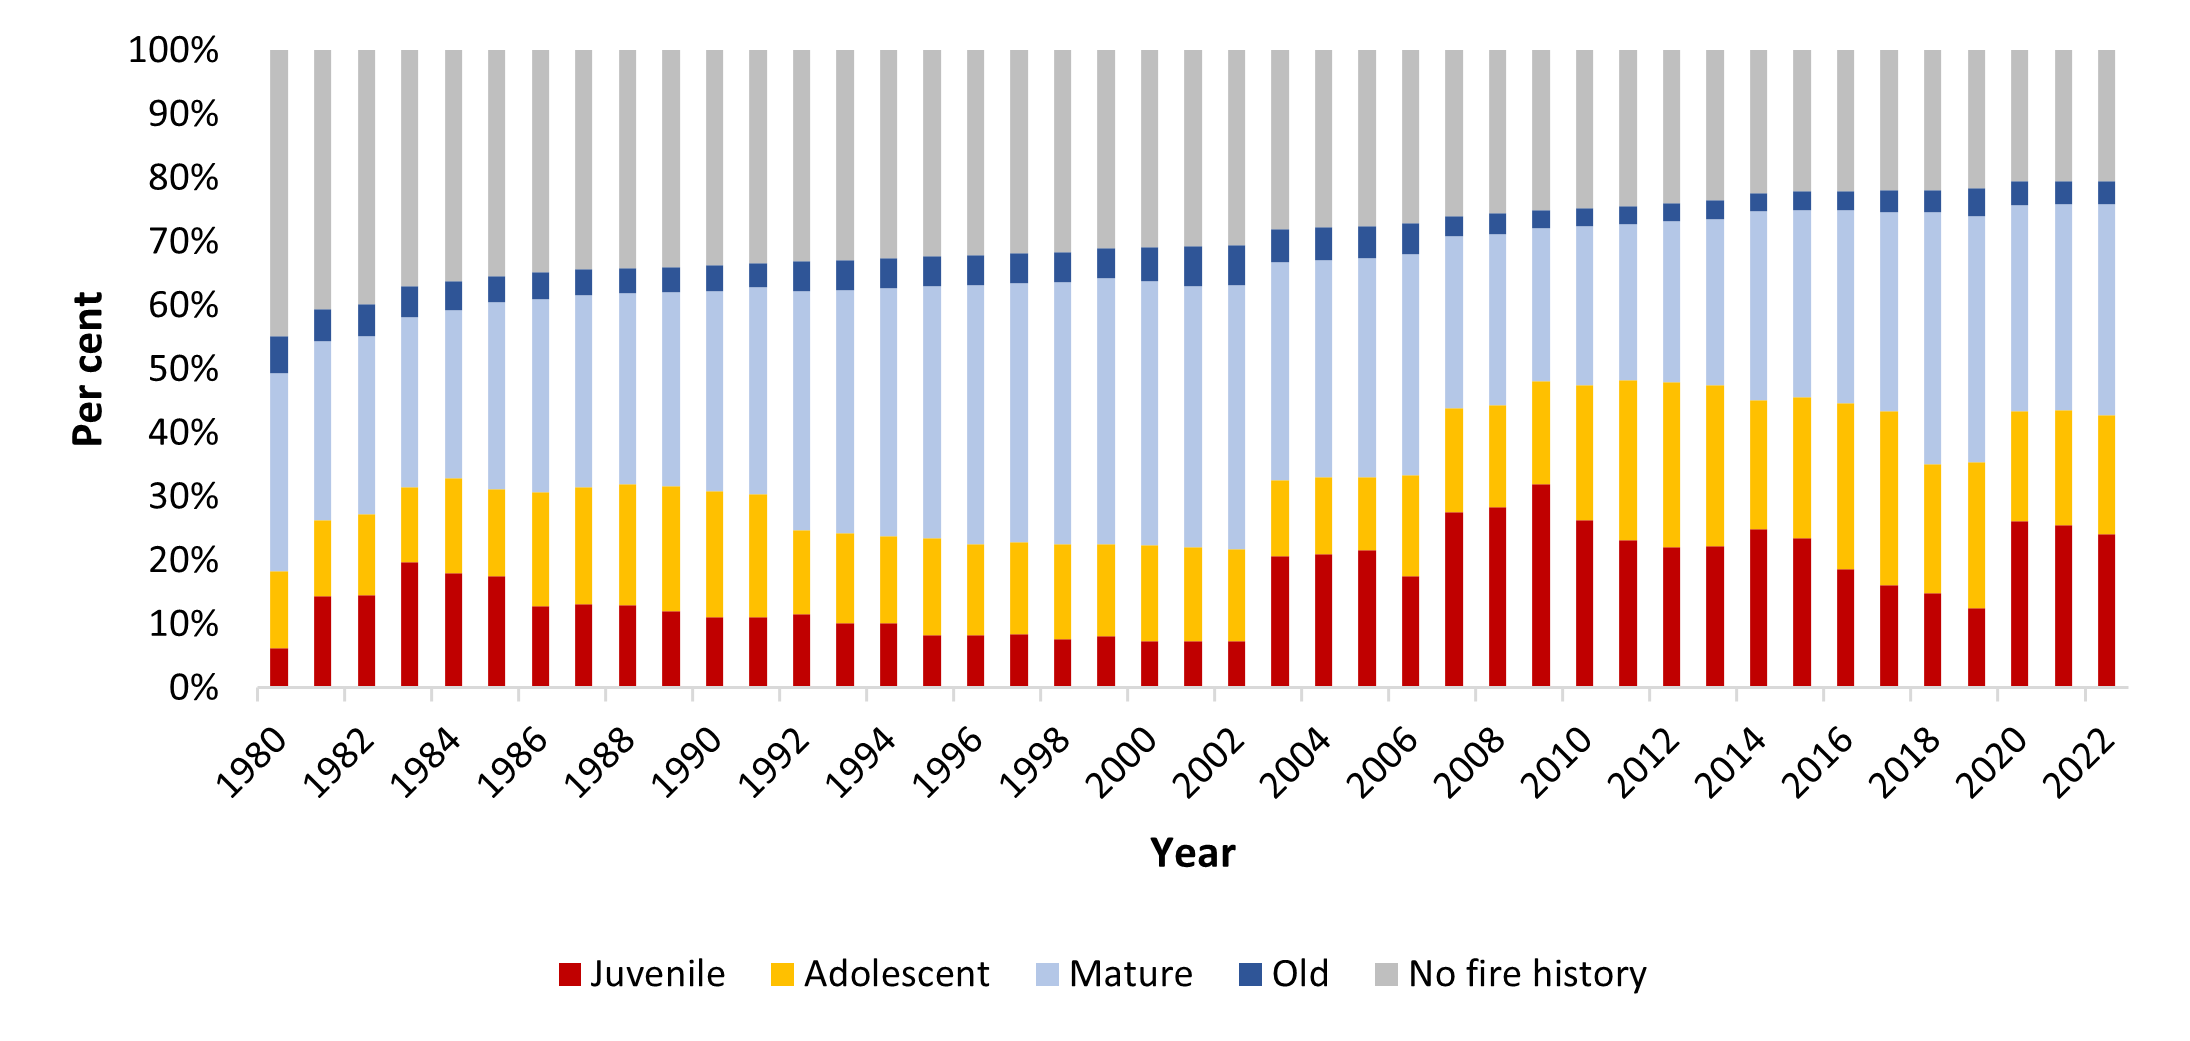
Figure 7 shows changes in statewide GSS since 1980. It shows the proportion of vegetation on public land in the:
- juvenile growth stage decreased from 26% in 2020–21 to 24% in 2021–22
- adolescent growth stage increased from 18% to 19%
- mature growth stage increased from 32% to 33%
- old growth stage remained at 4%.
The proportion of public land with no recorded fire history remained at 20% in 2021–22. This area has been declining steadily since 2003.
Figure 7: GSS status of vegetation on public land, Victoria, 1980–2022

Updated