Performance against key bushfire risk management measures
The Government funds FFMVic to reduce the impact of major bushfires on people, property and the environment. Performance is measured against objective indicators which are captured in Table 10.
In 2022-23, FFMVic met or exceeded each of its key performance measures for bushfire risk management on public land.
Table 10: Budget Paper 3 Service Delivery Results, 2022–23.
| Performance measures | Unit of measure | 2021-22 Actual | 2022-23 Target | 2022-23 Actual | Performance variance relative to target % | Result |
| Outcome: Statewide (fuel-driven) bushfire risk is maintained at or below the target | % | 62 | 70 | 65 | +7% | achieved |
| Activity: Strategic fuel breaks built or upgraded* | km | 741 | 152 | 235** | +55% | achieved |
| BP3 Strategic fire access roads improved | km | 3,791 | 2,000 | 2,155 | +8% | achieved |
| Bridges or crossings on the strategic fire access road network replaced or upgraded | # | 10 | 10 | 0% | achieved | |
| Stakeholder and community forums on bushfire management and planned burning held | # | 12 | 13 | +8% | achieved | |
| Fires contained at less than five hectares to suppress fires before they become established, minimising impact | % | 80 | 92.4 | +16% | achieved | |
| The proportion of Community-based bushfire management partnerships rated as high-functioning | % | 80 | 80 | 0% | achieved | |
| 100% of burns identified in the Joint Fuel Management program prepared for delivery | date | Sept 2022 | Sept 2022 | 0% | achieved | |
| Fires contained at first attack to suppress fires before they become established, minimising impact | % | 80 | 97.7 | +22% | achieved |
*The lower 2022–23 target reflects the remaining activities required to complete the Building Strategic Fuel Breaks program target of 1,447 kilometres of fuel breaks over the life of the program
**Note that the total distance of strategic fuel breaks has been recalculated with more accurate GIS data and therefore differs from the number documented in the DEECA Annual Report 2022-23.
Fuel management performance
Planned burning and non-burn fuel treatment
Under the Forests Act 1958, DEECA is responsible for the planned prevention of fire in State forests, national parks and other protected public land in Victoria. It does this through FFMVic, which is led by DEECA and draws on partnership arrangements with Parks Victoria, VicForests and Melbourne Water.
The Code of Practice for Bushfire Management on Public Land 2012 specifies the objectives of fuel management and informs the planning and delivery of fuel management on public land. Fuel management is a key strategy for reducing bushfire risk and is one of the key activities used by FFMVic to protect communities from bushfires.
FFMVic’s fuel management target is to maintain statewide fuel-driven bushfire risk at or below 70% of Victoria’s potential maximum level through fuel management in State forests, national parks, and other protected public land. Statewide fuel-driven bushfire risk on 30 June 2023 was 65%, which achieves the target.
Table 11: Snapshot of FFMVic statewide outcomes and delivery, 2022–23.
| Performance Measures | Unit of measure | 2021-22 Actual | 2022-23 Target | 2022-23 Actual |
|---|---|---|---|---|
| Outcome: Statewide fuel-driven bushfire risk | % | 62 | 70 | 65 |
| Activity: Area treated with fuel management | ha | 77,927 | n/a | 92,257+ |
| Activity: Cross-tenure burns | number | 32 | n/a | 22 |
| Activity: Cross-tenure burns | hectare | 16,981 | n/a | 10,282 |
| Activity: 100% of burns identified in the Joint Fuel Management Program prepared for delivery | date | n/a | Sept 2022 | Sept 2022 |
| Outcome: Vegetation on public land within tolerable fire interval | % | 23 | n/a | 28 |
| Outcome: Vegetation on public land in the mature or old-growth stages | % | 37 | n/a | 38 |
| Investment: Total cost of FFMVic fuel management program | $M | 151 | n/a | 141.1 |
*Note that the total area treated with fuel management reported in this table does not include the area of Traditional Owner-led burns supported by FFMVic and therefore differs to the number documented in the DEECA Annual Report 2022-23.
An overview of FFMVic’s statewide outcomes and delivery for 2022–23 is shown above (Table 11). The year-round FFMVic fuel-driven bushfire risk reduction program treated 92,257 hectares, with 214 planned burns across 75,500 hectares and 1,602 non-burn fuel treatments across 16,757 hectares.
The majority of burns (144 burns) were undertaken for the primary purpose of risk reduction, however, 28 burns were primarily delivered to improve ecological resilience outcomes.
Table 12: Statewide fuel reduction treatments.
| Fuel reduction statewide 2022-23 | Total Hectares | Total Number of treatments |
|---|---|---|
| Area treated by planned burning | 75,500 | 214 |
| Ecological burns | 11,802 | 28 |
| Risk reduction burns | 63,628 | 144 |
| Window/heap | 70 | 42 |
| Area treated by non-burn fuel treatments* | 16,757 | 1,602 |
| Mechanical mulching | 2,469 | 193 |
| Mechanical slashing or mowing | 10,460 | 1,319 |
| Other methods | 3,826 | 90 |
| Total area treated to reduce fuel-driven bushfire risk | 92,257 | 1,816 |
*Includes treatments to manage storm debris
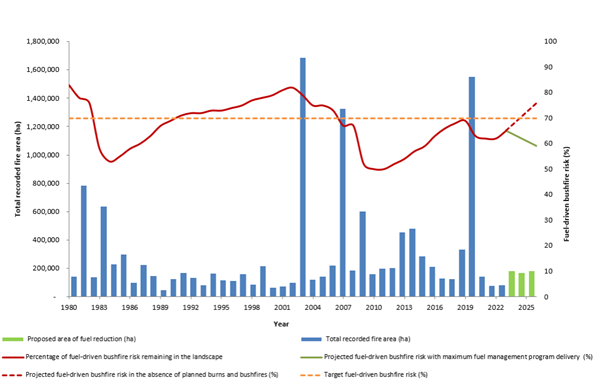
Figure 2 indicates that if the Joint Fuel Management Program is implemented in full, and there is no bushfire activity, fuel-driven bushfire risk will remain below 70% (projected to be 59% by 2026).
In the absence of fire (from planned burning or bushfires) the modelling indicates that fuel-driven bushfire risk would rise to 76% over the next three years.
Figure 2: Victoria’s fuel-driven bushfire risk from 1980 - 2023
Planned burn ignition opportunities
FFMVic considers when conditions are favourable to deliver planned burning safely and effectively and utilises appropriate burning windows to deliver the planned burning program.
Most of the planned burning program continues to be delivered in the late summer and autumn, when weather conditions are typically more stable, there is a lower risk of extreme fire danger days, and the fuel conditions are appropriate to achieve the desired burn objective.
Under these conditions, fire behaviour is generally more manageable and predictable.
In 2022–23, FFMVic planned 381 burns for delivery as a part of Year 1 of the JFMP. Of the 381 burns, 234 (61.4%) burns were delivered (including 20 Traditional Owner-led cultural burns). This compares with the 2021–22 year when 505 burns were planned to be delivered in Year 1 of the JFMP but only 194 (38%) were delivered.
From 381 burns listed on Year 1 of the JFMP for 2022–23, FFMVic identified 166 priority planned burns, with the state and regions identifying which burns would reduce risk the most.
This prioritisation focuses FFMVic’s efforts on the burns that deliver the greatest risk reduction when weather conditions that suit those areas are predicted. In 2022–23, 76 (46%) of the identified 166 priority burns went ahead.
During 2022-23, of the 381 burns planned to be delivered, 335 were scheduled at some point. On average, each of the burns that were scheduled were rescheduled 6 times. There was no suitable scheduling opportunity for 46 burns.
This is due to constraints such as unsuited fuel and weather conditions, as well as FFMVic's prioritisation approach leading to higher priority burns being the focus for scheduling and delivery in years where windows for delivery are limited.
Table 13: Snapshot of planned burn planning, scheduling, and delivery, 2022–23.
| Stage | Number |
|---|---|
| Planned | 381 |
| Scheduled | 335 |
| Delivered | 234 |
| Not delivered | 101 |
| Priority Burns identified (of 381) | 166 |
| Priority burns delivered | 76 |
In 2021, FFMVic released a prototype tool (the Burn Opportunity Reporting Tool) to track ignition opportunities on a day-by-day basis and assess weather conditions providing an opportunity to ignite each burn as originally planned. The tool is partly automated and requires some manual review for accuracy. The tool does not report on Traditional Owner cultural burns or heap burns (small debris pile burns at point locations), so numbers in this section will differ slightly from figures stated elsewhere in the report.
Table 14 indicates the reasons why burns were not ignited as recorded in BORT.
Table 14: Factors influencing the delivery of planned burns in 2022–23.
| Factors influencing delivery | Proportion (%) |
|---|---|
| Weather conditions not suitable | 64.5 |
| Weather prescription window occurred prior to completion of burn planning or preparation | 24 |
| Fuel conditions not suitable | 6.6 |
| Possible missed opportunity * | 5.4 |
| Financial Considerations | 0.2 |
| Operation risk too high | 0.3 |
| Resources availability during the peak delivery period | 0.04 |
| Other | 0.04 |
In most cases, ignition opportunities were limited by:
- weather conditions being unsuitable
- planning or preparation of the burn having not been completed in time, or
- fuels (vegetation) not being suitable to meet the objectives of the burn.
In 5.4% of cases, BORT recorded a possible missed opportunity for a burn ignition, based on consideration of weather conditions being within prescription and burns being listed as ‘Ready’ (planning and preparation complete).
This figure primarily arises from the automated assessment of opportunities, with low levels of manual interpretation to ensure accuracy. While some opportunities are likely to have been missed, it is likely lower than 5.4%. Increased manual interpretation of automated data will be a focus for improvement in future years.
BORT indicates that in 24% of cases when conditions were suitable, burns were not ignited due to planning and preparation having not been completed.
This is likely an overestimate of the automated assessment, however is still an important factor impacting burn ignitions, particularly early in the autumn season when conditions are more suited to burn delivery. In 2022-23, planning and preparation were impacted by spring weather conditions.
Spring brought heavy rain and floods across large parts of the state, resulting in a significant number of FFMVic resources being directed to support the October 2022 flood event. This diverted resources away from planning and preparation of the bushfire risk reduction program.
These wetter-than-average conditions also made forests inaccessible to crew and machinery, further delaying FFMVic from completing preparation activities. Despite these impacts, 81% of the burn program was Ready for delivery by the beginning of the autumn planned burning season in March 2023.
Where planning and preparation capacity was restricted, FFMVic focused on ensuring the highest priority burns were planned and prepared.
For FFMVic to consider a burn to be Ready for delivery all planning and preparation works need to be completed including track works, hazardous tree treatments, contingency planning, risk assessments, mapping, and community engagement, amongst other things.
In many cases, much of this work was close to completion, but final hurdles such as legal agreements with partnering landholders or identification of cultural heritage sites during preparation delayed the finalisation of all necessary tasks. In these cases, a burn will not be recorded as Ready until these final issues are resolved.
BORT assesses every burn on Year 1 of the JFMP each day for suitable weather conditions for delivery. In many cases, narrow opportunities are identified which may not be sufficient for the size of the operation. In others, while there may be a weather window, fuel conditions on the ground may be too wet or too dry.
The reporting system automatically considers this a missed opportunity, requiring manual interpretation of whether in fact, the weather conditions were suitable for a particular burn. If the burn has not reached a standard where it’s considered Ready then the reason for the missed opportunity is recorded as ‘Weather prescription window occurred before completion of burn planning or preparation’ regardless of whether the weather conditions were suitable.
This reason can be manually overwritten in BORT, but with large numbers of staff deployed to fires, floods or delivery of planned burns this data validation step can be missed. This is an area of improvement for future versions of the reporting tool.
FFMVic reschedules burns frequently to optimise burn delivery across the State. Staff can schedule burns out to nine days from planned ignition. Burns may be added to the forward schedule to be considered as options for delivery or to provide scheduling flexibility to account for weather variability, resource availability or local community concerns.
A rescheduled reason is recorded for any burn once it is within four days of the planned ignition day. This provides a balance between allowing flexibility in operational burn scheduling and recording accurate and relevant details for public reporting. Table 15 indicates that weather and fuel moisture were the primary reasons that burned within 4 days of the planned ignition being rescheduled.
In 50% of cases this year, burns were rescheduled beyond that 4-day window (5-9 days out from planned ignition) and no reason was recorded. Because of the higher level of uncertainty this far out from a delivery window, it’s not practical or accurate to record a single reason for rescheduling so this data is reported as No reason given.
Table 15 indicates the reasons scheduled burns were rescheduled in 2022-23.
Table 15: Reasons the delivery of scheduled burns were rescheduled, Victoria, 2022–23.
| Reason | Number of times occurred | Proportion of instance (%) |
|---|---|---|
| Burns rescheduled 5-9 days out from planned ignition | ||
| No reason given | 589 | 50 |
| Burns rescheduled within 4 days of planned ignition | ||
| Weather | 287 | 24.4 |
| Fuel Moisture | 222 | 18.9 |
| Resourcing | 32 | 2.7 |
| Miscellaneous | 29 | 2.5 |
| Risk | 12 | 1 |
| Priority | 3 | 0.3 |
| Smoke | 1 | 0.1 |
| Tourism | 1 | 0.1 |
FFMVic worked closely with communities, stakeholders, and other government agencies – including the Environment Protection Authority and Department of Health – to minimise the smoke impacts of planned burns on communities.
This included scheduling burns in weather conditions that minimised impact, or rescheduling burns to outside peak holiday times.
FFMVic has indicated it will continue to improve the information captured about burn planning, scheduling and operational delivery in 2023–24.
Cross tenure burning
FFMVic’s fuel management program is strengthened by the Victorian Government’s Safer Together program, which ensures FFMVic works in partnership with the CFA, Fire Rescue Victoria (FRV), the Department of Transport and Planning (DTP), local government and other sector partners to support integrated, evidence-based bushfire risk management across all public and private land in Victoria.
In 2022–23, 22 cross-tenure planned burns were delivered by FFMVic and the CFA, including on large areas of private land. Most of these burns were regionally critical due to them being aligned with regional Bushfire Management Strategies and providing high levels of risk reduction value.
All cross-tenure planned burns are included in the fuel-driven bushfire risk calculations.
There was less cross-tenure burning activity in 2022–23 (in terms of both the number of burns and hectares treated) than last financial year (Table 16).
Table 16: Cross-tenure planned burns, by region, Victoria, 2022–23 and 2021–22.
| 2022-23 | 2021-22 | |||
|---|---|---|---|---|
| Region | No. burns | Hectares | No. burns | Hectares |
| Barwon South West | 14 | 1,512 | 12 | 9,172 |
| Gippsland | 3 | 5,408 | 5 | 3,858 |
| Grampians | 2 | 2,908 | 6 | 1,031 |
| Hume | 1 | 419 | 1 | 2,693 |
| Loddon Mallee | 0 | 0 | 0 | 0 |
| Port Phillip | 2 | 37 | 8 | 227 |
| Total | 22 | 10,282 | 32 | 16,981 |
Strategic fuel breaks
FFMVic’s Strategic Fuel Breaks program maintains and expands the network of strategic fuel breaks across Victoria to reduce the risk and impact of bushfires near high-priority locations close to townships, key assets, water catchments and sensitive environments, and in parts of the landscape advantageous to support bushfire suppression and reduction in the size of fires.
Strategic fuel breaks are a strip of land where vegetation has been permanently modified to reduce the rate of spread and intensity of fire for the direct protection of assets and/or assist fire suppression.
In 2022–23, FFMVic invested $7.2 million in constructing 235 kilometres of strategic fuel breaks, bringing the total construction over the past three years to 1,489 kilometres (exceeding the Government’s target of 1,447 kilometres).
Table 17: Total kilometres of strategic fuel break construction in each region.
| Region | 2020-21 | 2021-22 | 2022-23 | Total |
| Barwon South West | 28.1 | 66.4 | 94.6 | |
| Gippsland | 361.4 | 202.4 | 87.8 | 651.6 |
| Grampians | 27.9 | 27.9 | ||
| Hume | 134.7 | 106.7 | 95.7 | 391 |
| Loddon Mallee | 141 | 4.4 | 145.4 | |
| Port Phillip | 131.1 | 46.9 | 178 | |
| Regions Total | 524 | 730 | 235* | 1,489 |
*Note that the total distance of strategic fuel breaks has been recalculated with more accurate data and therefore differs from the number documented in the DEECA Annual Report 2022-23.
In addition, FFMVic invested $21 million in improving 2,155 kilometres of the strategic fire access road network, including upgrading or replacing 10 bridge crossings.
Ecosystem resilience
The state’s fuel management program recognises the need to manage the impact of major bushfires on human life and property and to maintain the resilience of natural ecosystems over different temporal and geographic scales.
This is achieved by conducting burns to promote ecosystem resilience and minimise negative impacts.
Vegetation communities are assumed to have thresholds for tolerating time between fire disturbances, known as tolerable fire interval (TFI) which allow regeneration. Growth stage structure (GSS), a mix of growth stages and habitat structures, is another measure of ecosystem resilience.
Fire is a natural and vital process for many of Victoria’s ecosystems. By using TFI as a guide for when to burn, ecosystem health can be promoted. Ecosystem resilience reflects this natural relationship between fire, regeneration and ecosystem health.
In 2022-23, FFMVic conducted 28 planned burns for the primary purpose of improving ecological outcomes.
Tolerable fire intervals across the state
For any given plant community, the minimum and maximum tolerable fire interval (TFI) between successive fires are determined by the time required for key fire response species to mature and set seed, as well as their time to extinction without fire disturbance.
TFI thresholds provide minimum and maximum time intervals of fire frequency to ensure ecosystem resilience. However, sometimes burning below the minimum TFI is unavoidable, to reduce fuel-driven bushfire risk to human life, property or other important values.
There have been some areas of improvement in the TFI status of vegetation on public land across Victoria since the 2021–22 report. There were 367,781 fewer hectares of vegetation below minimum TFI, and the area within TFI increased to 28%.
Understanding the impacts of planned burns and bushfires on TFI is useful to inform regional-scale decision-making. However, when considered in isolation, TFI may not account for finer-scale vegetation responses to fire, or the differing severity and patchiness of planned burn operations.
Regional Bushfire Management Strategies aim to minimise areas burnt while below minimum TFI while delivering on other priority objectives.
Victoria continues to improve:
- its understanding of TFI by monitoring the responses of vegetation to fire and investing in research that improves the ability to predict these responses, and
- the accuracy of TFI mapping by updating distribution models for key flora species on which minimum TFIs are based.
Growth stage structure across the state
Growth Stage Structure (GSS) measures and tracks the distribution of the age classes of different types of vegetation from juvenile to old across the landscape, to ensure an optimal mix of plant developmental stages is maintained.
These different growth stages provide important resources and habitat structures for species.
Vegetation's GSS depends on when it was last burnt or otherwise disturbed. Maintaining a desirable mix of GSS across the landscape is an important component of ecosystem resilience.
It can take many years before the proportion of vegetation in older growth stages recovers to the levels it was before major bushfire events. Some vegetation communities can take more than 50 years to reach maturity.
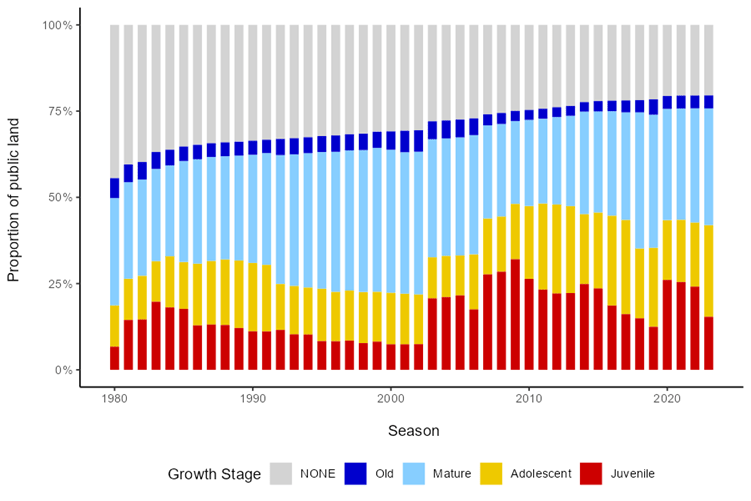
Figure 3: Statewide percentage of vegetation on public land by growth stage structure

Figure 3 indicates changes in state-wide GSS since 1980. It indicates the proportion in 2022–23 of vegetation on public land in the:
- juvenile growth stage decreased from 24% in 2021–22 to 15% in 2022–23
- adolescent growth stage increased from 19% to 27%
- mature growth stage increased from 33% to 34%
- old growth stage remained at 4%.
The proportion of public land with no recorded fire history remained at 20% in 2022–23. This area has been declining steadily since 2003.
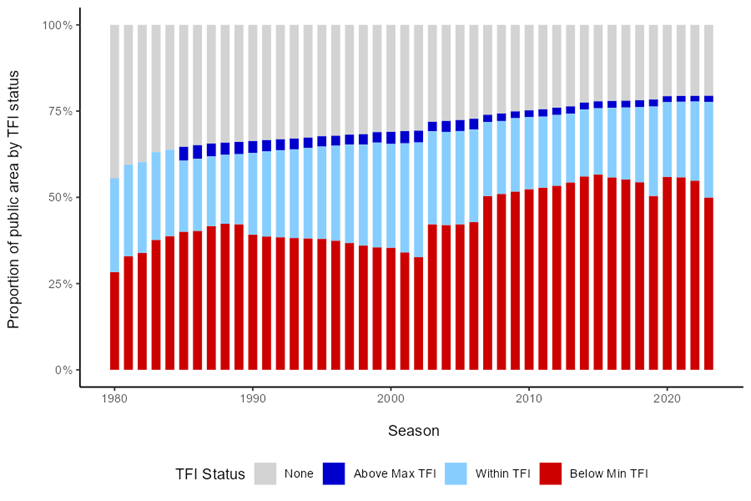
Figure 4: TFI status of vegetation on public land across Victoria since 1980

Figure 4 indicates the TFI status of vegetation on public land across Victoria since 1980. It indicates that in 2022–23, the proportion of vegetation:
- below minimum TFI was 50%, down from 55% in 2021–22, showing an improvement with 367,781 fewer hectares than the previous year in this category, because of the impacts of the 2019–20 bushfires
- within TFI increased to 28% (up from 23% in 2021–22)
- above maximum TFI remained at 2%, and with no fire history data to enable assessment remained at 20%.
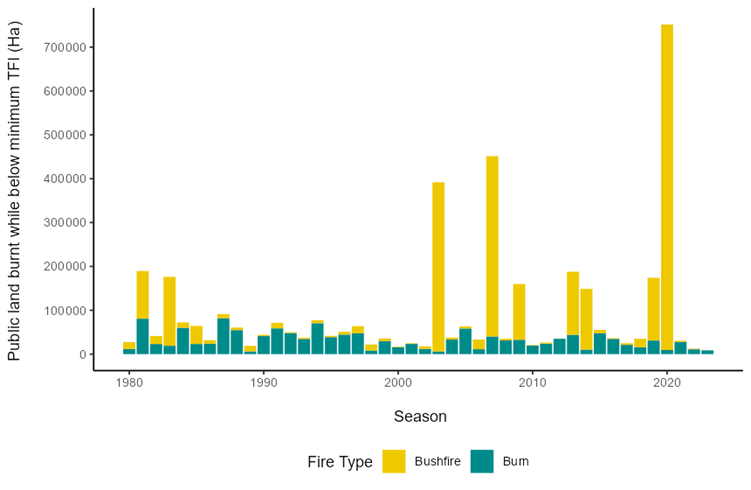
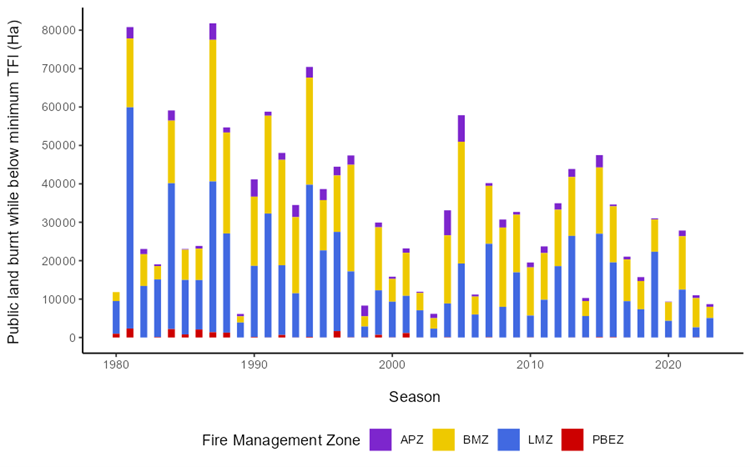
Figure 5: Area of public land burnt while below minimum TFI, Victoria, 1980-2023. Data aligns with financial year
Figure 5: Area of public land burnt while below minimum TFI, Victoria, 1980-2023. Data aligns with the financial year.
Burning areas below minimum tolerable fire interval is sometimes unavoidable, to reduce fuel-driven bushfire risk to human life, property or other important values. Figure 5 indicates the area of public land in Victoria burnt by bushfires and planned burning while below minimum TFI since 1980.
It indicates that in 2022–23:
- 8,971 hectares of vegetation on public land was burnt by planned burning or bushfire while below minimum TFI, which is a decrease of 3,478 hectares burnt under minimum TFI in 2021–22, and
- of this, 8,708 hectares were burnt through planned burns; this represents less than 0.15% of Victoria’s public land.
Figure 6: Area of public land burnt while below TFI by Fire Management Zones by planned burning
Figure 6 indicates the area of each fire management zone treated by planned burning while below minimum TFI, since 1980.
In 2022–23:
- 704 hectares in Asset Protection Zones
- 2,921 hectares in Bushfire Moderation Zones
- 5,057 hectares in Landscape Management Zones
- 5 hectares in Planned Burn Exclusion Zones
- 21 hectares in ‘Non-Fire Protected Area’ land and ‘Unknown Zones’ (note this is not depicted in the Figure).
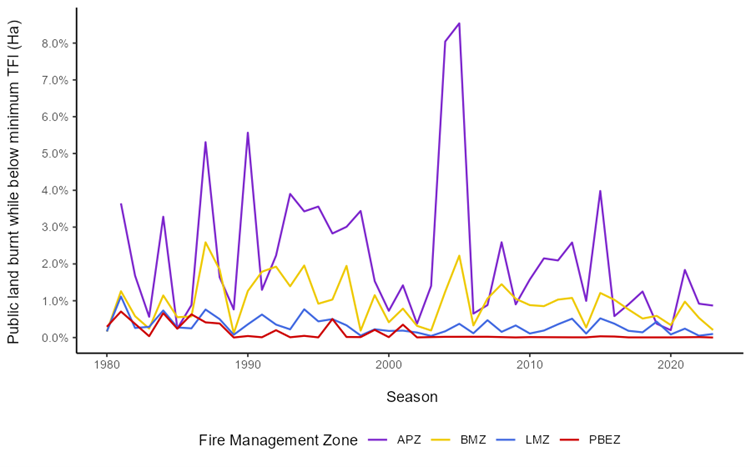
Figure 7: Proportion of fire management zone treated by planned burning while below minimum TFI, 1980-2023
Figure 7 indicates the proportion of the total hectares in each fire management zone treated by planned burning while below minimum TFI, since 1980. In 2022–23 there were:
- 0.9% of Asset Protection Zone
- 0.2% of Bushfire Moderation Zone
- 0.1% of Landscape Management Zone
- 0.0% of Planned Burn Exclusion Zone
Victorian Bushfire Monitoring Program
In 2022–23, the Monitoring, Evaluation and Reporting Framework for Bushfire Management on Public Land continued to be delivered through the Victorian Bushfire Monitoring Program (VBMP). This included monitoring fuel levels, ecosystem resilience measures, research projects and location-specific activities to support improvement.
The data from monitoring enables FFMVic to understand how effectively planned burning reduces bushfire fuels, and evaluate performance in reducing fuel-driven bushfire risk.
Fuel Hazard monitoring
Fuel hazard monitoring provides important information about:
- planned burns, including the severity and coverage of each burn
- how each planned burn has reduced fuel hazard
- the success of each planned burn in achieving ecological burn objectives where appropriate, and
- whether follow-up actions are required.
Burn objectives are set to achieve a balance between fuel reduction and preserving important values. For example, a burn objective may be to achieve 70% burn coverage within the footprint of a planned burn to ensure that sufficient refugia, habitat and food sources are left for flora and fauna.
When evaluating a planned burn, a series of plots are measured. In 2022–23 a total of 1,382 sites were monitored for fuel hazard pre- and post-burn, and an additional 200 permanent plots were monitored in Gippsland.
Funding for fuel management research totalled $1.5 million.
Table 18: Fuel hazard sites monitored, by region, Victoria, 2022–23
| Region | Number of pre-burn sites | Number of post-burn sites | Other | Total |
|---|---|---|---|---|
| Barwon South West | 54 | 55 | 0 | 109 |
| Gippsland | 46 | 8 | 2001 | 254 |
| Grampians | 138 | 54 | 0 | 192 |
| Hume | 417 | 59 | 0 | 476 |
| Loddon Mallee | 196 | 58 | 0 | 254 |
| Port Phillip | 252 | 45 | 0 | 297 |
| Statewide | 1,103 | 279 | 200 | 1,582 |
1 This includes 200 permanent monitoring sites located in Asset Protection Zones in Gippsland. These sites are monitored whether they are burnt or not. Of these sites, 54 were in the Black Summer fire area.
Ecosystem resilience monitoring
Additional monitoring and improvement activities
To understand the effects of both bushfires and planned burning on the environment, FFMVic measures and monitors the timing and number of fires in different types of vegetation. FFMVic’s fuel management program considers how best to meet the 2 primary objectives of minimising the impact of major bushfires; and maintaining or improving the resilience of natural ecosystems.
FFMVic also partners with universities and other academic institutions to conduct research that improves how ecosystem resilience is represented and measured. In 2022–23, FFMVic continued to deliver the statewide ecosystem resilience monitoring program in partnership with Natural Hazards Research Australia (previously the Bushfire Natural Hazards Cooperative Research Centre), La Trobe University, Deakin University and the University of Melbourne.
In the 2022–23 financial year, $9 million was spent on monitoring, evaluation and reporting.
Victoria now has data for 4 of the 11 identified highest-priority ecological fire groups, providing opportunities to replace expert datasets with empirically derived data in models and decision-making. Another 4 ecological fire groups are well underway, with the remaining 3 commenced.
This monitoring program provides scientific evidence and recommendations for fire management and planning, improving the ecological basis underpinning Victoria’s ecosystem resilience metrics and future monitoring and research.
Investment
FFMVic invested $141.1 million on fuel management in 2022–23, a 6.6% decrease from $151 million in 2021–22.
Table 19 provides a breakdown of this investment by region and type of investment. Direct investment totalled $24.1 million, and indirect investment $117 million.
Direct investment in 2022–23 was significantly less than that in 2021–22 ($37.3 million). The reduction in direct fuel management costs was largely due to a shorter planned burn season, conditions being too wet to burn, and reduced investment in the construction of strategic fuel breaks.
Appendix 1 summarises year-on-year costs.
Table 19: FFMVic fuel management investment, by region and group, Victoria, 2022–23.
| Region | Fuel management ($direct) | Fuel management ($indirect) | Total ($) |
|---|---|---|---|
| Barwon South West | 3.7m | 7.0m | 10.7m |
| Gippsland | 4.5m | 18.8m | 23.3m |
| Grampians | 3.8m | 8.2m | 12.1m |
| Hume | 4.0m | 16.0m | 20.0m |
| Loddon Mallee | 2.6m | 9.5m | 12.1m |
| Port Phillip | 2.7m | 7.3m | 10.0m |
| Statewide | 2.8m | 48.7m | 51.4m |
| Research* | 1.5m | ||
| Total fuel management investment | 24.1m | 117m | 141.1m |
*Current reporting methods do not allow for separation between types of grants allocated for research and are calculated and reported manually as a stand-alone figure.
Table 20 provides a further breakdown of indirect investment. A large proportion of the indirect fuel management costs are associated with resource management (41%) and equipment and infrastructure (16%).
Table 20: Indirect fuel management investment, by items, Victoria 2022–23.
| Item | Indirect investment (%) | Total ($) |
|---|---|---|
| Business management | 5 | 6.0m |
| Capability | 11 | 12.5m |
| Engagement | 8 | 9.2m |
| Equipment and infrastructure | 16 | 18.7m |
| Monitoring evaluation and reporting | 8 | 9.0m |
| Native vegetation framework | 0 | 3,926 |
| Operational planning | 5 | 5.6m |
| Resource management | 41 | 47.0m |
| Strategic planning | 7 | 7.5m |
| Research* | 1.5m | |
| Total indirect investment | 100 | 117m |
| Total fuel management investment | 141.1m |
*Current reporting methods do not allow for separation between types of grants allocated for research and calculated and reported manually as a stand-alone figure
Table 21: Cost of strategic fuel breaks by region.
| Cost of strategic fuel break construction ($m) | 2021-22 | 2022-23 |
|---|---|---|
| Barwon South West | 0.7m | 0.6m |
| Gippsland | 1.2m | 1.1m |
| Grampians | 0.1m | 0.2m |
| Hume | 2.5m | 1.2m |
| Loddon Mallee | 0.6m | 0.4m |
| Port Phillip | 1.5m | 1.0m |
| Forest and Fire Operations Division | 4.5m | 2.7m |
| Total | 11.1m | 7.2m |
Table 22: Comparison of FFMVic direct investment in fuel management treatments 2021–22 and 2022–23.
| Treatment cost ($m) | 2021-22 | 2022-23 |
|---|---|---|
| Mechanical treatment | 2.0m | 2.9m |
| Planned burning | 24.0m | 13.9m |
| Strategic fuel breaks | 11.3m | 7.2m |
| Total | 37.3m | 24.1m |
Updated