Summary of development by sub-Precinct
| Precinct | Number of developments | Construction value | Construction jobs | Commercial Floor Area (sqm) | Permanent jobs | % of jobs target | Dwellings | % of dwellings target | Estimated residents | Affordable housing | Social housing | Total social/affordable housing units | % of social/affordable housing of total dwellings | Build to rent | % of build to rent of total dwellings |
| Montague | 35 | $2,157,555,000 | 4,315 | 95,610 | 3,187 | 79.68 | 5,460 | 52.95 | 11,848 | 151 | 40 | 191 | 3.5 | 1,595 | 29.21 |
| Sandridge | 8 | $2,124,400,000 | 4,249 | 97,032 | 3,234 | 12.44 | 3,626 | 26.4 | 7,868 | 166 | 14 | 180 | 4.96 | 0 | 0 |
| Wirraway | 12 | $1,084,500,000 | 2,169 | 35,635 | 1,188 | 29.7 | 2,069 | 30.33 | 4,490 | 79 | 0 | 79 | 3.82 | 0 | 0 |
| Lorrimer | 7 | $2,087,000,000 | 4,174 | 83,586 | 2,786 | 46.44 | 4,726 | 80.35 | 10,255 | 183 | 50 | 233 | 4.93 | 707 | 14.96 |
| TOTAL | 62 | $7,453,455,000 | 14,907 | 311,863 | 10,395 | 25.99 | 15,881 | 43.21 | 34,462 | 579 | 104 | 683 | 4.3 | 2302 | 14.5 |
Summary of development by category
| Pipeline category | Number of developments | Construction value | Construction jobs | Commercial Floor Area (sqm) | Permanent jobs | % of jobs target | Dwellings | % of dwellings target | Estimated residents | Affordable housing | Social housing | Total social/affordable housing units | % of social/affordable housing of total dwellings | Build to rent | % of build to rent of total dwellings |
| Approved but not commenced | 22 | $4,297,243,000 | 8,594 | 235,466 | 7,849 | 19.62 | 9,102 | 24.77 | 19,751 | 327 | 39 | 366 | 4.02 | 145 | 1.59 |
| Under assessment | 5 | $1,285,662,000 | 2,571 | 37,594 | 1,253 | 3.13 | 2,098 | 5.71 | 4,553 | 139 | 59 | 198 | 9.44 | 358 | 17.06 |
| Under construction | 10 | $601,750,000 | 1,204 | 10,985 | 366 | 0.92 | 1,890 | 5.14 | 4,101 | 63 | 0 | 63 | 3.33 | 992 | 52.49 |
| Constructed | 25 | $1,268,800,000 | 2,538 | 27,818 | 927 | 2.32 | 2,791 | 7.59 | 6,056 | 50 | 6 | 56 | 2.01 | 807 | 28.91 |
| Total | 62 | $7,453,455,000 | 14,907 | 311,863 | 10,395 | 25.99 | 15,881 | 43.21 | 34,462 | 579 | 104 | 683 | 4.3 | 2302 | 14.5 |
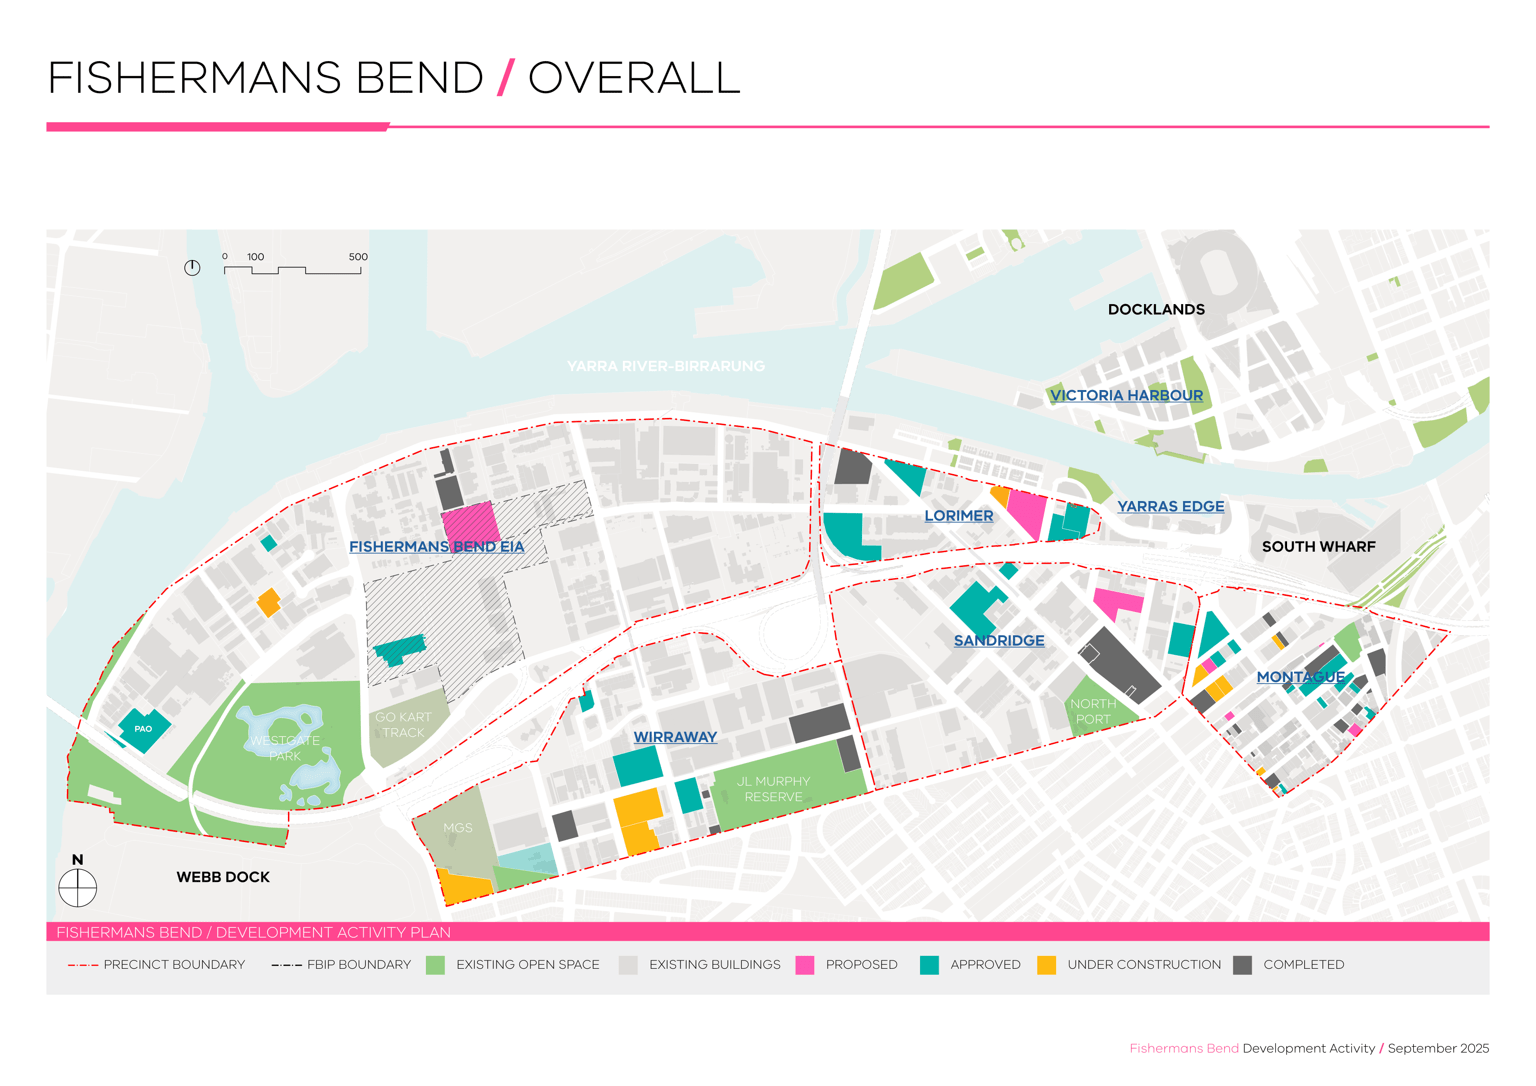
Development map
Please email fishermansbend@transport.vic.gov.au with any questions about the map, the data presented or a specific development.
Updated