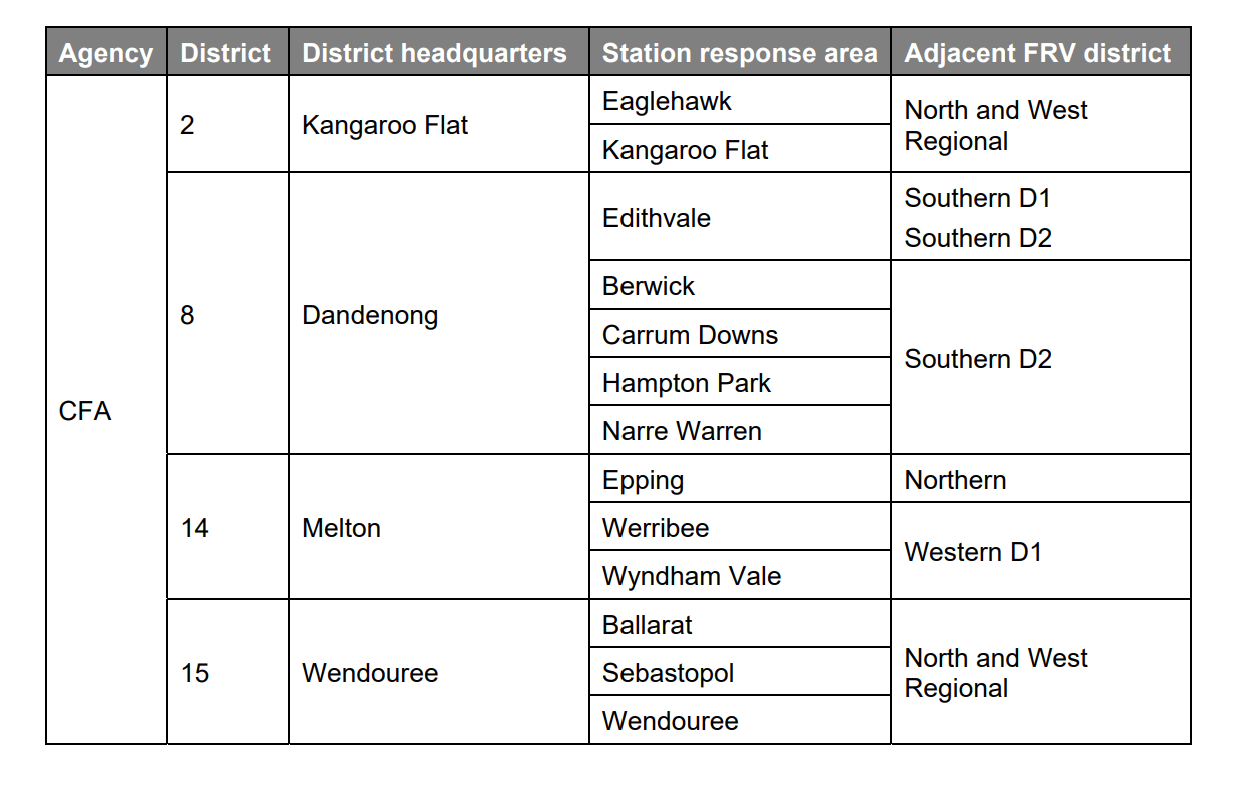
Table 2 Station response areas for CFA advice for the FRV Fire District Review 2020–24

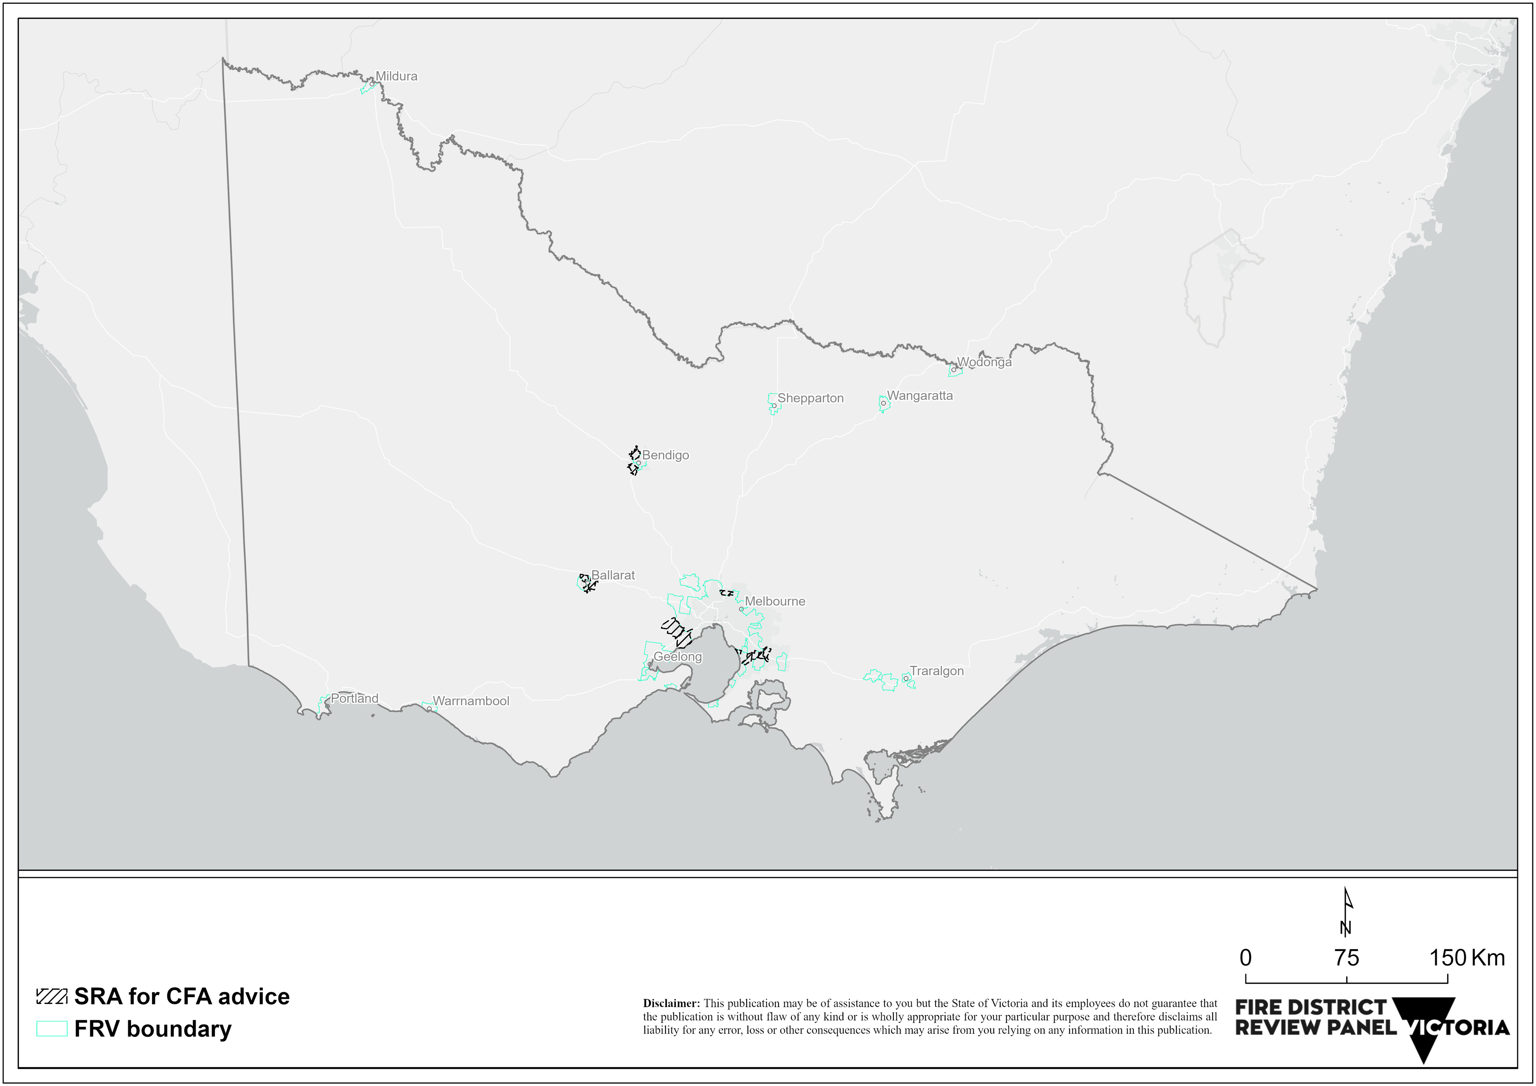
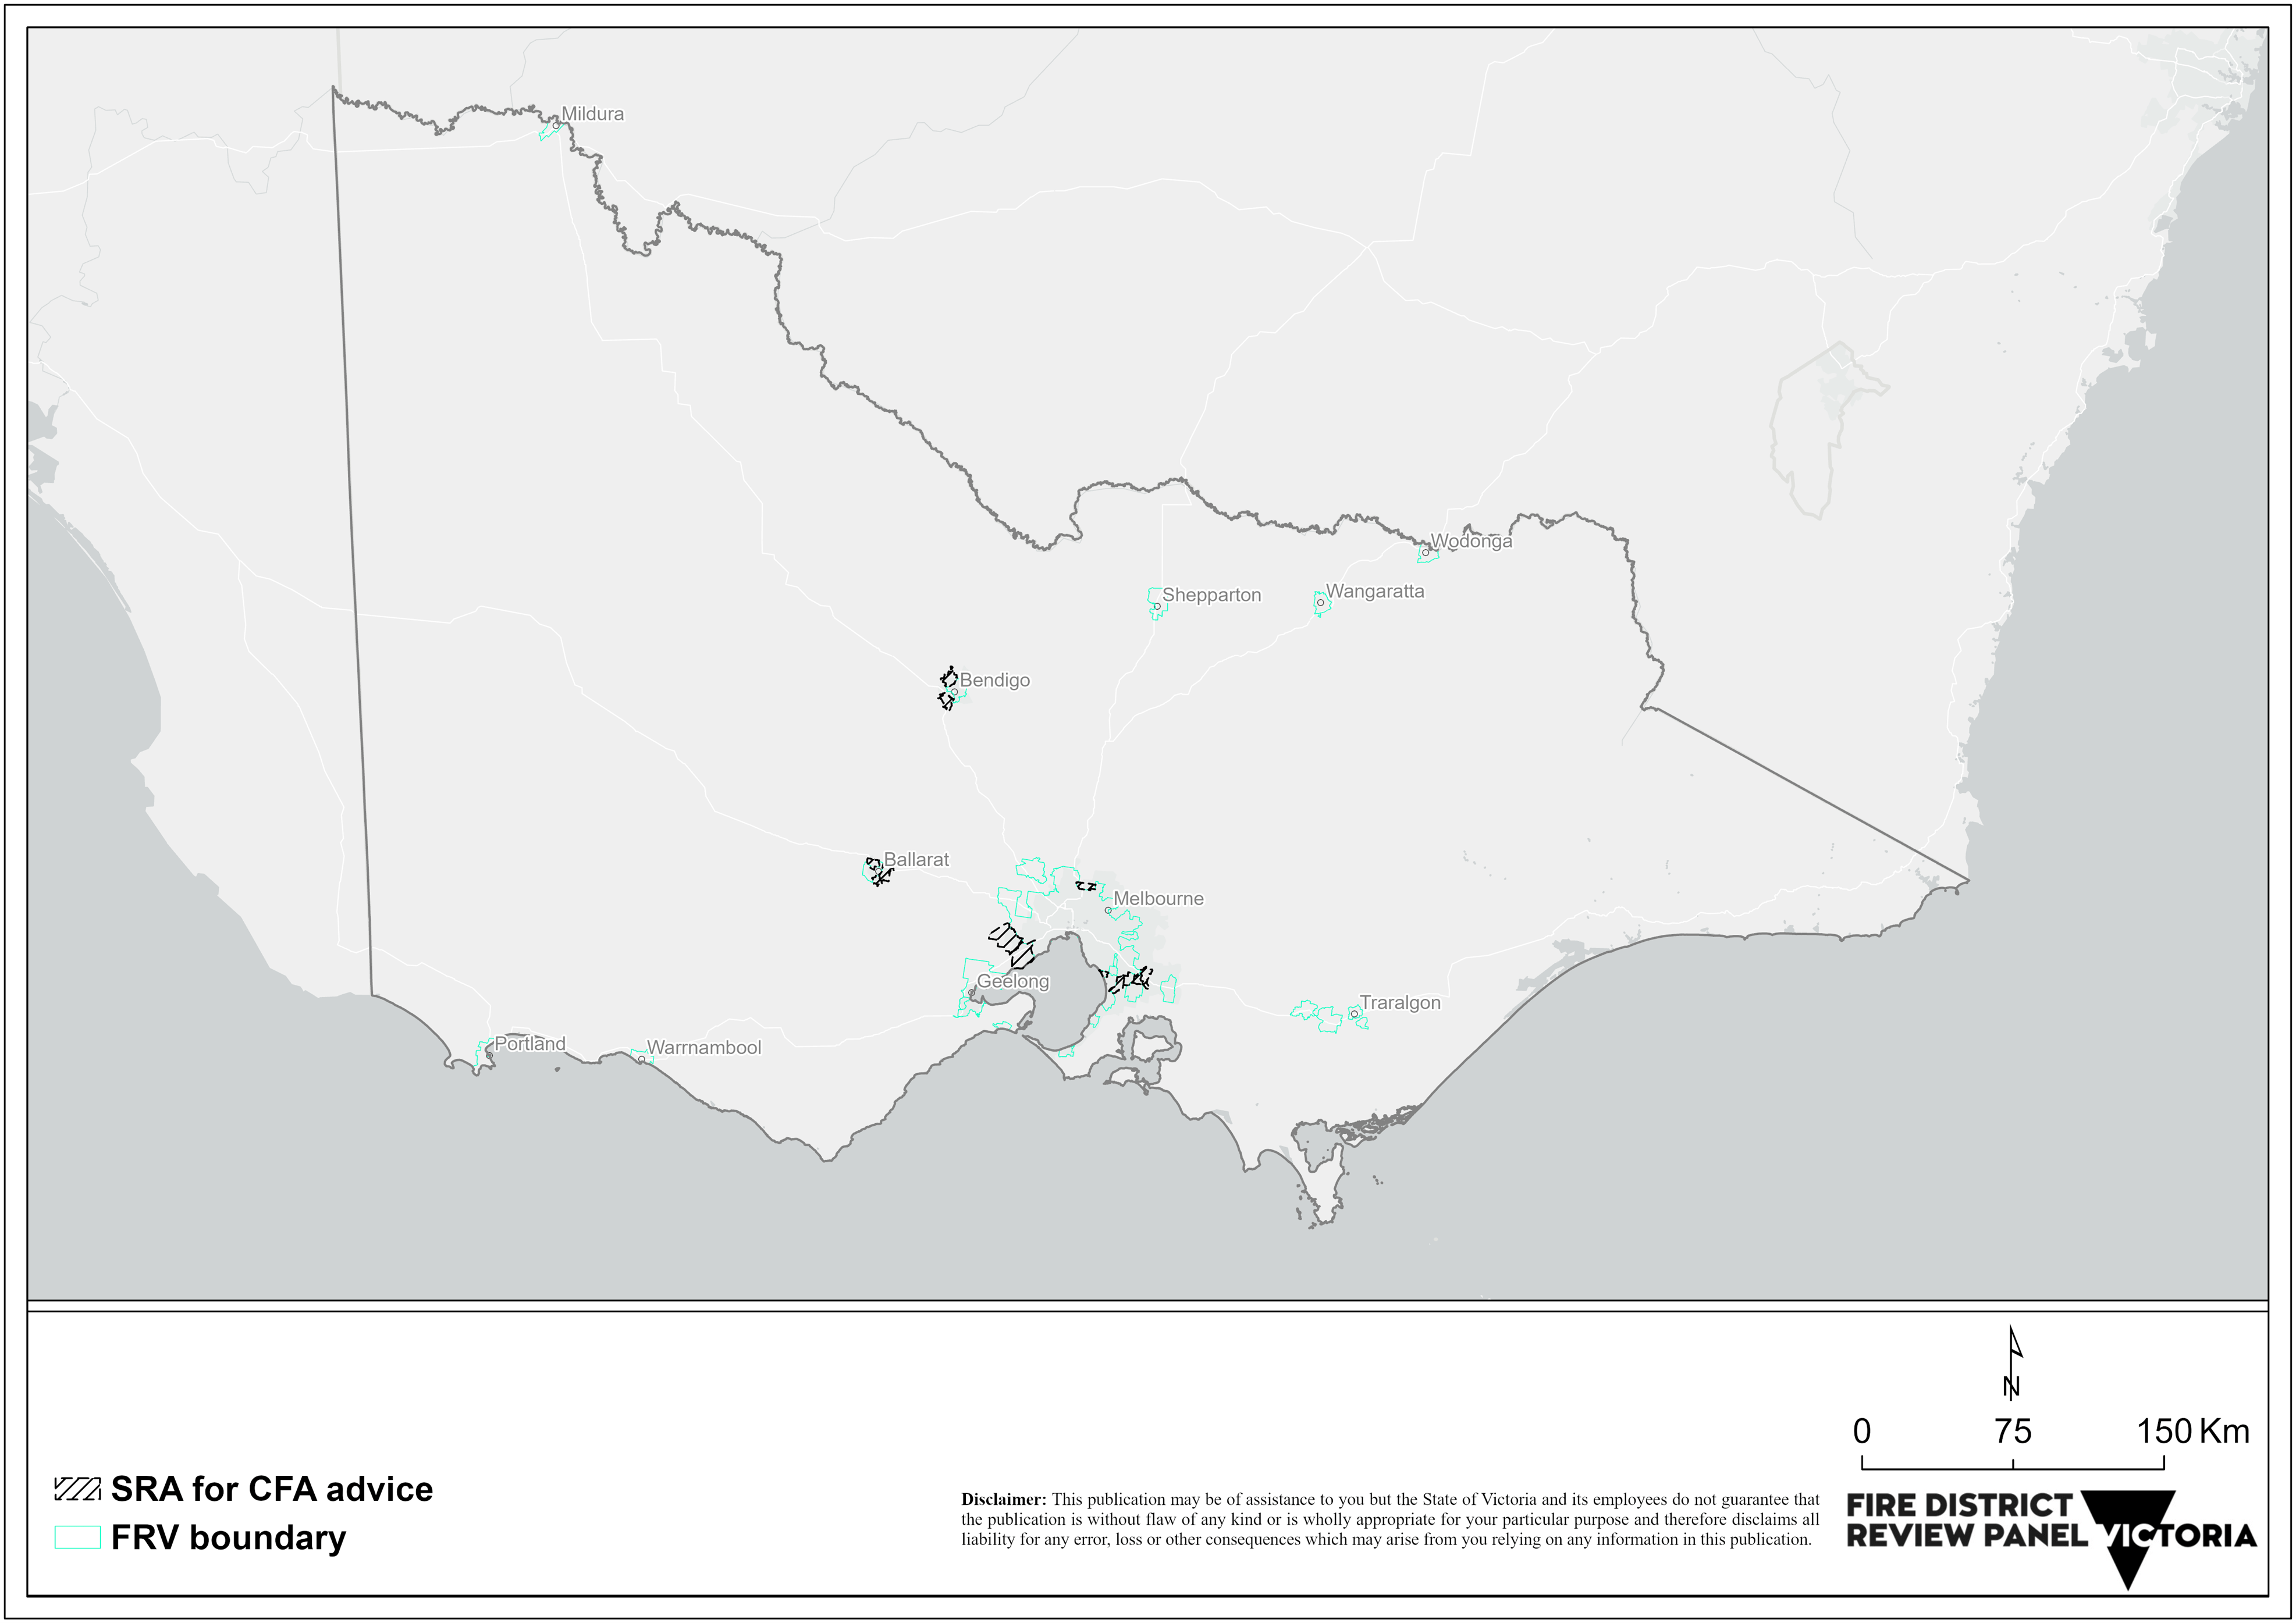
Figure 21 Station response area for CFA advice – statewide
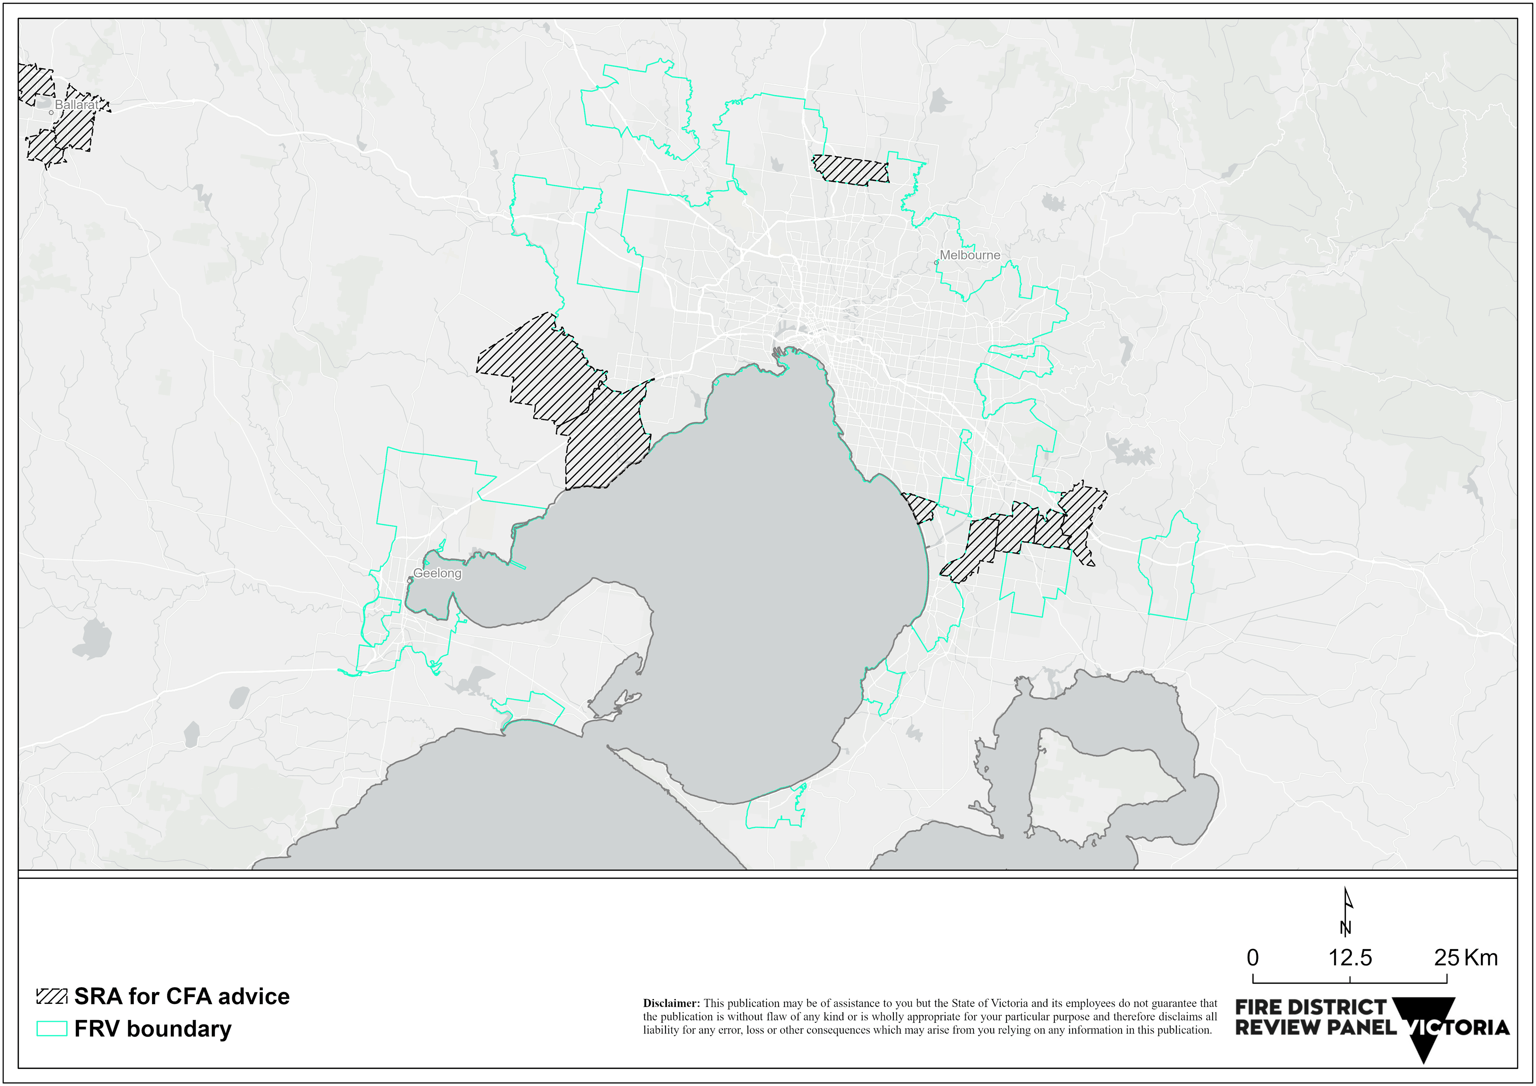
Figure 22 Station response area for CFA advice – metropolitan Melbourne
6.1 Station response areas for CFA advice
Each of the 13 SRAs is described below in terms of their dominant land use, presence of infrastructure, disadvantage, population increases, and the overlays and ratios that serve as potential drivers of fire risk.
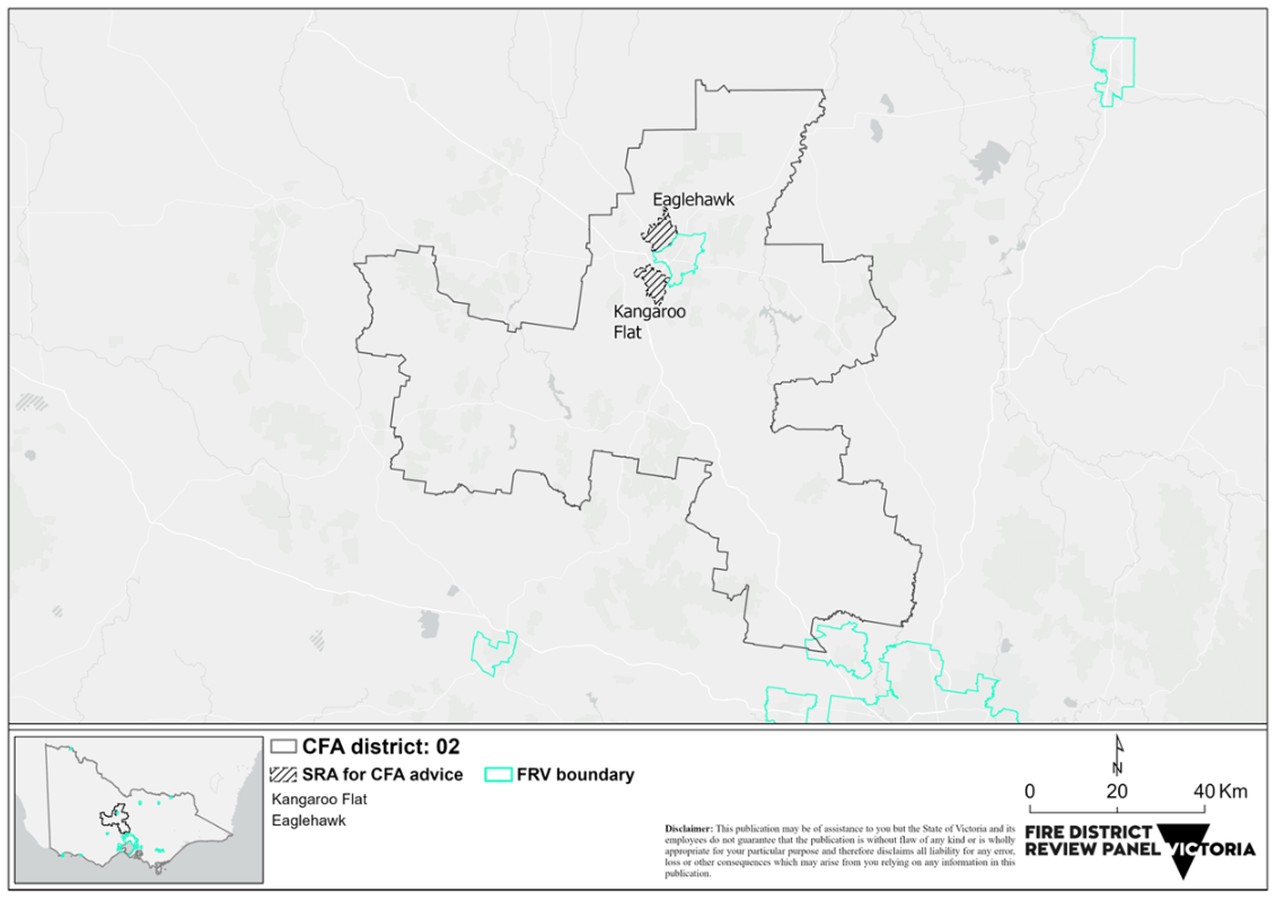
6.1.1 District 02
Eaglehawk and Kangaroo Flat SRAs are located in the north-west and south-west, respectively, of Bendigo CBD. Bendigo’s population increased from 86,079 in 2011 to 103,034 in 2021.17 Eaglehawk SRA contains four suburbs,18 of which three (the exception is Sailors Gully) have experienced a population increase since 2011 as follows:
- Eaglehawk – 4,810 in 2011 to 5,538 in 202119
- Sailors Gully – 761 in 2011 to 743 in 202120
- California Gully – 4,263 in 2011 to 4,476 in 202221
- Jackass Flat – 301 in 2011 to 1,907 in 2021.22
The suburb of Kangaroo Flat experienced a population increase from 9,492 in 2011 to 11,328 in 2021.23
Kangaroo Flat SRA is traversed by the Calder Highway and Bendigo railway line, while the Loddon Valley Highway and railway line cut through Eaglehawk SRA. Both SRAs support predominantly residential land use, with areas of commercial industrial land uses throughout.
Kangaroo Flat and Eaglehawk SRAs, respectively, contain 15 and 17 SA1s which rate as the most disadvantaged.24 Kangaroo Flat has the second-highest BCTB ratio of the 90 FRV and CFA SRAs.
In terms of planning, 100 per cent of both SRAs falls into declared regional growth areas, and both record over 80 per cent of their SRA falling into a BMO.
Each SRA contains significant areas of native woody vegetation that form parts of regional parks.
Figure 23 Station response area for CFA advice – District 2

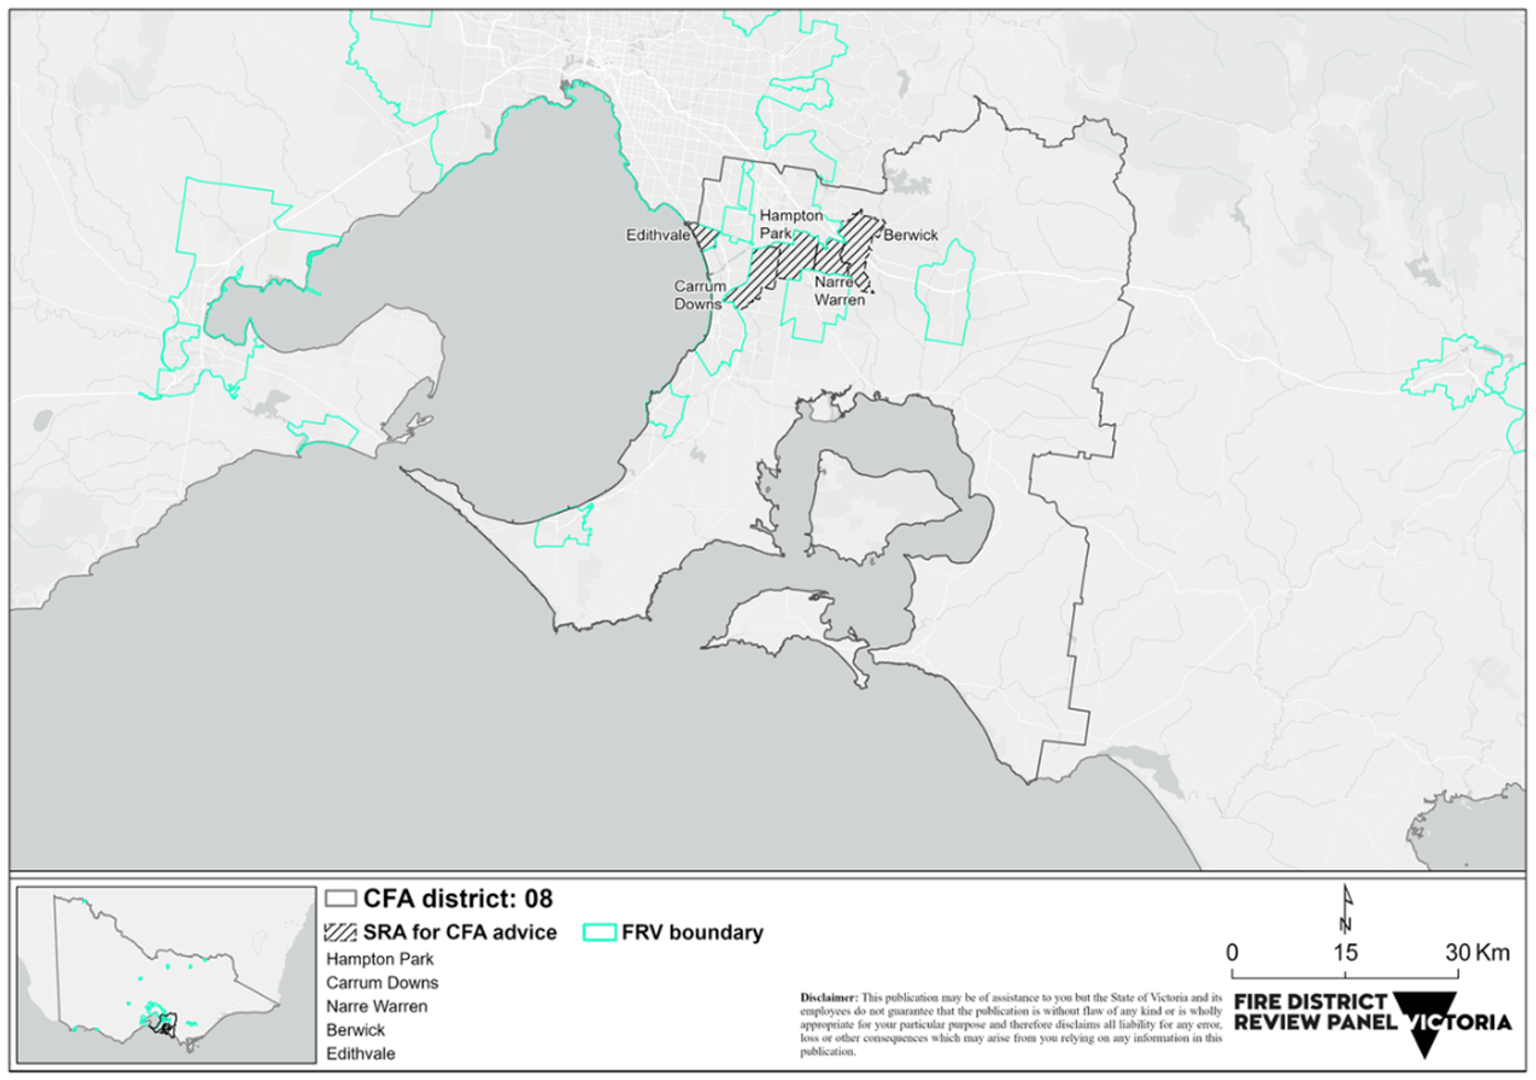
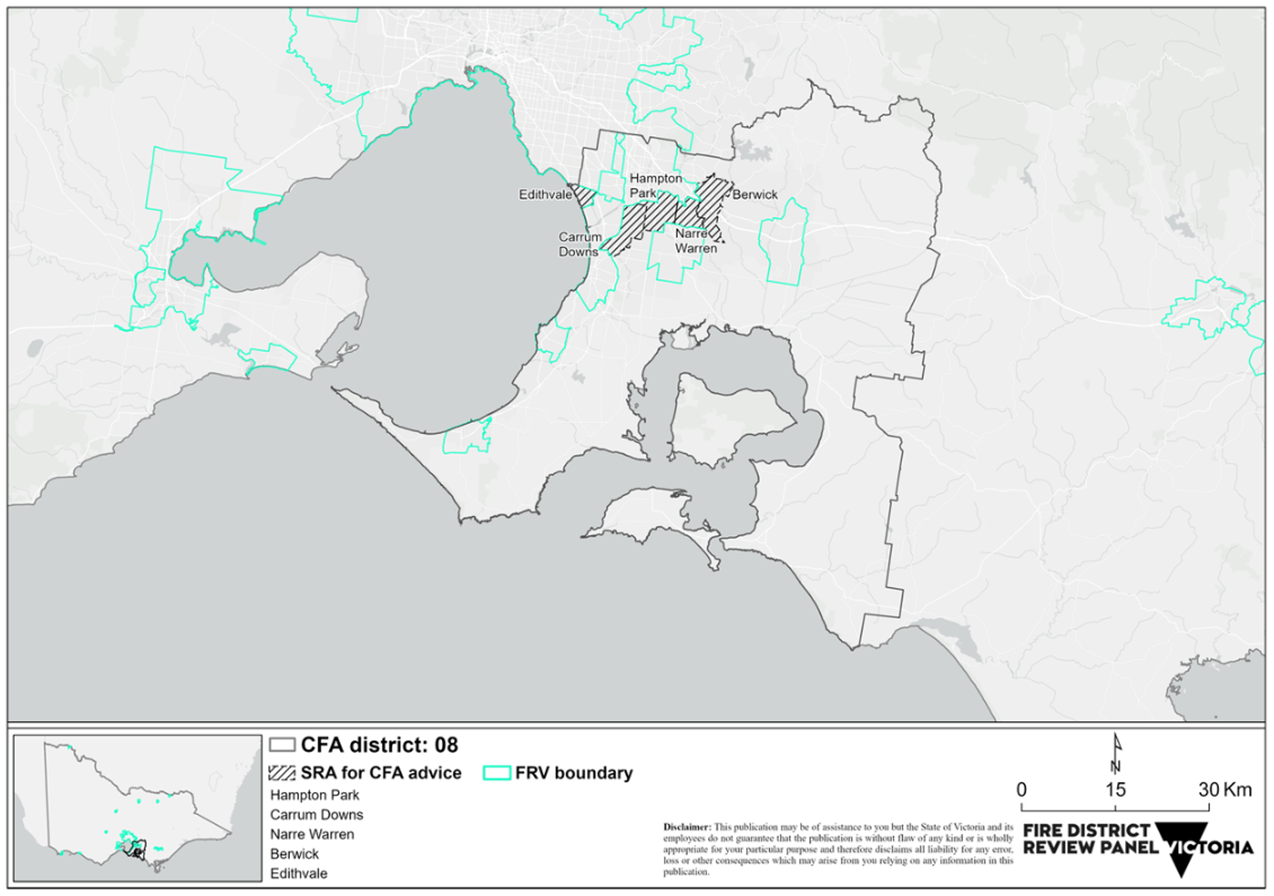
6.1.2 District 08
Carrum Downs SRA contains a mix of residential, industrial, commercial, and agricultural land uses, and contains 14 SA1s rated as the most disadvantaged.
It has the fifth-highest BCTB ratio of the 90 FRV and CFA SRAs. Most notably, it is traversed by several arterials: Frankston-Dandenong Road, Thompson Road, Peninsula Link, and Eastlink.
The population of the suburb of Carrum Downs increased from 19,122 in 2011 to 21,976 in 2021.25
Hampton Park SRA is adjacent to Carrum Downs and Narre Warren SRAs. It encompasses three suburbs: Hampton Park, Lynbrook, and Lyndhurst. These suburbs have experienced population growth as follows:
- Hampton Park – 23,767 in 2011 to 26,082 in 202126
- Lynbrook – 6,772 in 2011 to 9,121 in 202127
- Lyndhurst – 4,896 in 2011 to 8,926 in 2021.28
Hampton Park SRA recorded the third-highest projected 2036 population (>51,000) of CFA SRAs in the 90.
It contains a mix of predominantly residential and industrial land uses, including a recycling plant and landfill.
The SRA is dissected by two major arterials: the South Gippsland Highway and Westernport Highway. It contains 39 SA1s which rate as the most disadvantaged.
Narre Warren SRA contains a large area of Narre Warren South and parts of Narre Warren. It recorded the fifth-highest projected 2036 population (>39,000) across CFA SRAs in the 90.
The population of these suburbs increased as follows:
- Narre Warren – 25,882 in 2011 to 27,689 in 202129
- Narre Warren South – 28,594 in 2011 to 30,909 in 2021.30
The suburb of Narre Warren South has been one of the fastest growing new suburbs in Melbourne over the last twenty years. It has also been one of the major areas of new residential development in the south-east growth corridor.31
Seven SA1s within the Narre Warren SRA rate as the most disadvantaged.
Berwick SRA recorded the second-highest projected 2036 population (>60,000) across CFA SRAs in the 90. Much of its area is residential, with 15 per cent of the SRA falling within greenfield and urban renewal declared growth area. This growth is evident in the south and south-west of the SRA.
There are large areas of parkland and rural lifestyle properties in the north of the SRA. Only five SA1s within the Berwick SRA rate as the most disadvantaged.
The population of the suburb of Berwick increased from 44,779 in 2011 to 50,298 in 2021.32
Considerable industry and infrastructure dominate the centre of the SRA, including the Princes Freeway, Clyde Road, the Pakenham railway line, Federation University, Chisholm Institute, Casey Hospital and St John of God Berwick Hospital. Commercial land use dominates the intersection of the old Princes Highway and Lyall Road.
Edithvale SRA is the smallest of those identified for CFA advice. The SRA encompasses three suburbs – Aspendale, Aspendale Garden, and Edithvale. It contains predominantly residential land use with pockets of commercial areas located either side of the Nepean Highway.
It also includes the Edithvale–Seaford Wetlands in the south of the SRA.
The populations of Edithvale and Aspendale have increased, while that of Aspendale Gardens decreased, as follows:
Figure 24 Station response area for CFA advice – District 8
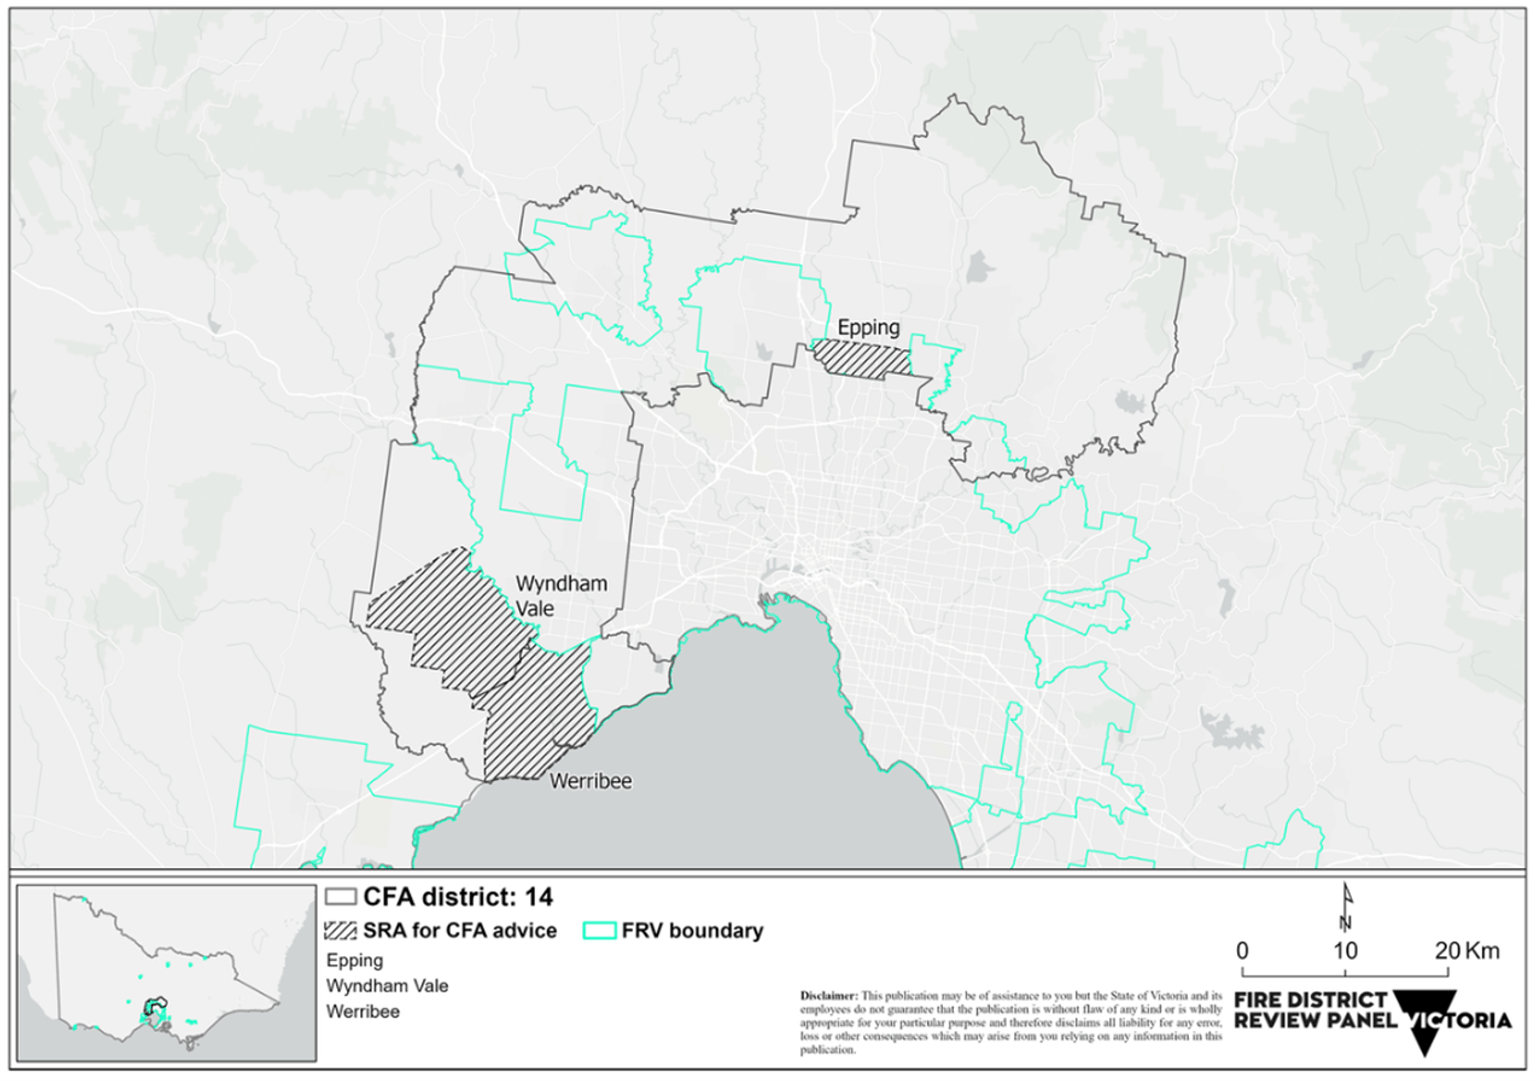
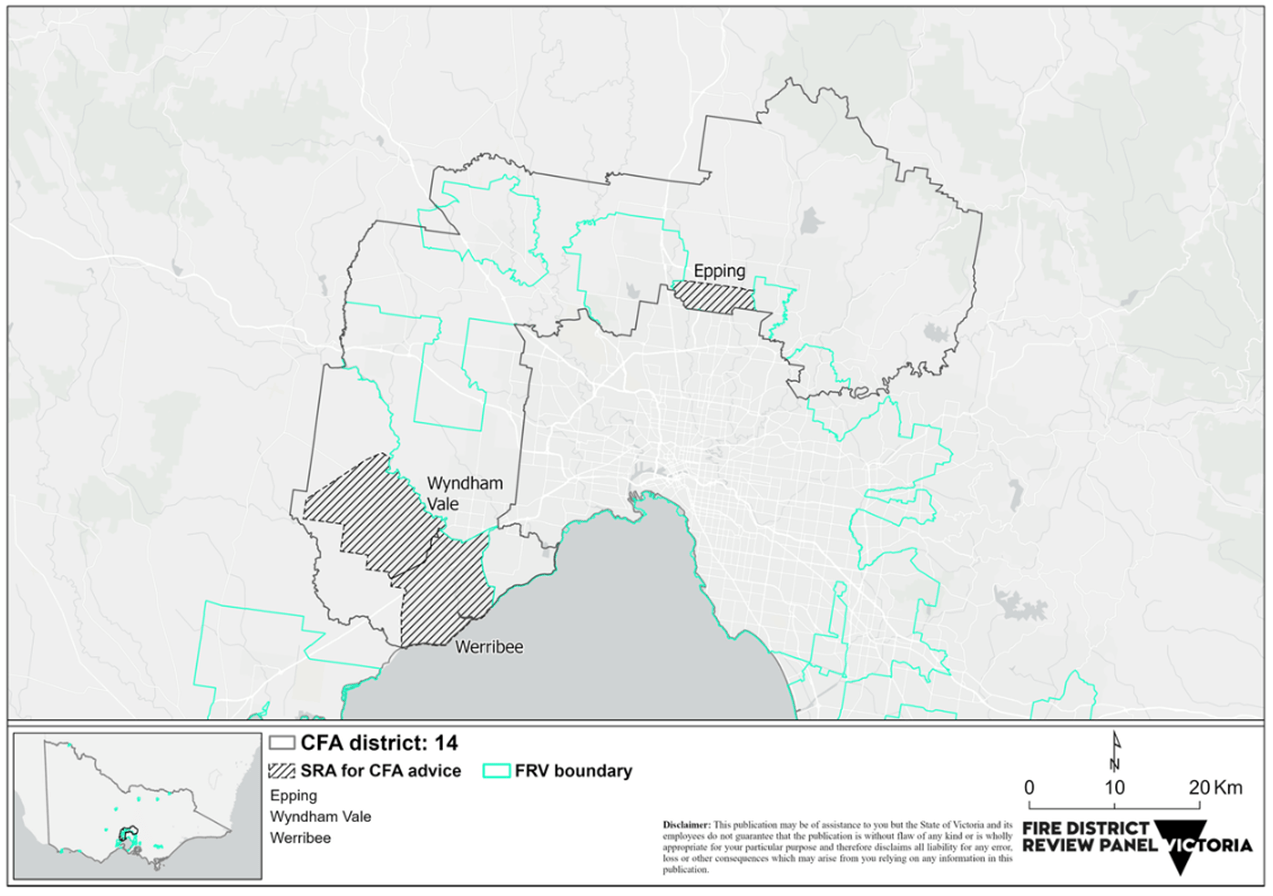
6.1.3 District 14
Nearly half of the Wyndham Vale SRA falls within greenfield declared growth area.
The SRA recorded the highest projected 2036 population of 63,17736 across CFA SRAs. The population of the suburb of Wyndham Vale increased from 17,304 in 2011 to 20,518 in 2021.37
The SRA contains 18 SA1s which rate as the most disadvantaged and has the third-highest BCTB ratio of the 90 FRV and CFA SRAs.
Adjoining Wyndham Vale SRA is Werribee SRA, of which 15 per cent falls within greenfield declared growth area.
Werribee serves as a commuter town in the Melbourne–Geelong growth corridor. It contains three university campuses (Victoria, Notre Dame, and Melbourne) and the Werribee Mercy hospital.
Considerable urban development has occurred in Werribee in recent years, with several high-rise buildings in the city centre.
The population of the suburb of Werribee increased from 37,737 in 2011 to 50,027 in 2021.38
Werribee SRA contains 32 SA1s which rate as the most disadvantaged. It is dissected by the Princess Freeway and has the fifth-highest VCTV ratio of the 90 FRV and CFA SRAs.
Epping SRA contains 13 SA1s which rate as the most disadvantaged. It had the highest BCTB ratio of the 90 FRV and CFA SRAs.
Much of its area is residential, and it recorded the fourth-highest projected 2036 population (>41,000) across CFA SRAs in the 90. The population of the suburb of Epping increased from 26,346 in 2011 to 33,489 in 2021.39
Epping SRA also has large areas of industrial land use and land currently under development. The Hume Freeway, the main arterial linking Melbourne and Sydney, dissects the SRA.
Figure 25 Station response area for CFA advice – District 14
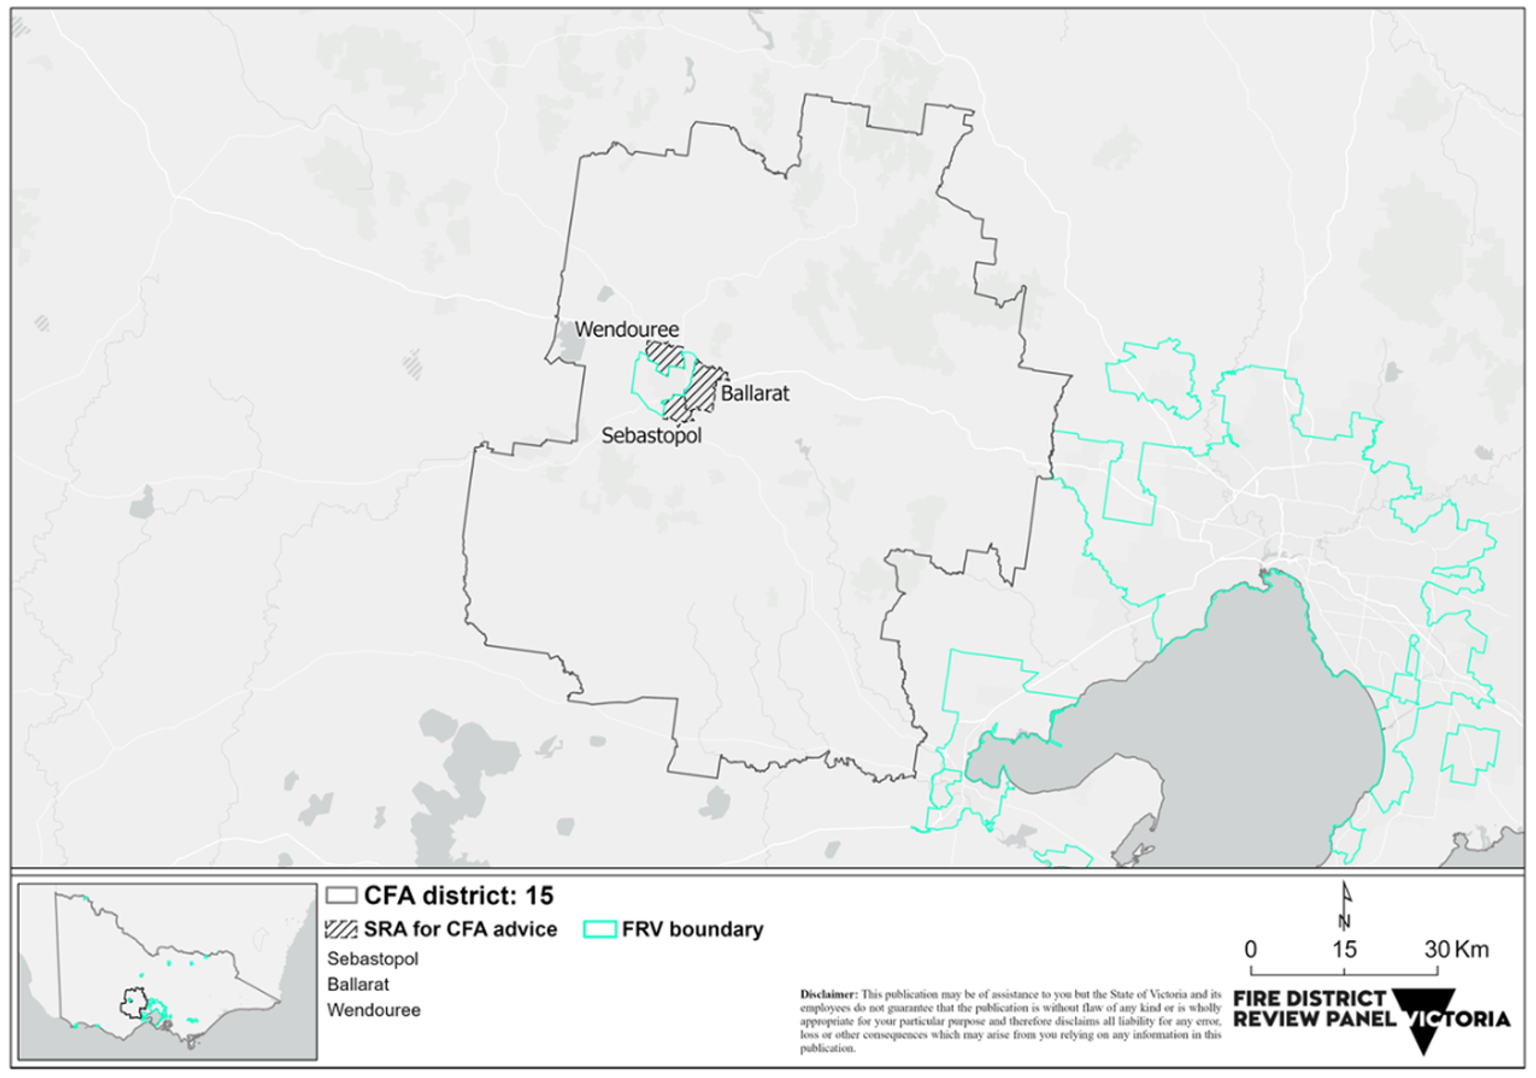
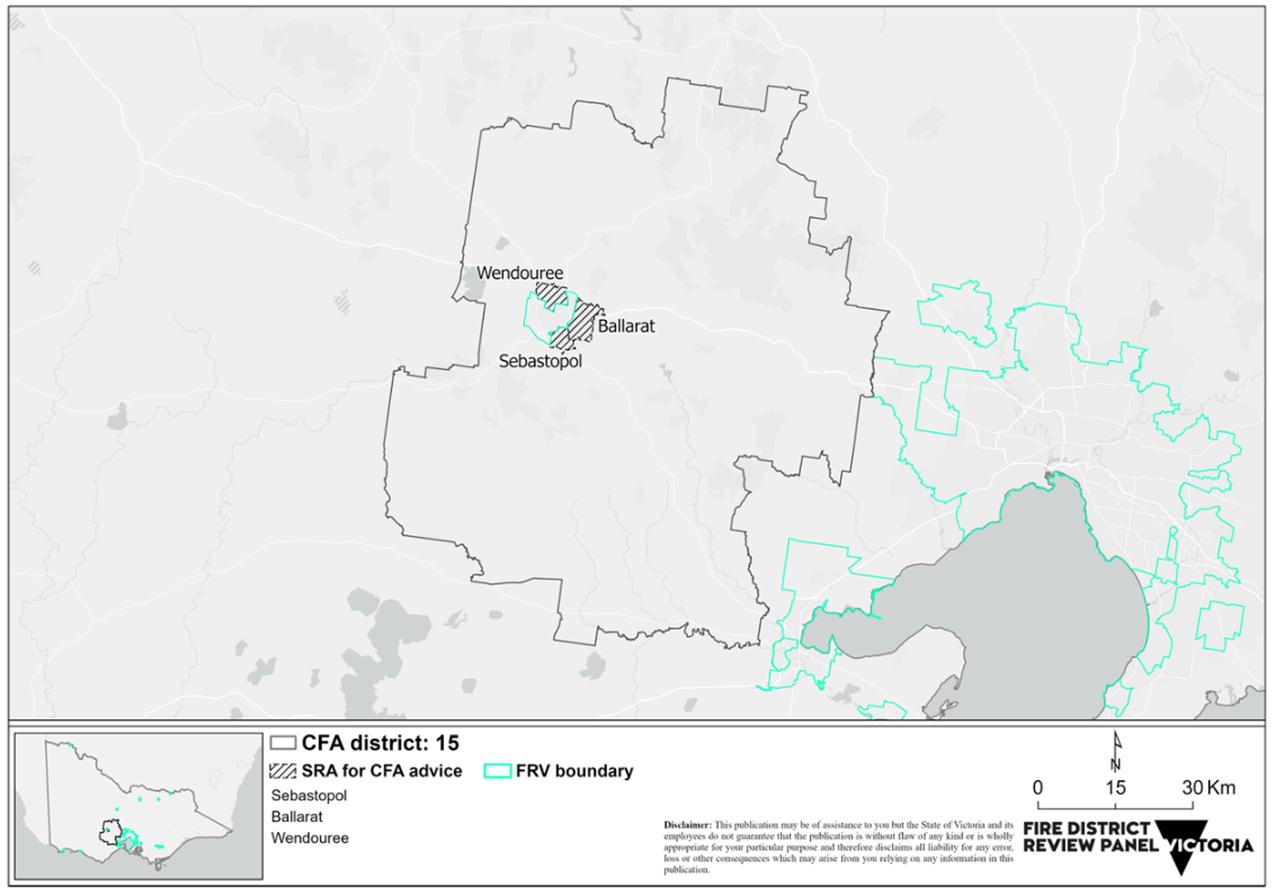
6.1.4 District 15
The population of Ballarat increased from 91,908 in 2011 to 111,973 in 2021.40 Ballarat SRA contains four suburbs, all experiencing population increases since 2011 as follows:
- Ballarat East – 5,309 in 2011 to 5,937 in 202141
- Nerrina – 849 in 2011 to 970 in 202142
- Eureka – 629 in 2011 to 633 in 202143
- Canadian – 3,203 in 2011 to 4,098 in 2021.44
Ballarat SRA is east of Ballarat City and nearly 50 per cent of its area is overlaid by a BMO. The SRA contains the Woowookarung Regional Park in the south-east, a private plantation in the south-west and state forest in the north. It is traversed by the Geelong–Ballarat railway line and the Western Freeway. The SRA is dominated by residential land use; however, Bakery Hill contains a large commercial precinct.
Sebastopol SRA is south of Ballarat City and 36 per cent of its area falls into a declared regional growth area. The population of the suburb of Sebastopol has increased from 9,399 in 2011 to 10,194 in 2021.45 The SRA is traversed by the Midland Highway and is dominated by residential land use but also supports many rural lifestyle properties.
Ballarat and Sebastopol SRAs, respectively, contain 18 and 19 SA1s which rate as the most disadvantaged.
Wendouree SRA is north-west of Ballarat City and traversed by the Western Freeway in the north. It contains large areas of residential and industrial land use, as well as areas to the north and north-west of mixed farming and grazing and rural lifestyle properties. The SRA services 26 SA1s which rate as the most disadvantaged.
Approximately 10 per cent of the Wendouree SRA falls into a declared regional growth area; however, the population of the suburb of Wendouree decreased from 10,596 in 2011 to 10,376 in 2021.46
Figure 26 Station response area for CFA advice – District 15
Footnotes
[17] https://abs.gov.au/census/find-census-data/quickstats/2021/2004 https://abs.gov.au/census/find-census-data/quickstats/2011/2004
[18] There are additional suburbs and localities (SAL) that are part of the Eaglehawk SRA but their population is too low to be recorded in the Census
[19] https://www.abs.gov.au/census/find-census-data/quickstats/2021/SAL20823 https://www.abs.gov.au/census/find-census-data/quickstats/2011/SSC20429
[20] https://www.abs.gov.au/census/find-census-data/quickstats/2021/SAL22224 https://www.abs.gov.au/census/find-census-data/quickstats/2011/SSC21178
[21] https://www.abs.gov.au/census/find-census-data/quickstats/2021/SAL20444 https://www.abs.gov.au/census/find-census-data/quickstats/2011/SSC20233
[22] https://www.abs.gov.au/census/find-census-data/quickstats/2021/SAL21250 https://www.abs.gov.au/census/find-census-data/quickstats/2011/SSC20667
[23] https://www.abs.gov.au/census/find-census-data/quickstats/2021/SAL21293 https://www.abs.gov.au/census/find-census-data/quickstats/2011/SSC20683
[24] The Index of Relative Socio-economic Disadvantage (IRSD) is a general socioeconomic index that summarises a range of information about the economic and social conditions of people and households within an area. This index includes only measures of relative disadvantage.
[25] https://abs.gov.au/census/find-census-data/quickstats/2021/SAL20508 https://abs.gov.au/census/find-census-data/quickstats/2011/SSC20266
[26] https://www.abs.gov.au/census/find-census-data/quickstats/2021/SAL21133 https://www.abs.gov.au/census/find-census-data/quickstats/2011/SSC20591
[27] https://www.abs.gov.au/census/find-census-data/quickstats/2021/SAL21554 https://www.abs.gov.au/census/find-census-data/quickstats/2011/SSC20814
[28] https://www.abs.gov.au/census/find-census-data/quickstats/2021/SAL21555 https://www.abs.gov.au/census/find-census-data/quickstats/2011/SSC20815
[29] https://www.abs.gov.au/census/find-census-data/quickstats/2021/SAL21893 https://www.abs.gov.au/census/find-census-data/quickstats/2011/SSC20985
[30] https://www.abs.gov.au/census/find-census-data/quickstats/2021/SAL21896 https://www.abs.gov.au/census/find-census-data/quickstats/2011/SSC20988
[31] https://reiv.com.au/market-insights/suburb/narre%20warren
[32] https://www.abs.gov.au/census/find-census-data/quickstats/2021/SAL20224 https://www.abs.gov.au/census/find-census-data/quickstats/2011/SSC20125
[33] https://www.abs.gov.au/census/find-census-data/quickstats/2021/SAL20848 https://www.abs.gov.au/census/find-census-data/quickstats/2011/SSC20446
[34] https://www.abs.gov.au/census/find-census-data/quickstats/2021/SAL20079 https://www.abs.gov.au/census/find-census-data/quickstats/2011/SSC20037
[35] https://www.abs.gov.au/census/find-census-data/quickstats/2021/SAL20080 https://www.abs.gov.au/census/find-census-data/quickstats/2011/SSC20038
[36] This was calculated using the summarise within command (in ArcGIS Pro) following intersection of the 2036 projection data with the CFA SRA spatial layer.
[37] https://abs.gov.au/census/find-census-data/quickstats/2021/SAL22883 https://abs.gov.au/census/find-census-data/quickstats/2011/SSC21513
[38] https://abs.gov.au/census/find-census-data/quickstats/2021/SAL22750 https://abs.gov.au/census/find-census-data/quickstats/2011/SSC21452
[39] https://abs.gov.au/census/find-census-data/quickstats/2021/SAL20878 https://abs.gov.au/census/find-census-data/quickstats/2011/SSC20466
[40] https://abs.gov.au/census/find-census-data/quickstats/2021/2003 https://abs.gov.au/census/find-census-data/quickstats/2011/2003
[41] https://www.abs.gov.au/census/find-census-data/quickstats/2021/SAL20112 https://www.abs.gov.au/census/find-census-data/quickstats/2011/SSC20058
[42] https://www.abs.gov.au/census/find-census-data/quickstats/2021/SAL21917 https://www.abs.gov.au/census/find-census-data/quickstats/2011/SSC20999
[43] https://www.abs.gov.au/census/find-census-data/quickstats/2021/SAL20891 https://www.abs.gov.au/census/find-census-data/quickstats/2011/SSC20475
[44] https://www.abs.gov.au/census/find-census-data/quickstats/2021/SAL20461 https://www.abs.gov.au/census/find-census-data/quickstats/2011/SSC20242
[45] https://www.abs.gov.au/census/find-census-data/quickstats/2021/SAL22255 https://www.abs.gov.au/census/find-census-data/quickstats/2011/SSC21198
[46] https://www.abs.gov.au/census/find-census-data/quickstats/2021/SAL22745 https://www.abs.gov.au/census/find-census-data/quickstats/2011/SSC21451
Updated