Initial decision support analysis criteria, threshold, and influence
Table A1 shows the thresholds (minimum and maximum) and influence of the input criteria.
Table A1 Initial decision support analysis criteria, threshold, and influence
| Criteria | Minimum threshold | Maximum threshold | Influence | Unit |
|---|---|---|---|---|
| Fire rate | 36 | 475 | Positive | Rate |
| Fire hot spot | 0 | 3 | Ideal (0) | Significance level |
| Fire KDE | 3 | 5 | Positive | KDE value |
| Fire risk estimation | 0.51 | 1 | Positive | Probability |
| Casualty | 0 | 13 | Ideal (0) | Count |
| SDS failures | 1 | 144 | Positive | Count |
| MVA KDE | 3 | 5 | Positive | KDE value |
Thresholds are determined by inspecting the outputs outlined in Sections 2.4 and 2.5. The median values for fire rate, fire KDE, Markov Chain Estimation (MCE) and MVA KDE are input as the minimum threshold, and the maximum value for each of these outputs is input as the maximum threshold. More simply, the data between the fiftieth percentile and one hundredth percentile for these outputs is used for subsequent input to the initial DSA as it represents the areas of the state with elevated fire risk. Conversely, the minimum threshold for fire hot spot and casualty is taken from their minimum value, and their maximum value is the maximum threshold.
For SDS failures, the minimum threshold is one and maximum threshold is maximum value.
The differences in the minimum thresholds for casualties and SDS failure address the potential consequences of a single casualty (that is, death or significant injury) and SDS failure (that is, the SDS threshold considers time taken to flashover).
Likewise, for hot spots, an ideal situation would see statistically insignificant hot spots of fire (that is, zero value) across Victoria.
Therefore, a minimum threshold is taken from the minimum value considering the influence of this criterion. These minimum and maximum values (outputs from Sections 2.4 and 2.5) are presented in Table A1, and each criterion is defined as having a positive or ideal influence on the initial DSA score.
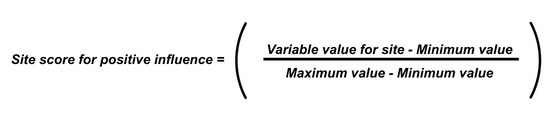
Positive influence means that the higher the value of the variable, the greater its effect on the score. This is calculated as the variable value for a site minus the minimum value for that variable, divided by the range of values (Equation 1).
Equation 1
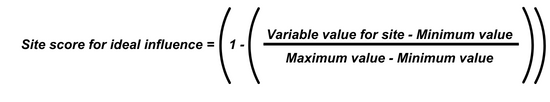
Ideal influence defines an ideal value for the variable. The closer the value of the variable to the specified ideal, the greater its effect on the score. This is calculated as the ideal value for a variable minus the variable value for a site, divided by the difference between either the ideal and the minimum, or the ideal and the maximum (whichever value is greater) (Equation 2).
Equation 2
Updated