To understand the distribution of fire risk and how it affects the Victorian population, as well as its serviceability by the fire agencies, initial DSA-derived fire risk scores for SA1s are summed within the SRAs.
Victoria has 1,199 SRAs7 (excluding marine response). The initial DSA identified 90 SRAs with a risk score that required further analysis. The final DSA further examined these 90 SRAs and their associated risk in relation to incident type and associated casualties, population projections, planning information, and bushfire risk management to identify the final SRAs for CFA advice. This process is further described in Section 5.
4.1 Casualties by incident type
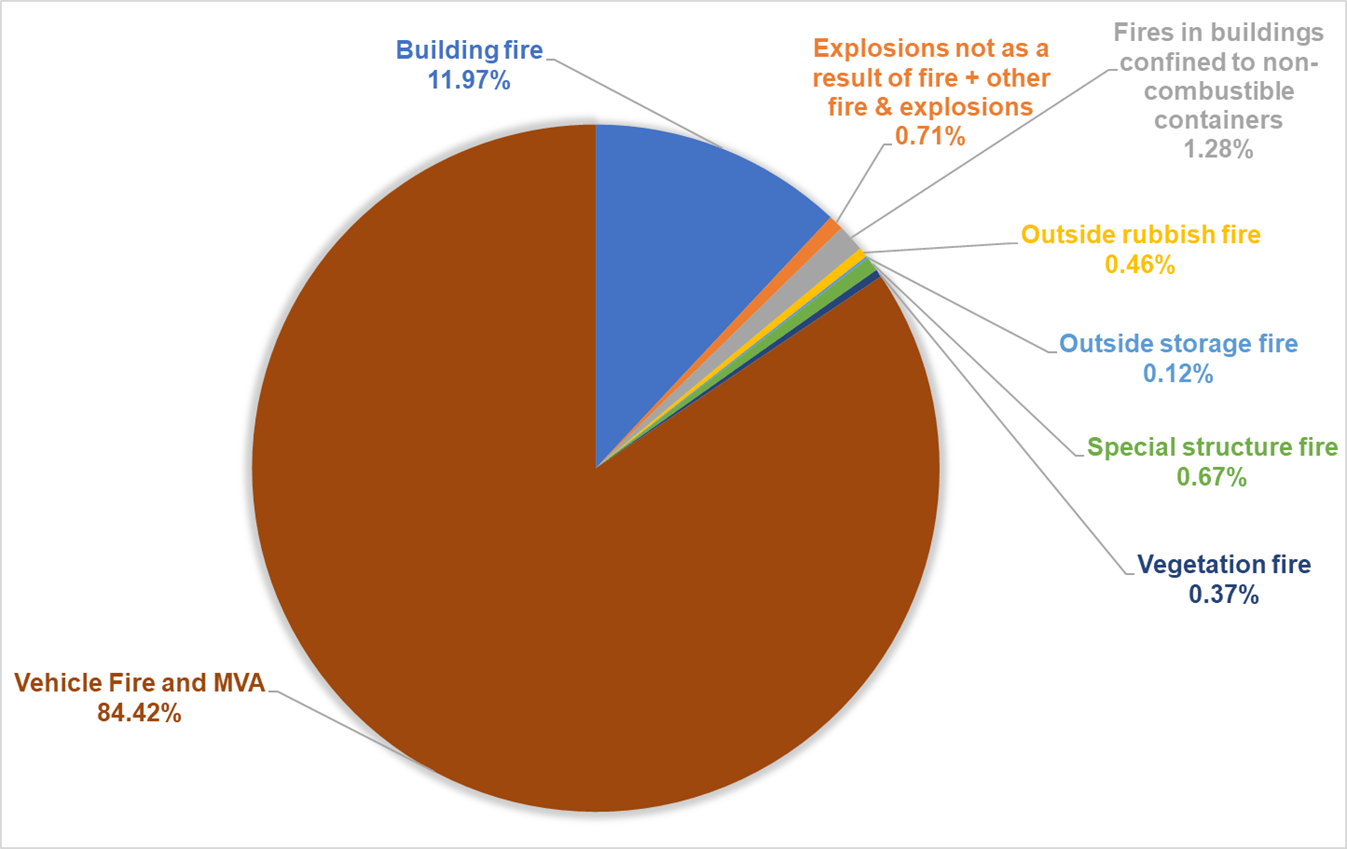
The type of incident and associated casualties are factors that influence this risk. This is particularly relevant for those incidents that are more likely to result in casualties – in this study, building fires, vehicle fires and MVAs (Figure 20).
Figure 20 shows that vehicle fires and MVAs are the main causes of casualties (84.42 per cent), followed by building fires (11.97 per cent). The Pearson correlation coefficient8 indicates that there is a positive relationship between both incident types and casualties for the 90 SRAs. The relationship is stronger for vehicle fires/MVAs:
- Building fires and associated casualties – 0.63 per cent
- Vehicle fires/MVAs and associated casualties – 0.77 per cent.
Figure 20 Percentage casualty by incident type

4.2 Casualty–incident ratios
Based on the analysis in Section 4.1, ratios were calculated for all 90 SRAs of:
- Building fire casualties to total building fires (BCTB)
- Vehicle fire/MVAs casualties to total vehicle fire/MVAs (VCTV).
4.3 Bushfire Management Overlay
BMO9 is a planning control that applies to bushfire-prone areas with very high and extreme bushfire hazards. BMOs trigger planning permit requirements including mandatory bushfire protection measures such as defendable space, water supply, access, and ongoing vegetation management. The area of the SRA that falls within a BMO is calculated as a percentage for each of the 90 SRAs.10
4.4 Population projections
Victoria in Future11 (2019) is the official Victorian Government projection of population and households. Projections are based on trends and assumptions for births, life expectancy, migration, and living arrangements across Victoria. Population growth is one of the major factors contributing to future demand for fire services. Population projection data of 2036 at the Statistical Area Level 2 (SA2)12 is apportioned according to the SRAs that fall within the SA2 boundary for the 90 SRAs.13
4.5 Land use planning
The demand for fire services across the state will be impacted by where population growth and land use changes are occurring.
The declared growth areas of Melbourne have been divided into over 110 precincts, each of which will have a precinct structure plan (PSP) completed to help guide the development of new residential and commercial areas (greenfield).
To investigate where these changes will occur, spatial data14 was sourced from the VPA. This data described:
- The boundaries for regional precincts that are completed or actively being worked on by the VPA
- The boundaries for urban renewal precincts that are completed, or actively being worked on by the VPA.
The area of the SRA overlaid by each VPA project category (greenfield, regional and urban renewal) is calculated as a percentage.15
Footnotes
[7] Represented by the spatial data layer Country Fire Authority (CFA) Brigade Response Polygon. https://datashare.maps.vic.gov.au/search?q=uuid%3Dc2f769a4-ea3f-5f51-82af-473185625c63 and the spatial layer Fire Rescue Victoria (FRV) Maintenance Areas polygon.
[8] A correlation coefficient is a number between −1 and 1 that shows the strength and direction of a relationship between variables. In other words, it reflects how similar the measurements of two or more variables are across a dataset.
[9] https://www.planning.vic.gov.au/policy-and-strategy/bushfire/building-in-the-bmo
[10] https://pro.arcgis.com/en/pro-app/latest/tool-reference/analysis/summarize-within.htm
[11] https://www.planning.vic.gov.au/land-use-and-population-research/victoria-in-future
[12] Statistical Areas Level 2 (SA2s) are geographical areas that are created by combining the smaller SA1s. Their purpose is to capture communities that have social and economic connections with one another. The populations of SA2s range from 3,000 to 25,000 persons. SA2s have an average population of about 10,000 persons and include towns with larger populations.
[13] https://pro.arcgis.com/en/pro-app/latest/tool-reference/analysis/summarize-within.htm
[14] https://vpa.vic.gov.au/wp-content/uploads/2022/02/VPA-Greenfields-PSP-Spatial-Data-Metadata_v5.pdf
https://data-planvic.opendata.arcgis.com/datasets/6fa6b6898e8a41fbbc8a189895e67b1c_0/about
[15] https://pro.arcgis.com/en/pro-app/latest/tool-reference/analysis/summarize-within.htm
Updated