Family Safety Victoria has committed to undertaking an annual survey of framework organisations to understand:
- the progress of implementation across different sectors
- how sectors can be more effectively supported to implement MARAM and enable continuous improvement.
This reporting period is the second year the survey has been undertaken. It is a voluntary survey targeted to those who have a substantial role in supporting MARAM alignment. For this reason, some workforces may have a limited number of responses as a result of the stage or process applied for implementation.
This chapter summarises the results of the survey. It will be referred to at other points in the report where it relates to specific matters, such as training in Chapter 8.
Demographics
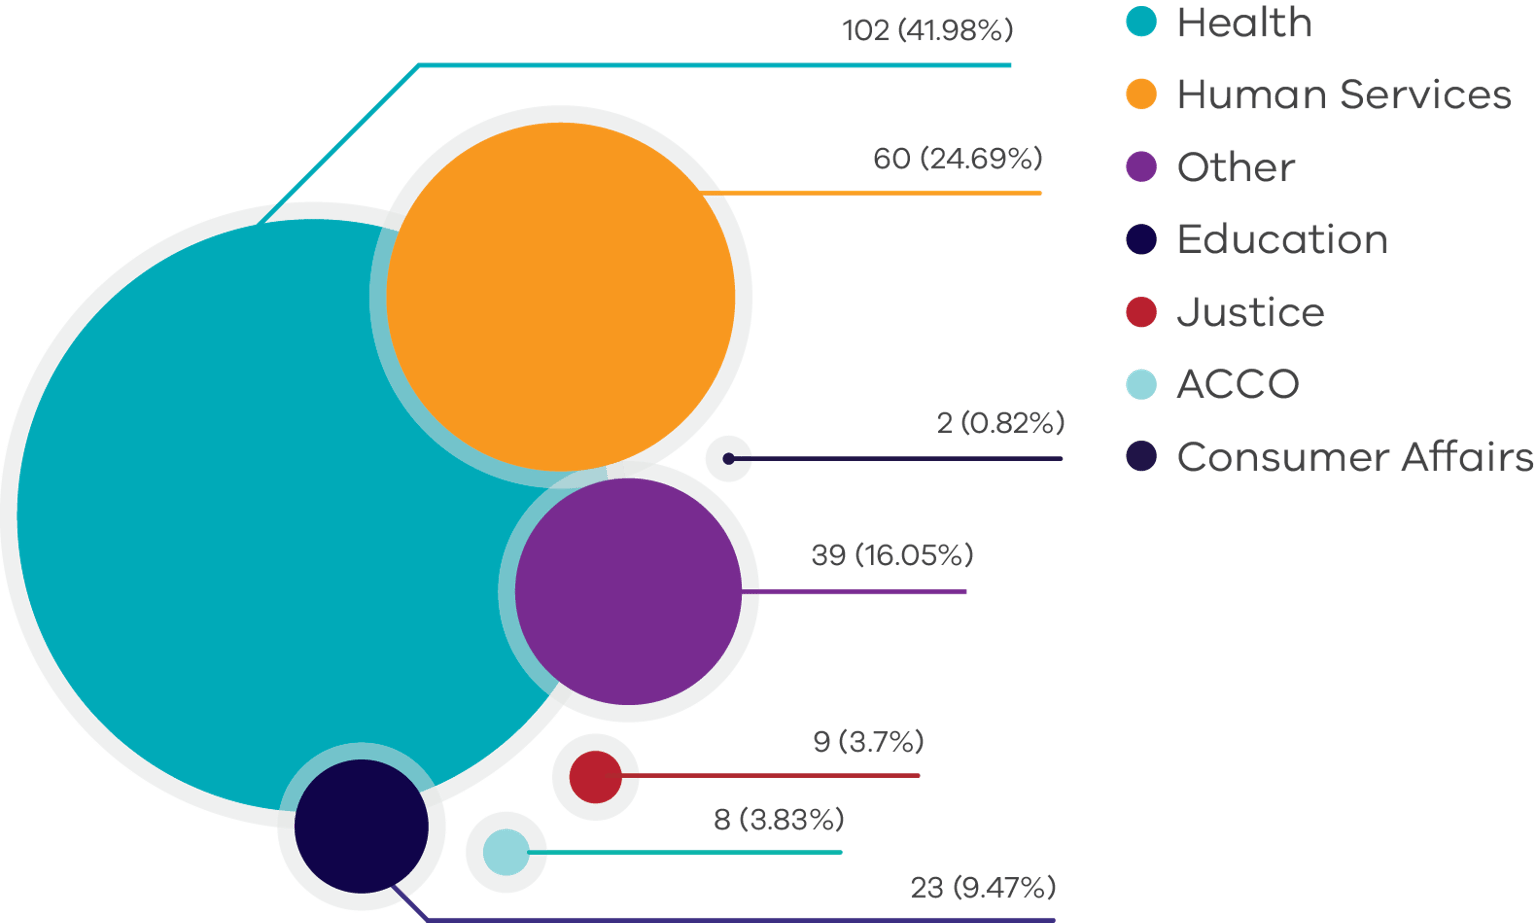
The annual survey captured a total of 243 responses. Most responses (162) were from those employed in large organisations across the health and human services sectors. ‘Other’, with 39 responses, was the third-largest group. This group also mostly represents workers in the broader health and human services sectors. However, these respondents preferred to free text, and one explanation for some could be that they belong to not-for-profit and nongovernment organisations, which did not feel represented in the options provided by the survey.
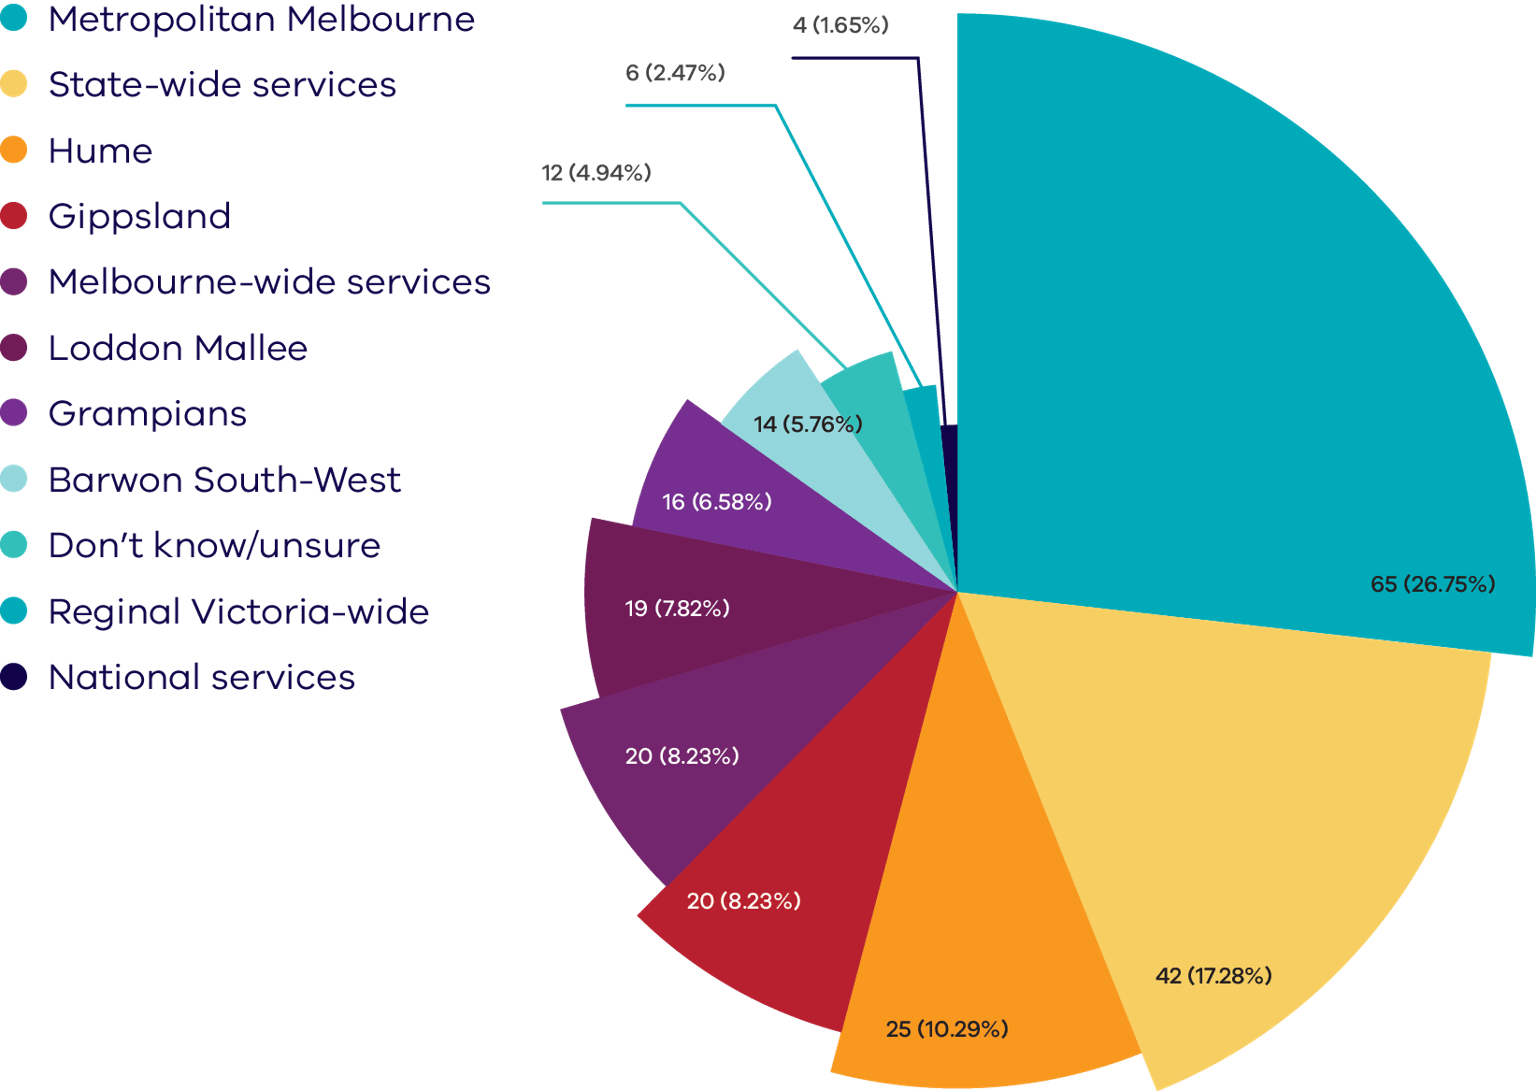
There was a good spread of responses across metropolitan, regional and statewide services. A further breakdown of data suggests there was a very good representation in the results of public hospitals, community health services, Specialist Family Violence Services, alcohol and other drug services, maternal and child health services, child and family services, and aged care. There was a broad range of responses from other human services, along with some schools, courts and justice areas.
Figure 4: MARAM Annual Survey – Workforce representation
Figure 5: MARAM Annual Survey – Geographical representation of workforce
MARAM alignment
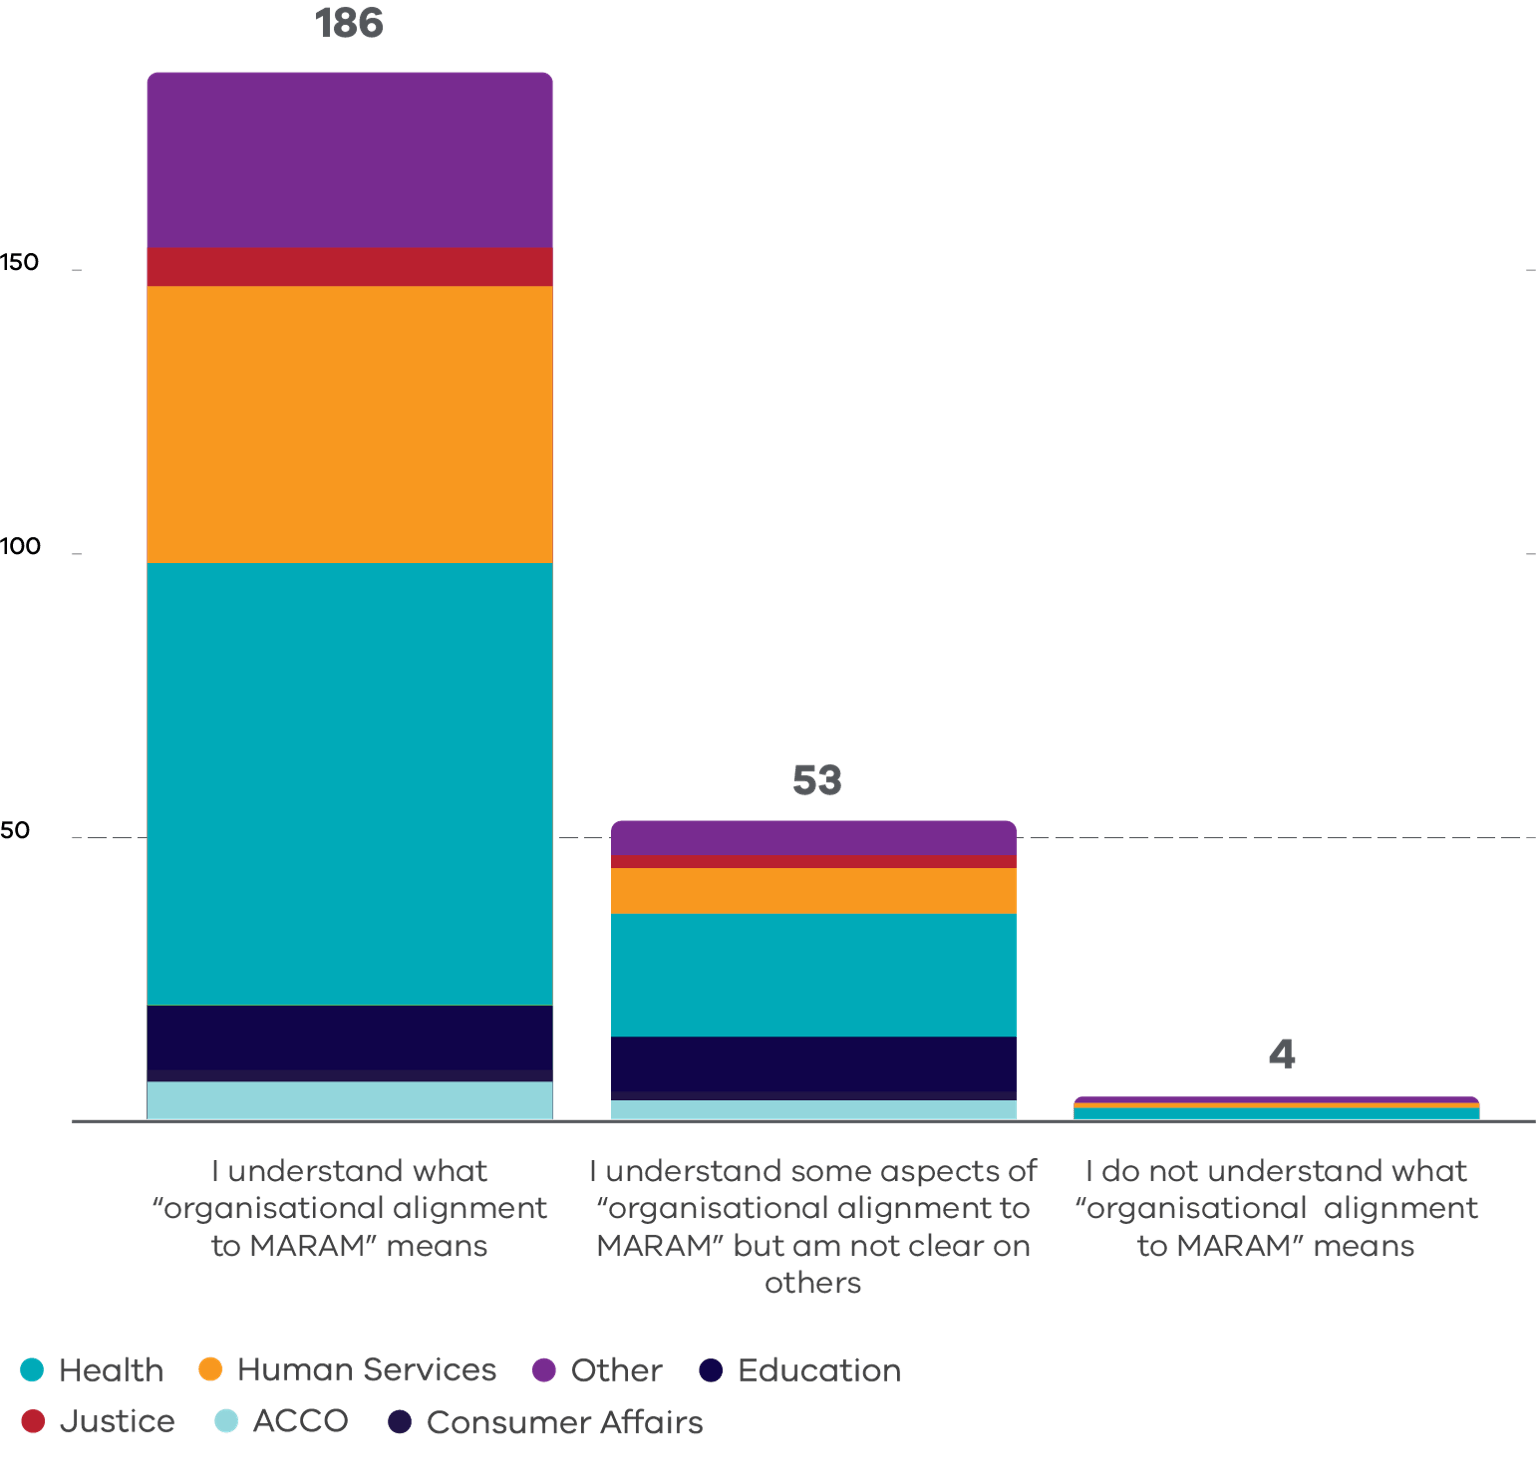
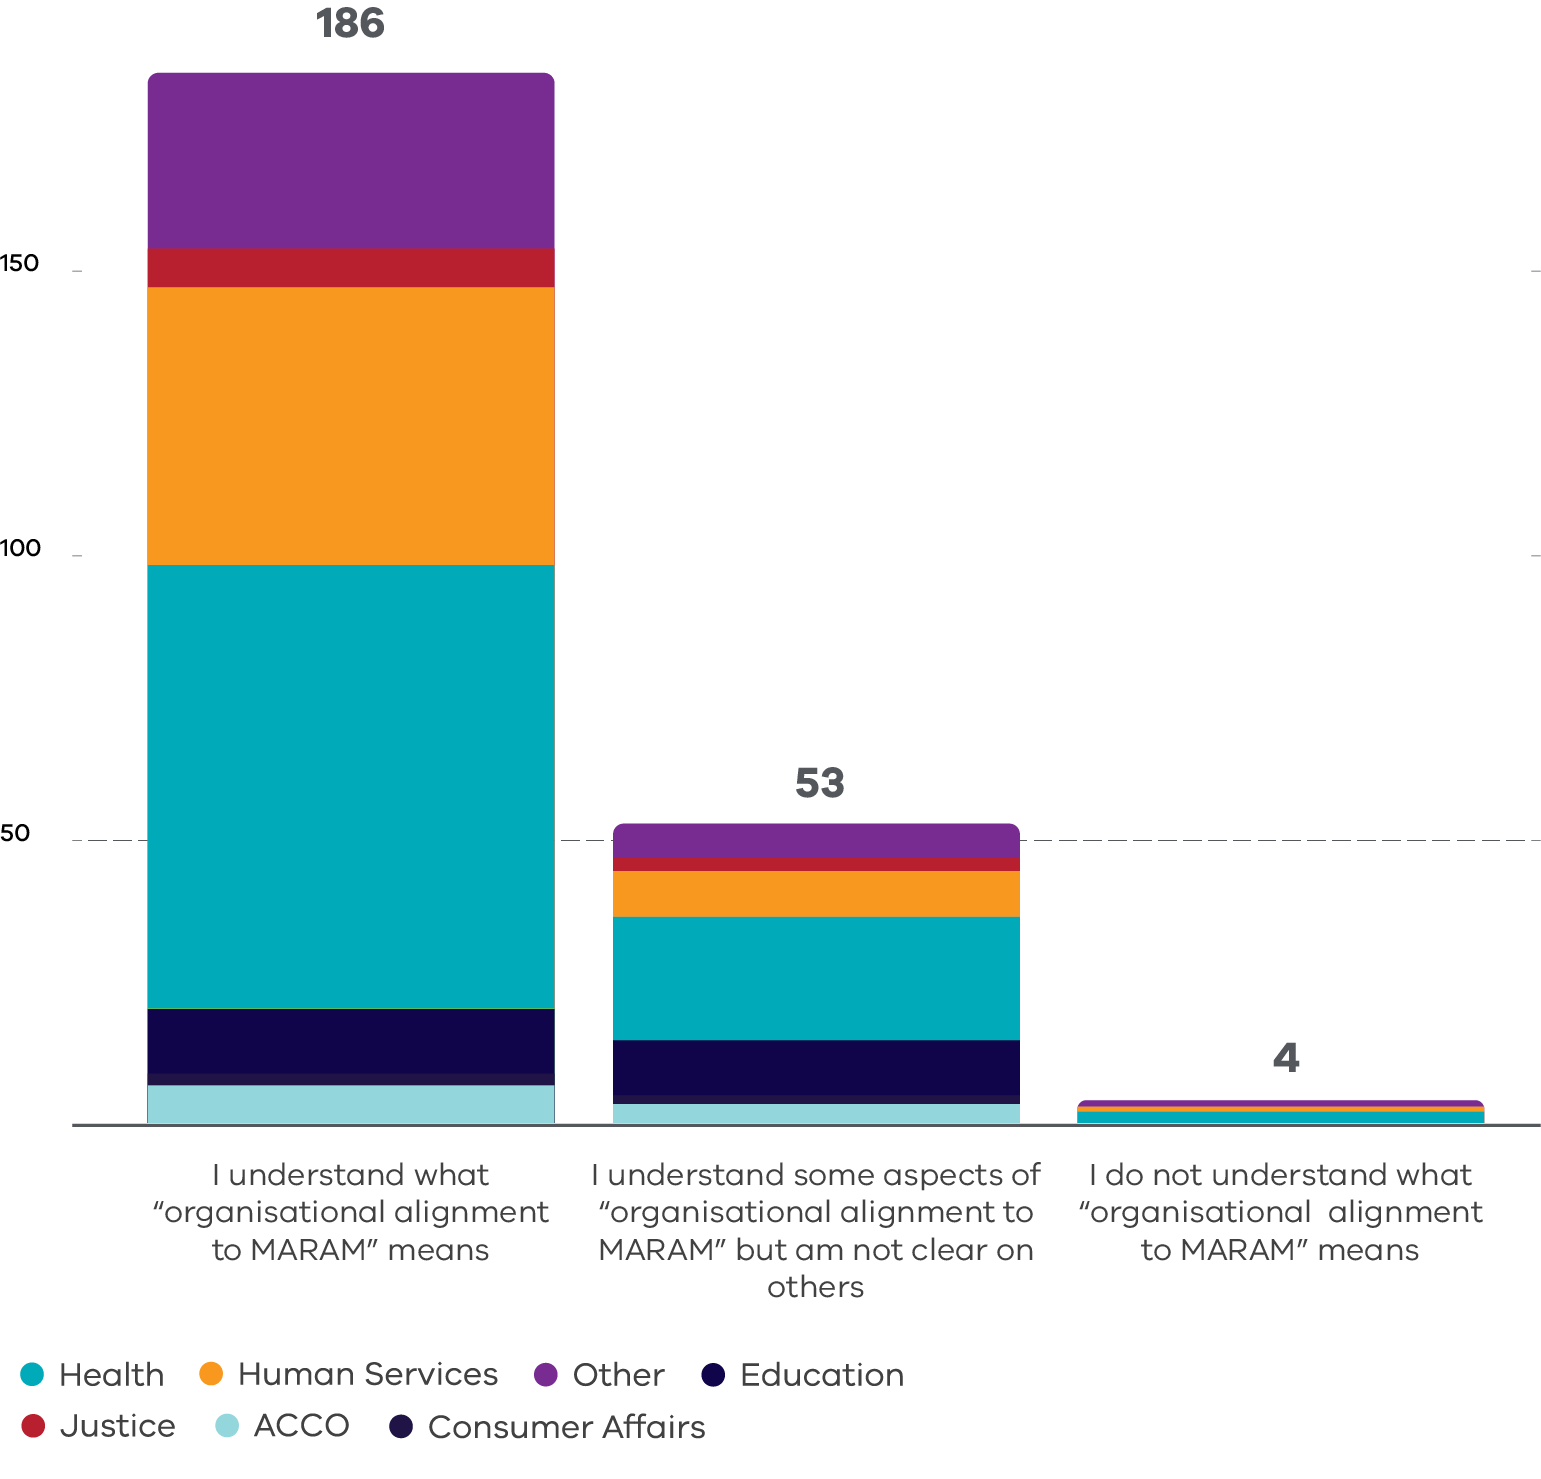
In 2020–21, 81 per cent of respondents understood what organisational alignment to MARAM means, 18 per cent understood some aspects, and one per cent did not understand what organisational alignment means.
The results for 2021–22 show that 76 per cent of respondents now understand MARAM alignment, 22 per cent understand some aspects, and 2 per cent (4 respondents) do not understand what organisational alignment means[1]. While this is a slight drop in understanding, it may reflect that the survey was sent to services newly prescribed to MARAM in April 2021 (noting 2 of the 4 respondents were a health service and ‘other’).
Figure 6: MARAM Annual Survey – Organisational understanding of alignment responsibilities
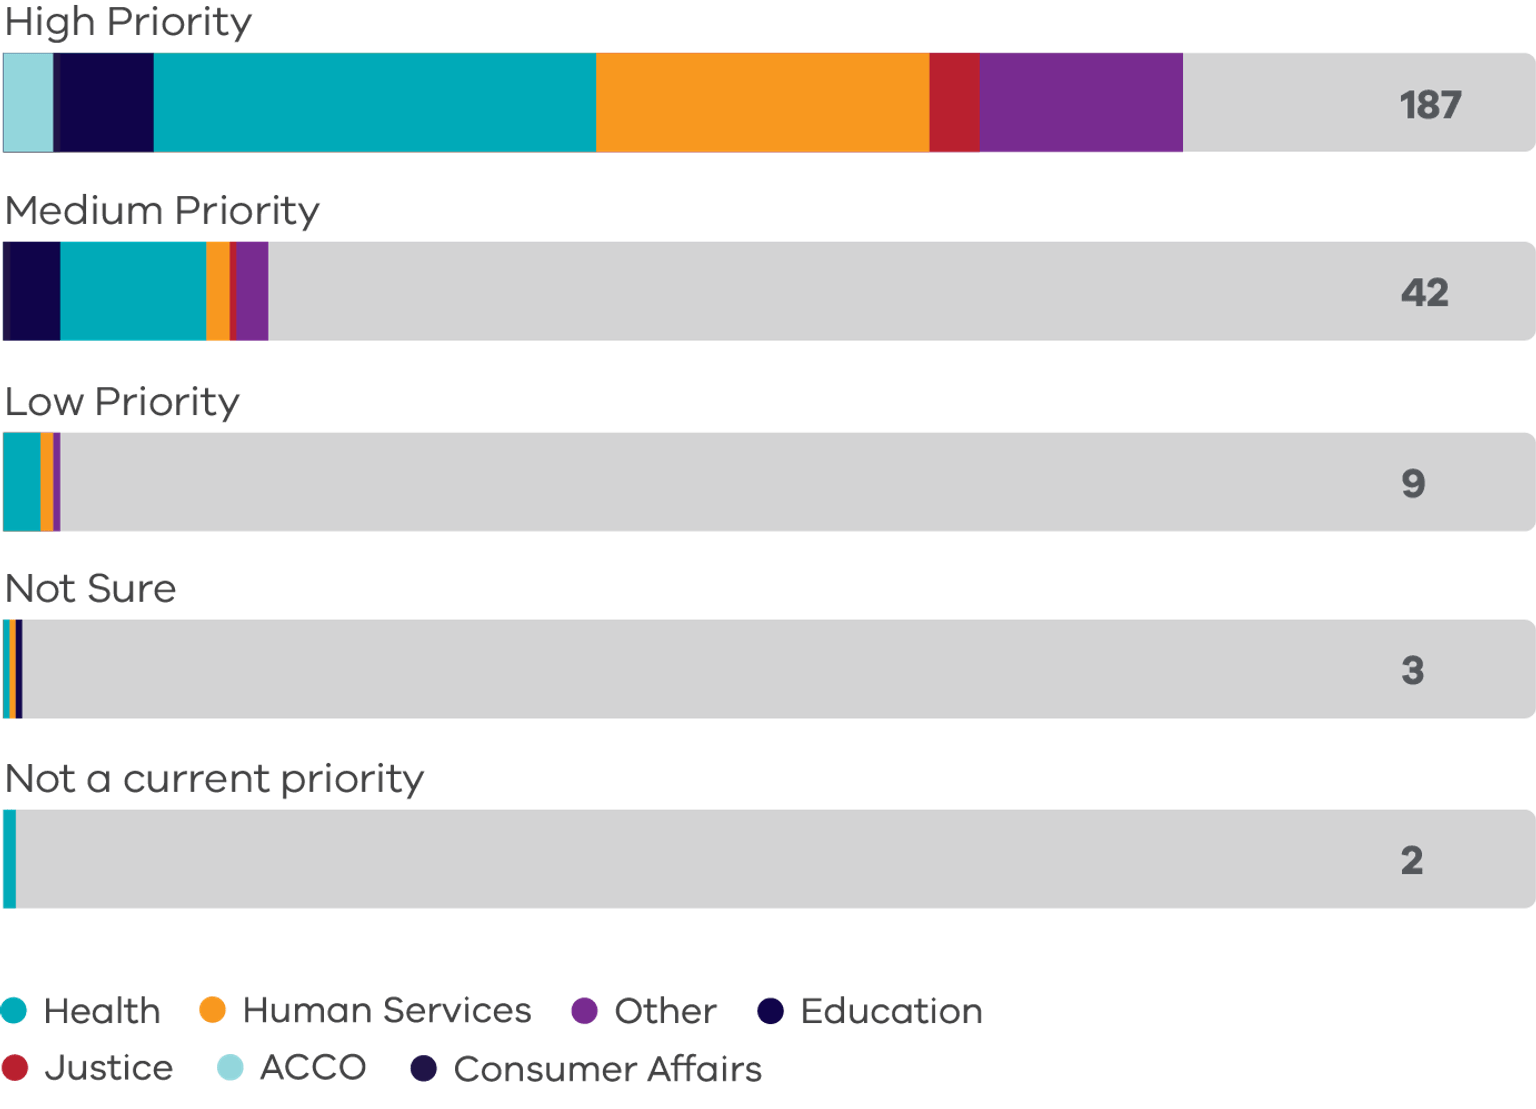
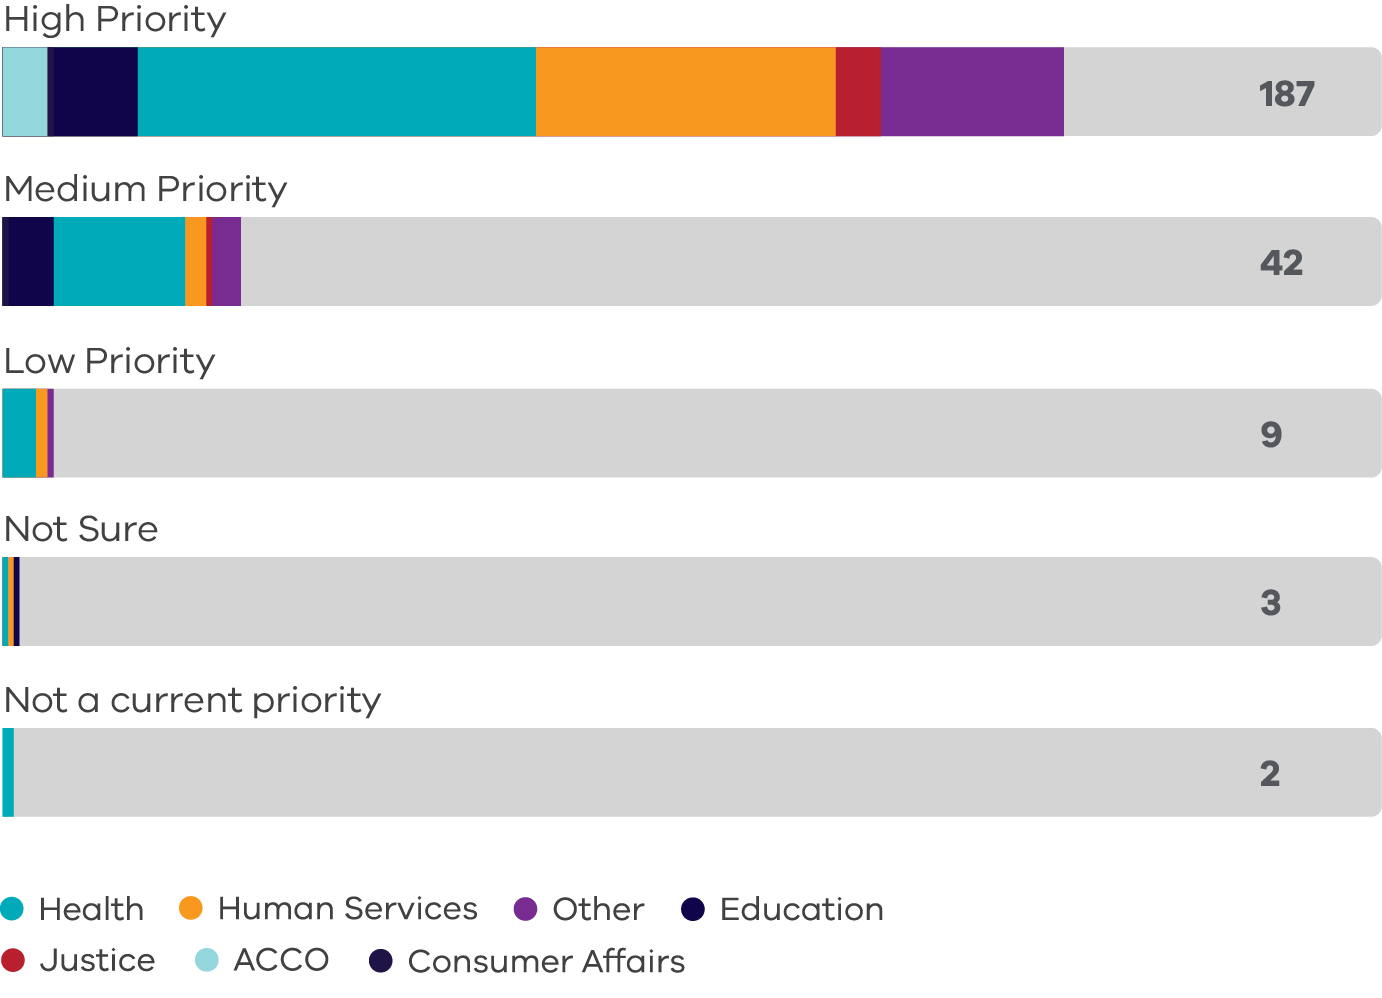
In the 2020–21 survey, 85 per cent of respondents identified MARAM alignment as a high priority, and 15 per cent identified it as a medium priority.
In the 2021–22 survey, 77 per cent identify alignment as a high priority, 17 per cent as a medium priority and 5 per cent as a low priority, not a current priority or unsure. The responses in the 5 per cent were primarily made up of health services. This may be indicative of reform fatigue, and the ongoing pressures resulting from the COVID-19 pandemic and the continuing impact in health settings.
Figure 7: MARAM Annual Survey – Importance of organisational MARAM alignment
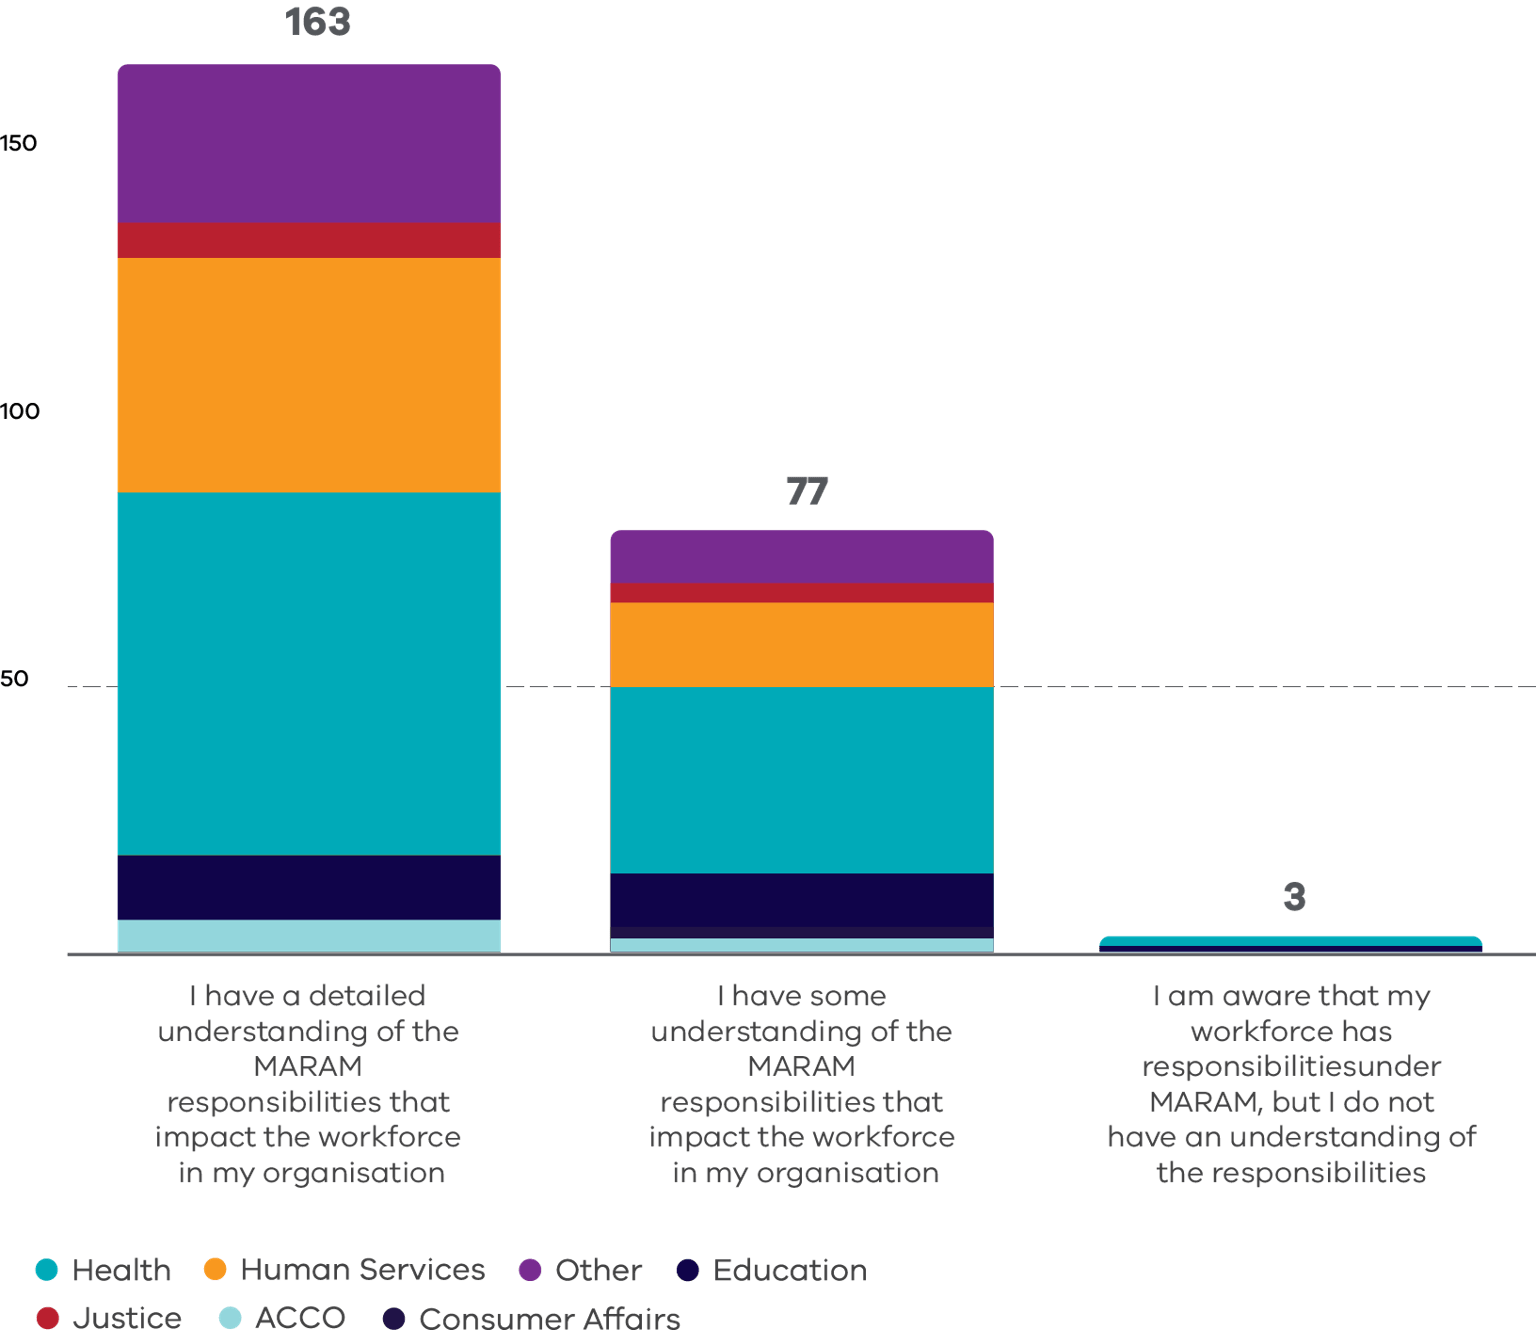
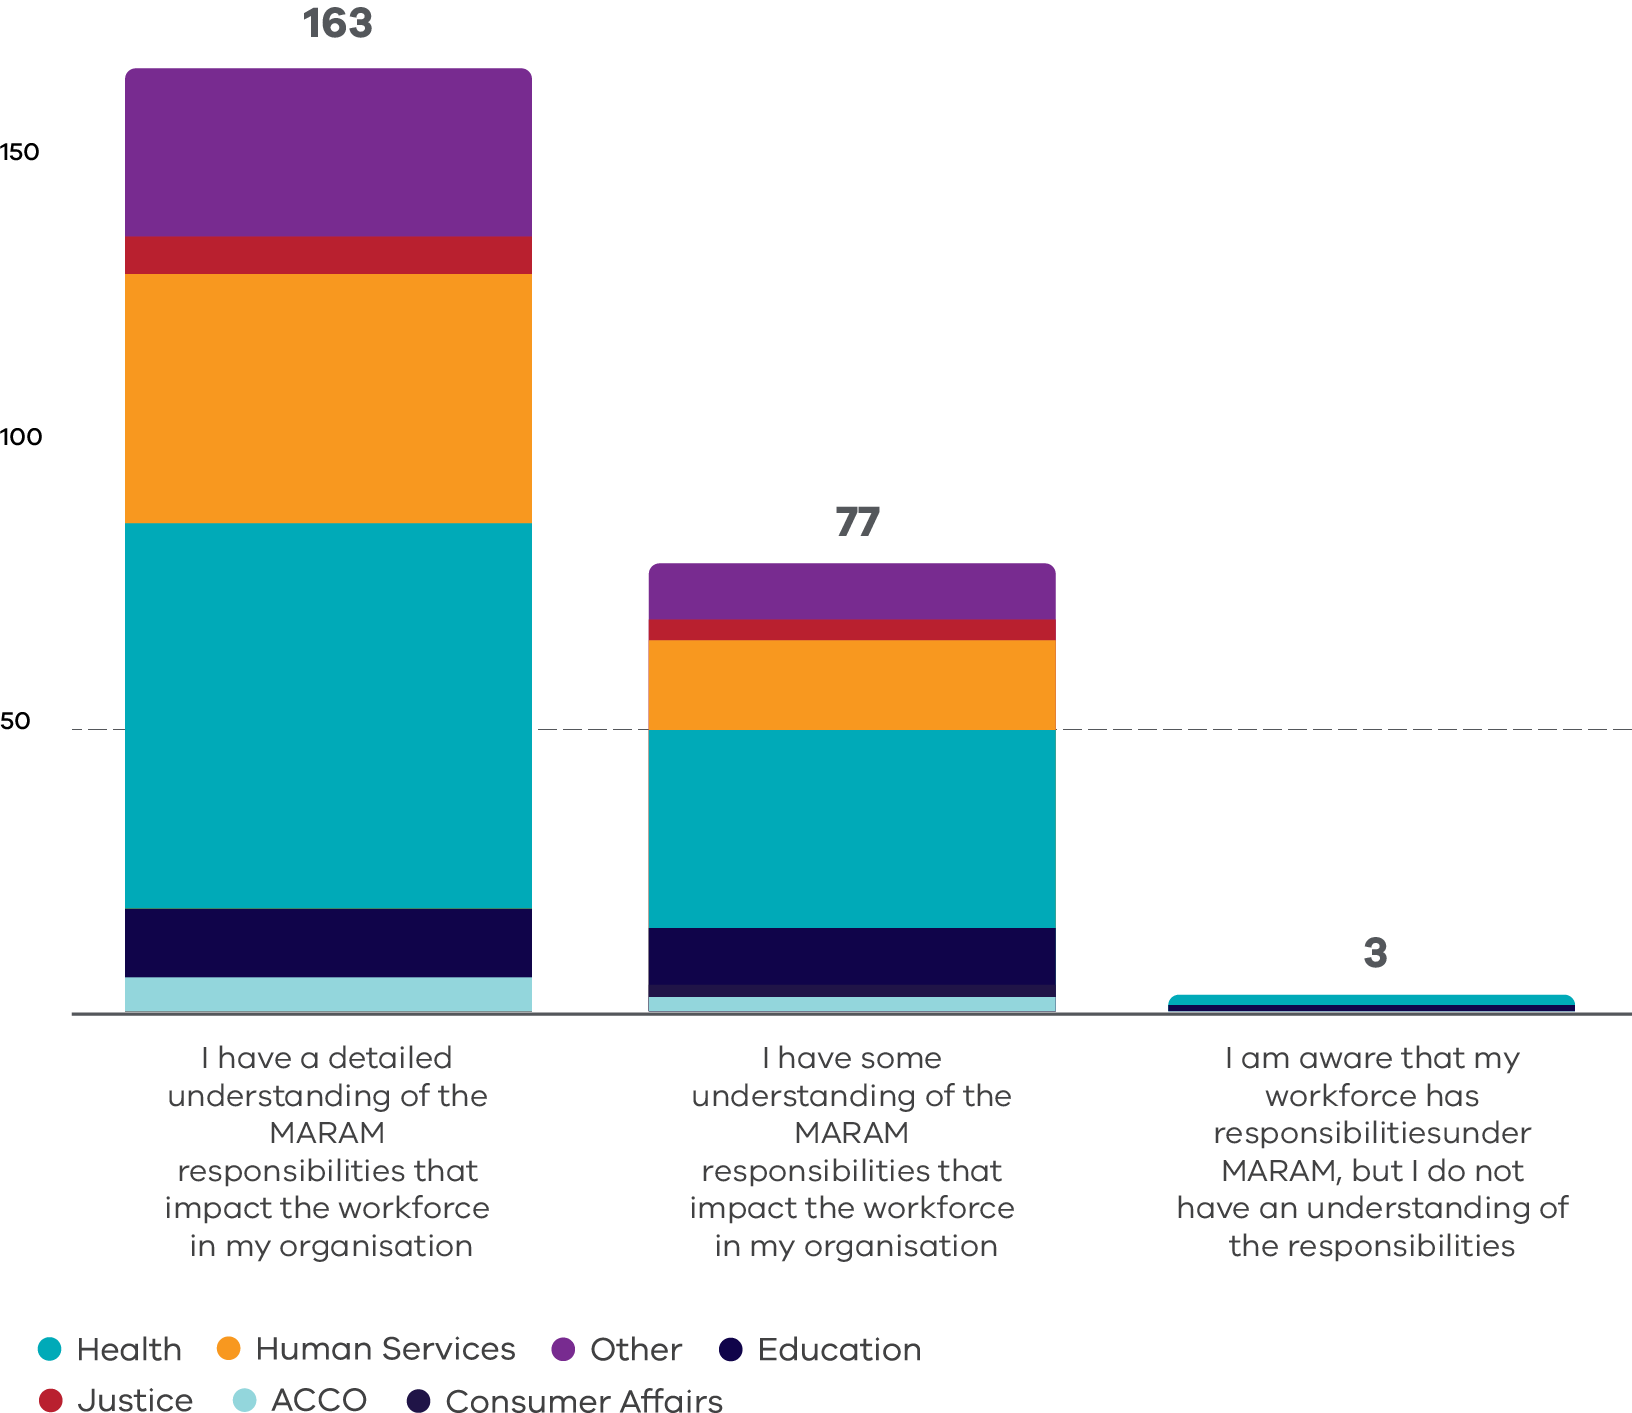
In the 2020–21 survey, 77 per cent of respondents had a detailed understanding of MARAM Responsibilities for their workforce, 22 per cent had some understanding, and the remaining one per cent had no or limited understanding.
In the 2021–22 survey, 67 per cent of respondents had a detailed understanding of MARAM Responsibilities for their workforce, 32 per cent had some understanding, and one per cent had no understanding. Health services make up the significant portion with some understanding. This, again, may be because health services were only prescribed in 2021, and have been responding to the COVID-19 pandemic as a priority.
Figure 8: MARAM Annual Survey – Understanding of MARAM Responsibilities
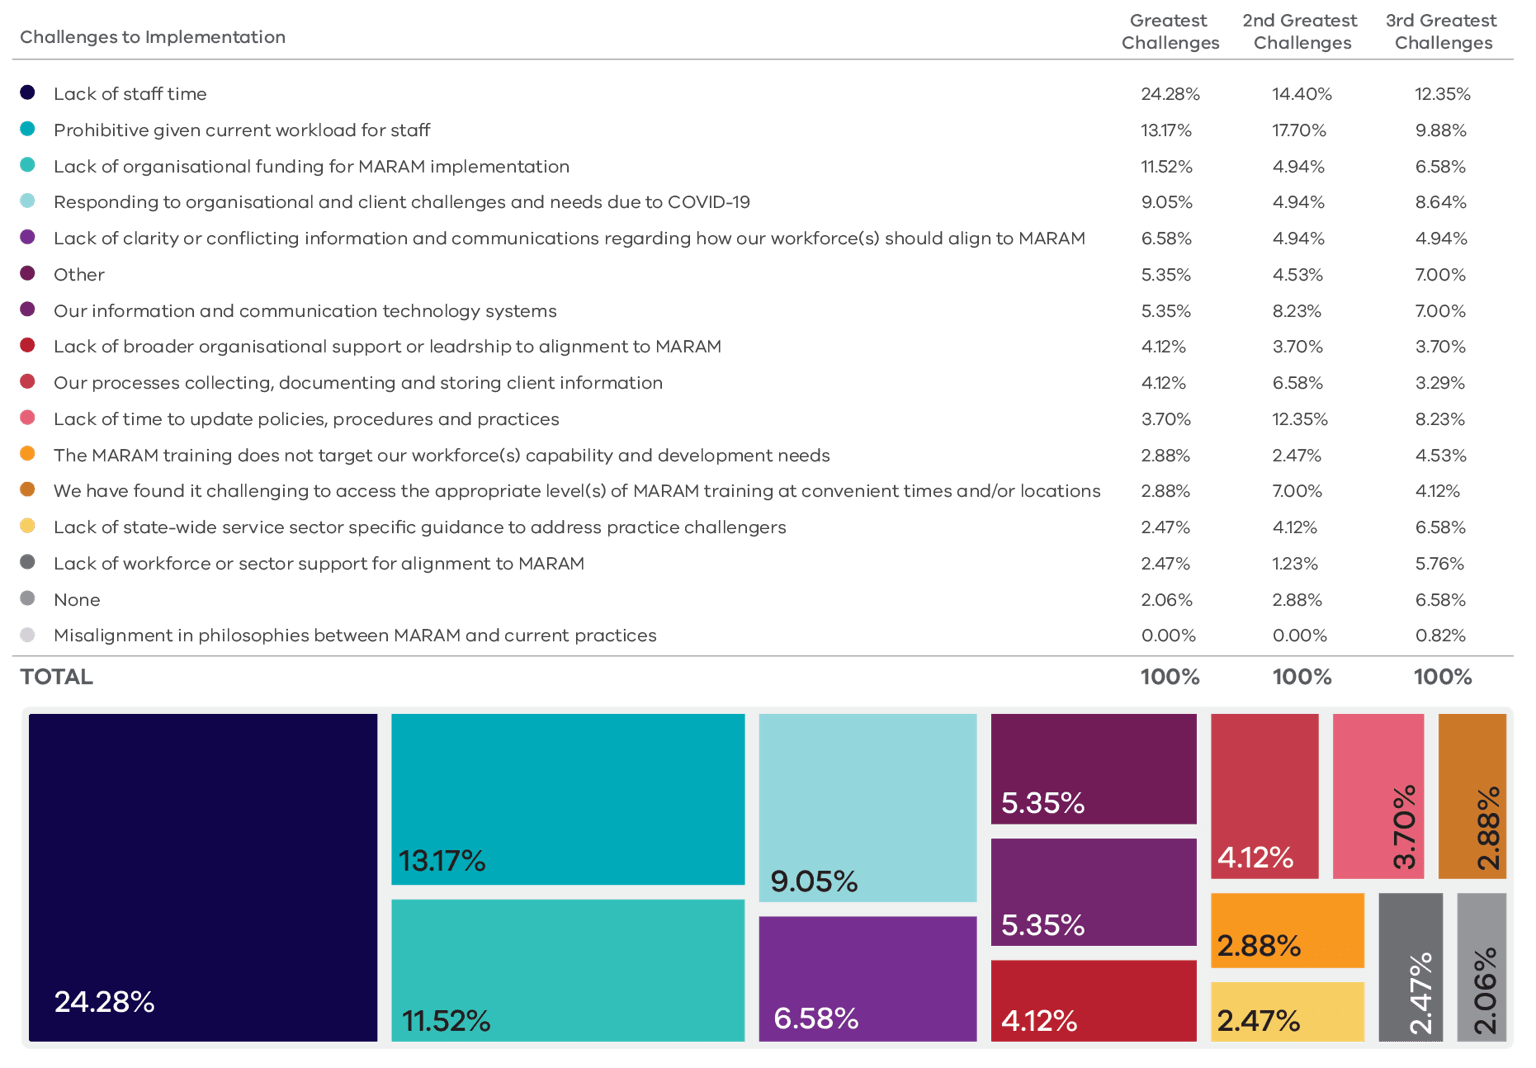
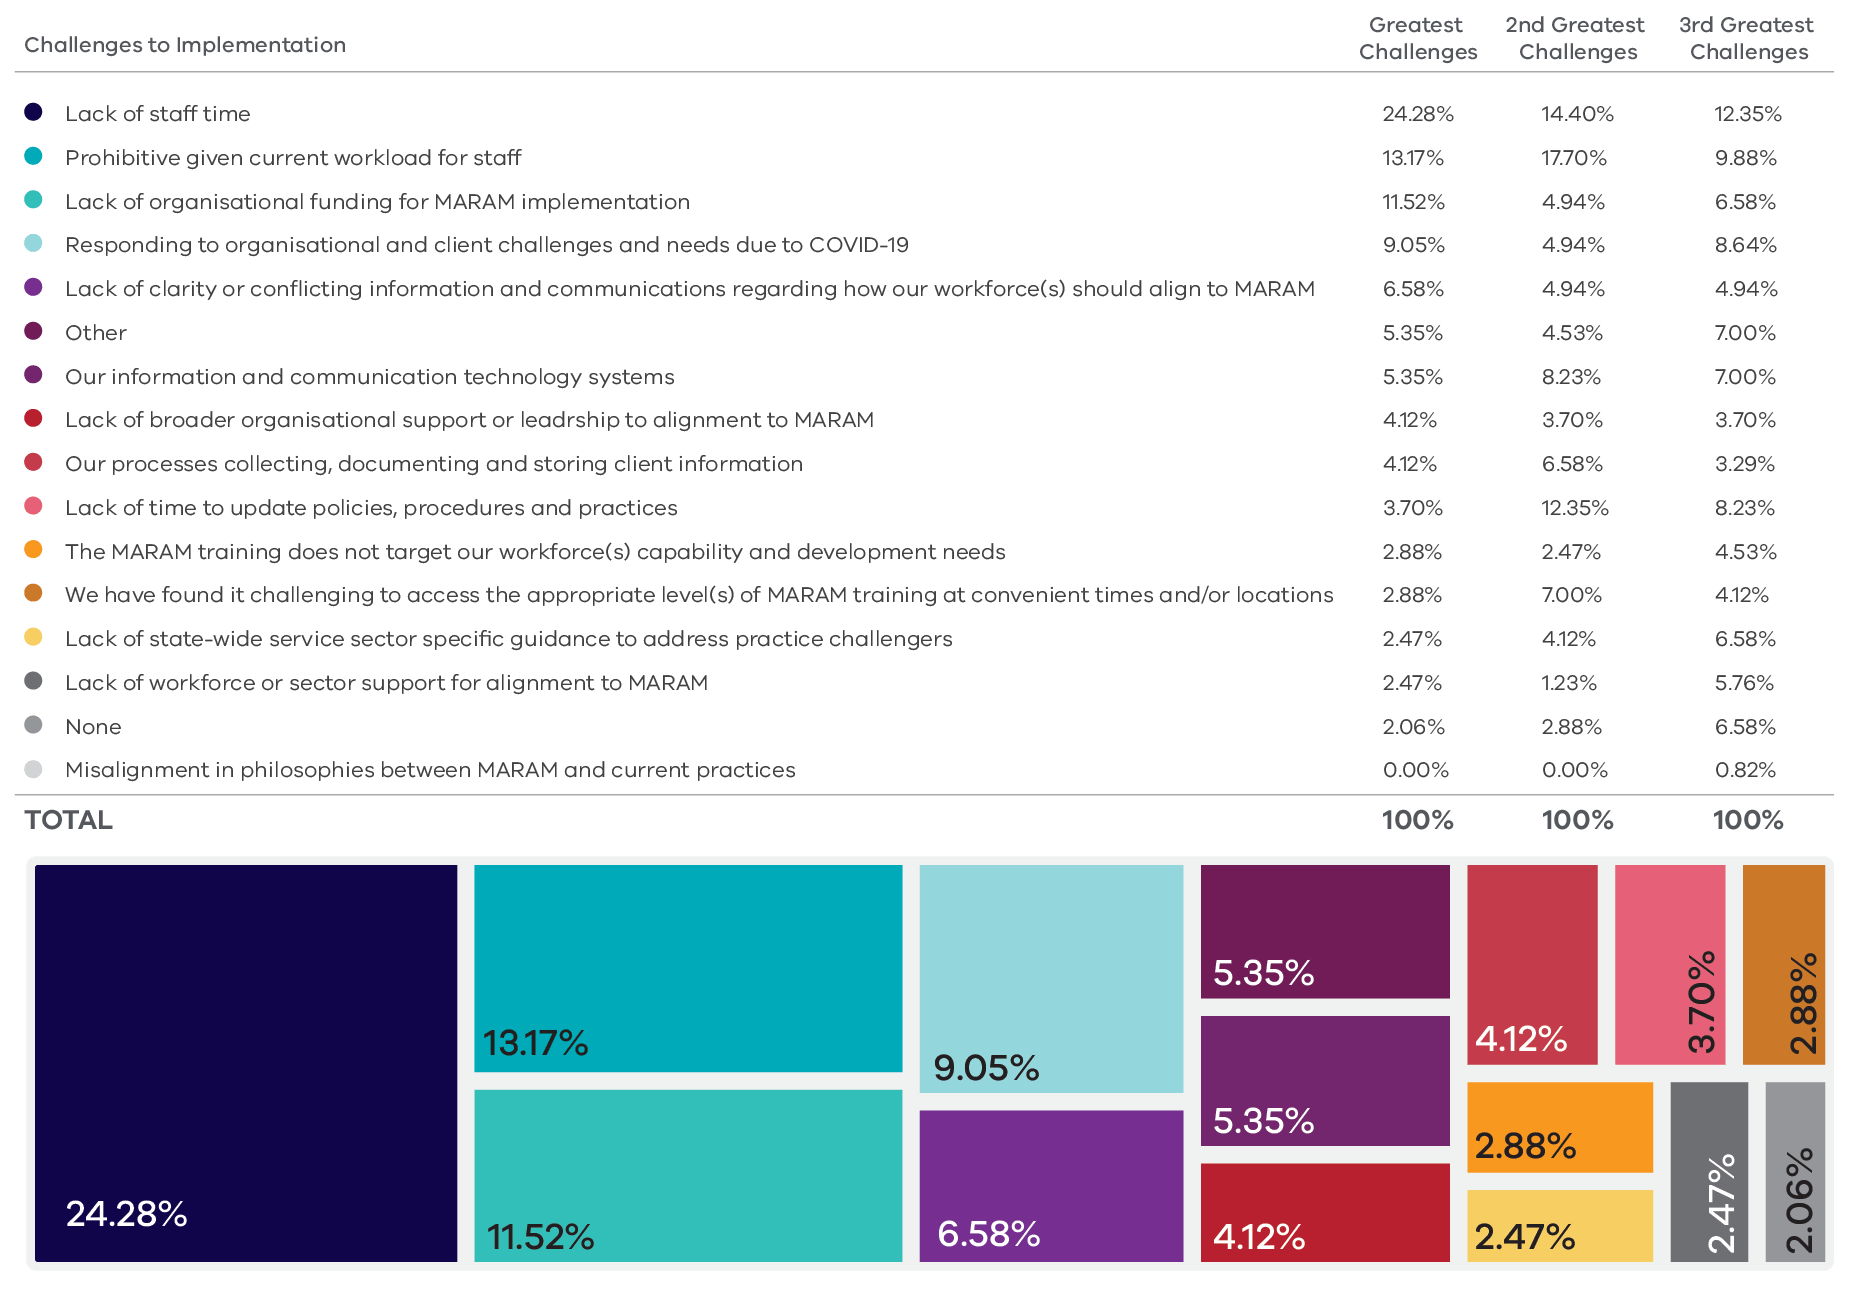
Challenges
In 2020–21, 70 per cent of respondents identified lack of staff time and prohibitive current workload of staff as top challenges to MARAM alignment. For 47 per cent of respondents, lack of organisational funding for MARAM implementation was a challenge.
In 2021–22, the top 3 reasons identified as an implementation challenge continue to be:
- lack of staff time (50 per cent total, 24 per cent as the greatest challenge)
- prohibitive current workload of staff (41 per cent total, 13 per cent as the greatest challenge)
- lack of organisational funding for MARAM implementation (24 per cent total, 12 per cent as the greatest challenge).
It is notable that 23 per cent total recorded that responding to COVID-19 remained a challenge, with 9 per cent rating this as their greatest challenge.
MARAM Annual Survey – Challenges to implementation
[3] Percentages 0.5 and below are rounded down, 0.6 and above are rounded up.
Updated