

The Victorian Skills Plan underpins Victoria’s skills roadmap, to help TAFEs and other training providers plan for courses, industries ensure they have the workers they need, and Victorians with education and training pathway choices for success in work and life.

Victorian Skills Plan for 2025 into 2026
Read the fourth Victorian Skills Plan, a skills roadmap that identifies key action areas for the state’s training needs.
Find out more about the Victorian Skills Plan for 2025 into 2026

Employment Projections Dashboard
Explore up-to-date information on in-demand and emerging jobs in Victoria.

Snapshot of the Victorian Labour Market 2025
Discover the latest labour market trends and insights into future workforce needs across occupations, industries and regions.

Victorian Skills Plan Implementation Update 2025
Read how we are tracking on delivering actions and recommendations from the 2022, 2023 and 2024 Victorian Skills Plans.
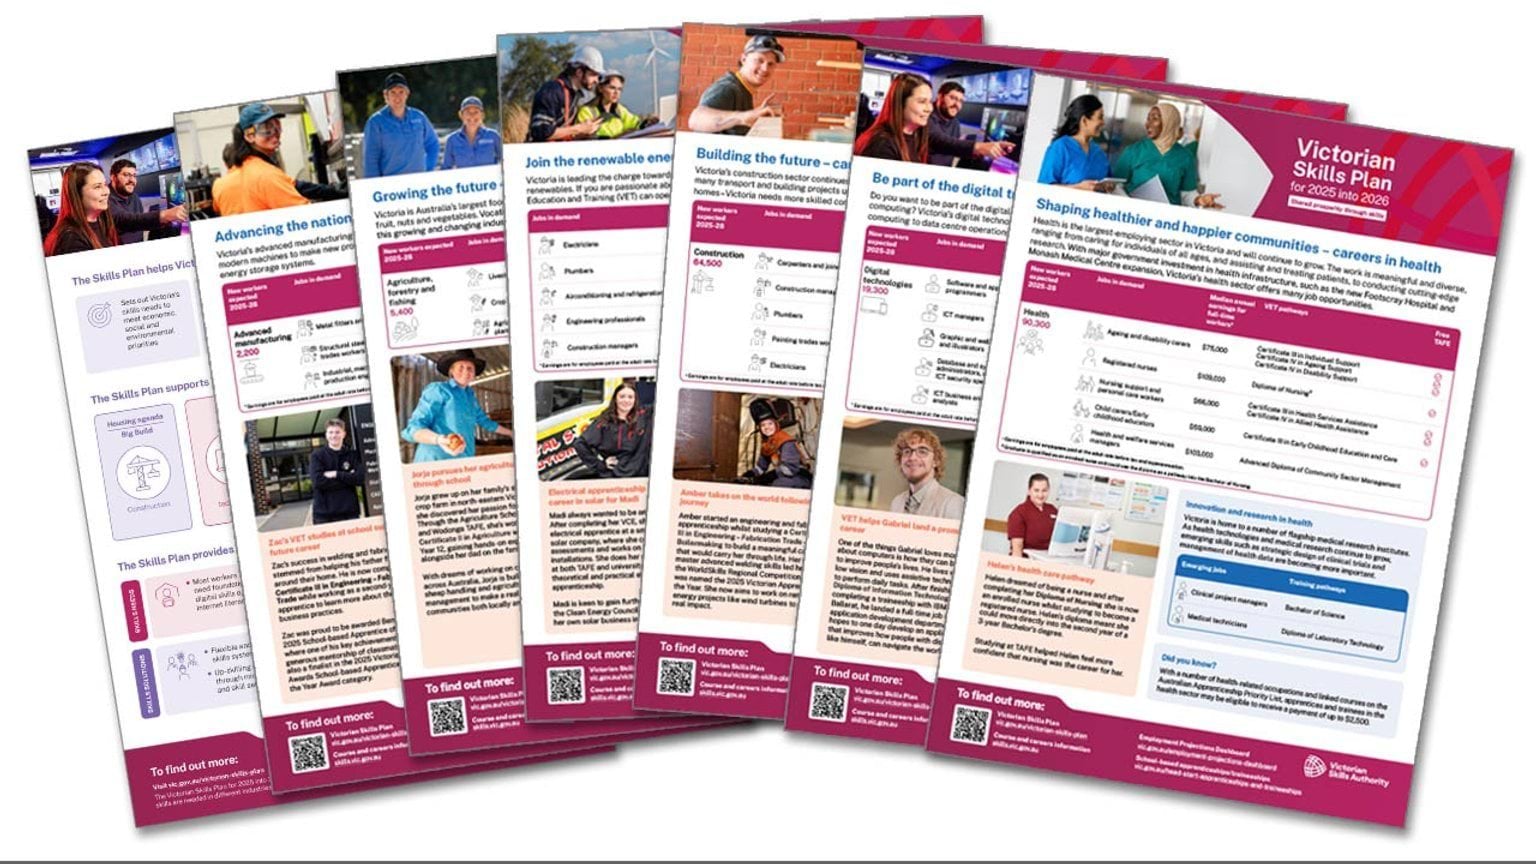
Victorian Skills Plan fact sheets
Read summarised information about Victorian Skills Plan facts and figures.
Previous Victorian Skills Plans

Victorian Skills Plan for 2024 into 2025
Read the Victorian Skills Plan for 2024 into 2025 here.

Victorian Skills Plan for 2023 into 2024
Read the second Victorian Skills Plan and progress on delivery actions.
Victorian Skills Plan for 2022 into 2023
Explore the inaugural Victorian Skills Plan, along with key information.
Updated