

June 2024
Recycling Victoria market insights reports
Recycling Victoria’s Market Insight Reports provide a snapshot of the waste and resource recovery sector’s market resilience and include:
- market profiles for each kerbside waste stream – paper and paperboard, plastics, glass and metals
- trends and opportunities
- special topics.
The reports combine information from:
- the Australian Bureau of Statistics (ABS) export data and published market reports
- national waste and recycling data
- modelling and insights informed by consultation with industry, government, and community stakeholders.
This report includes export data to the end of March 2024, and pricing updates to the end of March 2024.
If you have any questions, comments or feedback regarding this report or suggestions for future content, please contact Recycling Victoria.
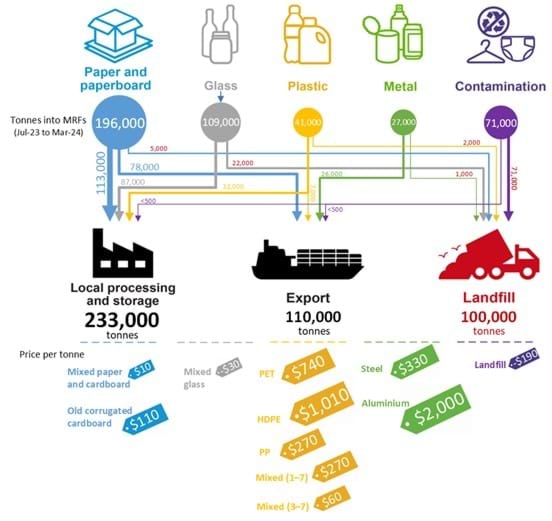
Figure 1 provides an overview of the kerbside collected recyclables flow over the 9-month period from July 2023 to March 2024. Prices are for March 2024.
Figure 1: Overview of kerbside recycling bin materials

Kerbside recycle bin materials sent to landfill
The overall numbers remain similar to those reported for the previous equivalent year. Of the 443,200 tonnes of material collected in the kerbside recycling bin in the nine-month period from July 2023 to March 2024:
- 343,000 tonnes (77%) were sent to downstream processing. Of this, 110,200 (32%) tonnes were exported for further processing.
- 100,200 tonnes (23%) were sent to landfill, comprising of:
- 17% contamination removed at material recovery facilities (MRF). This is often non-recyclable material or bagged recyclable material that cannot be sorted for further processing.
- 6% sorting loss at downstream processing facilities, noting that a substantial proportion of this is glass fragments/fines.
There are no reports of significant stockpiling by metropolitan MRF operators as of March 2024.
Kerbside materials exported
Across July 2023 to March 2024 Victoria’s exports were:
- 30% of national exported post-consumer paper and paperboard (228,200 tonnes of 768,900 tonnes), compared with a 27% average across the 2022–23 financial year.
- 42% of national exported post-consumer plastic (22,800 tonnes of 54,300 tonnes), compared with an average 68% across the 2022–23 financial year.
The exports outlined above include material sourced through commercial and industrial collections (in addition to municipal kerbside collected materials), and some interstate material, for example from Tasmania.
The Australian Government has imposed two restrictions on the export of plastics. Exports of mixed scrap plastics have been banned since 30 June 2021, and exports of plastic packaging that has not been shredded, washed and sorted into single polymer types have been banned since 30 June 2022. (without specific export licence exemptions). Victorian plastic exports have trended downwards because of both. Average monthly quantities of plastics exported from Victoria are well below 1,000 tonnes for the 2023–24 financial year so far (July 2023 to March 2024), compared to the long-term monthly average of around 2,000 tonnes in the years prior to the bans.
Regulations on the export of paper and cardboard will commence on 30 June 2024, so this has not precipitated a decrease in exports for 2023–24 (July 2023 to March 2024).
Market-wide developments
Paper and paperboard packaging
- Global pulp prices – returned to strong growth in early 2024 as supply-side challenges impacted all fibre costs.
- Mixed recovered paper prices have increased in the first half of 2024.
- Local market conditions have stabilised, supplemented by exports, with new retail-focused products made from recovered fibre absorbing some volumes.
- Impending introduction of export licencing for fibre has caused limited practical impact to date, with no observable or expected market disruptions.
Glass packaging
- CDS Vic has passed its sixth month of operation. Beginning in November 2023, the container returns continue to increase and Victoria’s network of refund points continue to grow to meet demand, making the scheme the most convenient and accessible in the country.
- Visy’s expanded Laverton glass beneficiation plant is now operating. The new plant can optically sort glass down to 3mm in size (previously it was down to 10mm in size). The resulting cullet will be used by the glass packaging manufacture plant in Spotswood in support of Visy’s target of 70% recycled glass in new glass packaging.
- Visy and Orora continue to push up the post-consumer recycled content in glass packaging: This has increased from approximately 30–35% in 2020 to an average of a little more than 40% as of 2021–22, and possibly as much as 55–60% by the first half of 2024.
Plastic packaging
- Prices for recovered polyethylene terephthalate (PET) bottles started low in 2023–24 but rose across the financial year. PET packaging scrap prices fell at the start of 2023–24 to around the $200–$250 per tonne mark, compared to values of around $420–$500 per tonne by the end of 2022-23. The PET export price saw strong growth across the financial year, however, with average values in February and March 2024 of about $520 and $735 per tonne, respectively.
- Prices for recovered high-density polyethylene (HDPE) bottles have remained strong but also dipped at the start of 2023–24. The average HDPE packaging scrap price in September 2023 was about $855 per tonne, but this increased to over $1,000 per tonne by March 2024.
- Plastic reprocessing capacity increasing. The Circular Plastics Australia PET plant in Altona North and PE plant in Laverton are now operating. Cleanaway and Viva Energy have teamed up to undertake a prefeasibility assessment for soft plastic reprocessing solutions.
Metal packaging
- Prices for recovered tin-plate steel cans and aluminium beverage cans have recovered strongly over the last three years from the mid-2020 lows. They are trading at relatively high levels across 2023 and 2024, coming off price peaks around March 2022. Prices for both tin-plate steel cans and aluminium beverage cans decreased from the very high prices seen in the first half of 2022, were strong across 2023 and decreased slightly into 2024.
- Exports of tin plate steel cans and aluminium beverage cans has softened. Exported quantities grew steadily from mid-2022 through to mid-2023, high before dropping back slightly. Scrap metal cans continue to trade at relatively high levels.
Report disclaimer
The information in this report was prepared in conjunction with Blue Environment and IndustryEdge.
While reasonable efforts have been made to ensure that the contents of this publication are factually correct, Recycling Victoria gives no warranty regarding its accuracy, completeness, currency or suitability for any particular purpose and to the extent permitted by law, does not accept any liability for loss or damages incurred as a result of reliance placed upon the content of this publication.
This publication is provided on the basis that all persons accessing it undertake responsibility for assessing the relevance and accuracy of its content.
Recycling Victoria does not accept any liability for loss or damage arising from your use of or reliance on the Data. The inclusion of information in this report does not constitute Recycling Victoria’s endorsement of any particular facility, or any associated organisation, product or service.
Accessibility disclaimer
The Victorian Government is committed to providing a website that is accessible to the widest possible audience, regardless of technology or ability.
This page contains embedded complex image files (Figure 1) that may not meet our minimum WCAG AA Accessibility standards.
If you are unable to read any of the content of this page, you can contact the content owners for an Accessible version.
Contact email: rvdata@deeca.vic.gov.au
Updated